| Param | Original file | Final file |
|---|---|---|
| Filename | modeM0/AS1A05_160T01_9000003078_20862cztM0_level2.evt | modeM0/AS1A05_160T01_9000003078_20862cztM0_level2_quad_clean.evt |
| Size (bytes) | 763,315,200 | 83,082,240 |
| Size | 728.0 MB | 79.2 MB |
| Events in quadrant A | 3,763,099 | 531,876 |
| Events in quadrant B | 3,894,729 | 543,032 |
| Events in quadrant C | 3,848,755 | 501,544 |
| Events in quadrant D | 11,090,737 | 404,009 |
| Mode M9 | |||
|---|---|---|---|
| Quadrant | BADHDUFLAG | Total packets | Discarded packets |
| A | 0 | 8 | 0 |
| B | 0 | 8 | 0 |
| C | 0 | 8 | 0 |
| D | 0 | 8 | 0 |
| Mode M0 | |||
|---|---|---|---|
| Quadrant | BADHDUFLAG | Total packets | Discarded packets |
| A | 0 | 16024 | 3 |
| B | 0 | 16213 | 3 |
| C | 0 | 16151 | 3 |
| D | 0 | 38307 | 5 |
| Mode SS | |||
|---|---|---|---|
| Quadrant | BADHDUFLAG | Total packets | Discarded packets |
| A | 0 | 160 | 0 |
| B | 0 | 160 | 0 |
| C | 0 | 160 | 0 |
| D | 0 | 160 | 0 |
| Quadrant | Total seconds | Saturated seconds | Saturation percentage |
|---|---|---|---|
| A | 7679 | 161 | 2.096627% |
| B | 7679 | 192 | 2.500326% |
| C | 7680 | 209 | 2.721354% |
| D | 7679 | 2034 | 26.487824% |
Noise dominated data is calculated using 1-second bins in cleaned event files. If a bin has >2000 counts, and if more than 50% of those come from <1% of pixels, then it is considered to be noise-dominated and hence unusable.
| Quadrant | # 1 sec bins | Bins with >0 counts | Bins with >2000 counts | High rate bins dominated by noise | Noise dominated (total time) | Noise dominated (detector-on time) | Marked lightcurve |
|---|---|---|---|---|---|---|---|
| A | 8579 | 7682 | 0 | 0 | 0.00% | 0.00% | 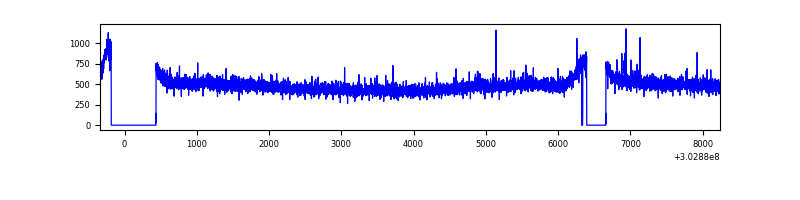 |
| B | 8579 | 7682 | 8 | 8 | 0.09% | 0.10% | 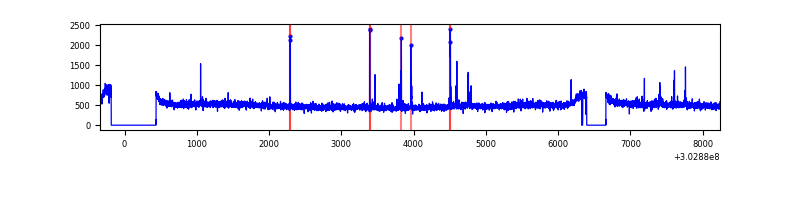 |
| C | 8580 | 7683 | 0 | 0 | 0.00% | 0.00% | 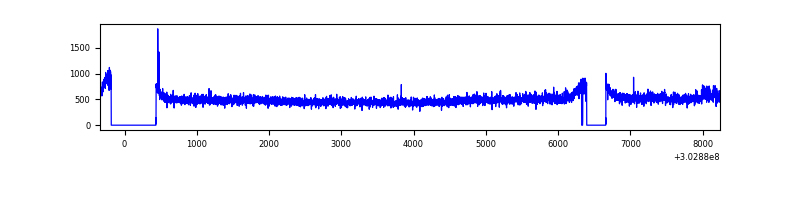 |
| D | 8579 | 7682 | 1952 | 1952 | 22.75% | 25.41% | 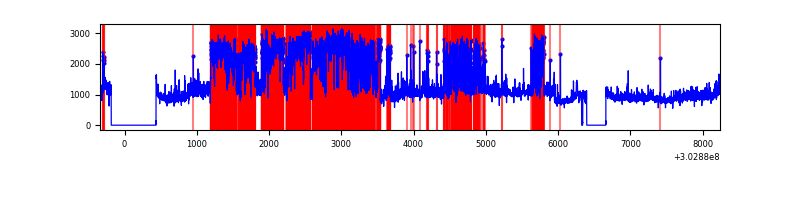 |
Top three noisy pixels from each quadrant. If the there are fewer than three noisy pixels in the level2.evt file, extra rows are filled as -1
| Pixel properties | Quadrant properties | ||||||
|---|---|---|---|---|---|---|---|
| Quadrant | DetID | PixID | Counts | Sigma | Mean | Median | Sigma |
| A | 15 | 174 | 13451 | 63.58 | 973 | 949 | 196.6 |
| A | 5 | 16 | 10822 | 50.21 | 973 | 949 | 196.6 |
| A | 3 | 137 | 8521 | 38.51 | 973 | 949 | 196.6 |
| B | 0 | 189 | 52065 | 272.43 | 968 | 944 | 187.6 |
| B | 12 | 111 | 23001 | 117.55 | 968 | 944 | 187.6 |
| B | 0 | 229 | 21757 | 110.92 | 968 | 944 | 187.6 |
| C | 14 | 238 | 143866 | 666.03 | 918 | 923 | 214.6 |
| C | 3 | 233 | 110488 | 510.51 | 918 | 923 | 214.6 |
| C | 7 | 247 | 6784 | 27.31 | 918 | 923 | 214.6 |
| D | 1 | 52 | 4000529 | 19446.36 | 845 | 818 | 205.7 |
| D | 1 | 239 | 3246373 | 15779.7 | 845 | 818 | 205.7 |
| D | 1 | 20 | 366303 | 1776.97 | 845 | 818 | 205.7 |
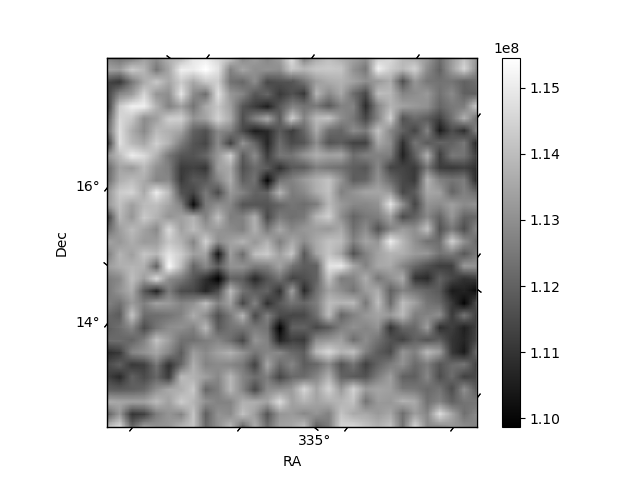
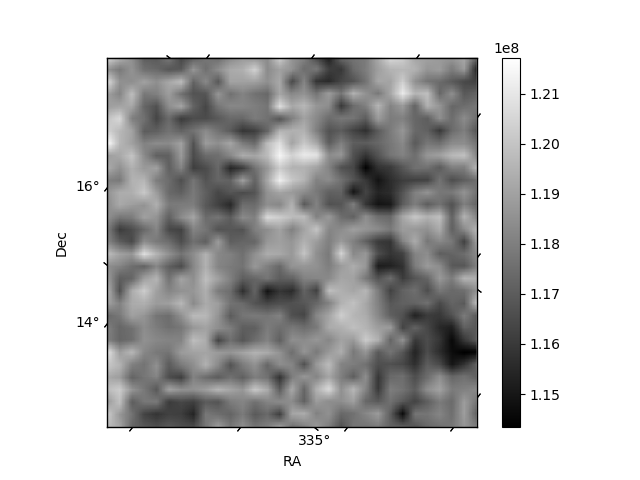
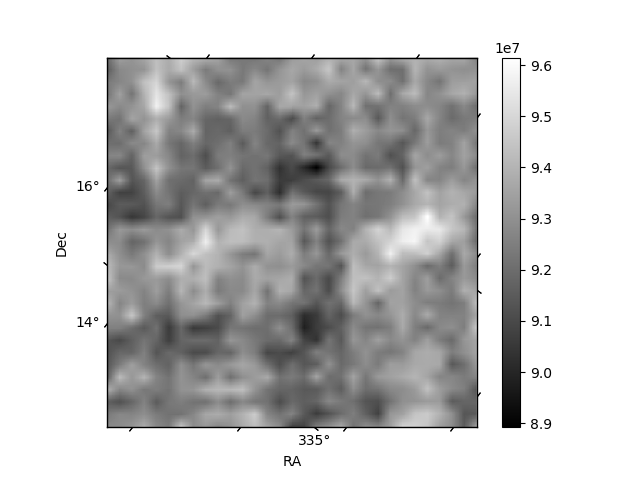
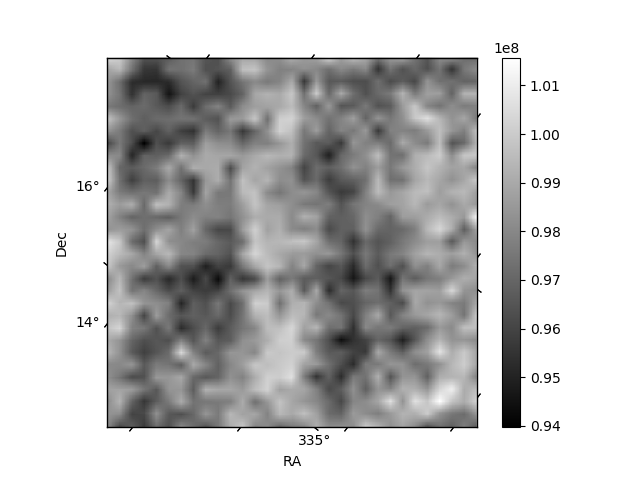
Histogram calculated using DETX and DETY for each event in the final _common_clean file
| Quadrant A | 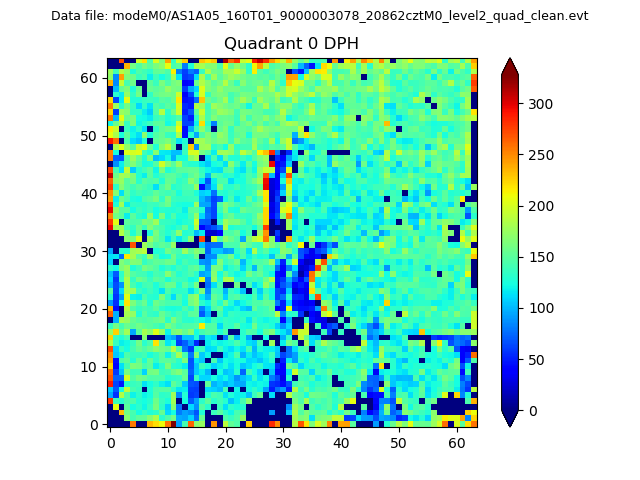 |
 |
Quadrant B |
|---|---|---|---|
| Quadrant D |  |
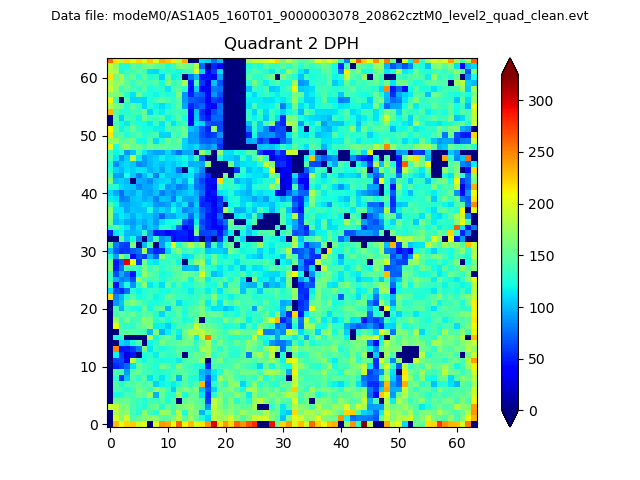 |
Quadrant C |
| Plot type | Count rate plots | Images |
|---|---|---|
| Comparison with Poisson distribution Blue bars denote a histogram of data divided into 1 sec bins. Red curve is a Poisson curve with rate = median count rate of data. |
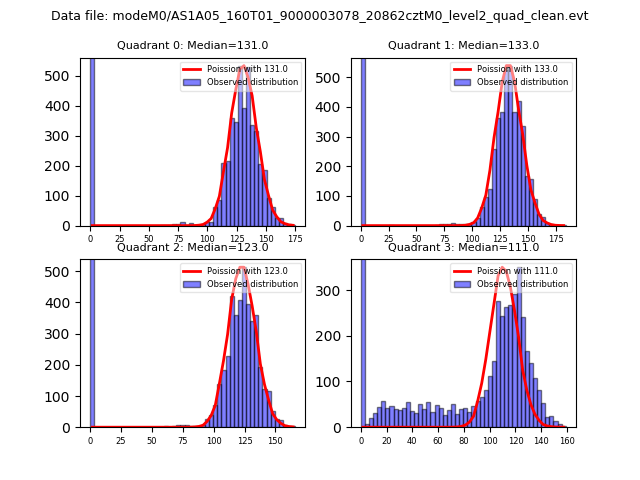 |
 |
| Quadrant-wise count rates Data is divided into 100 sec bins |
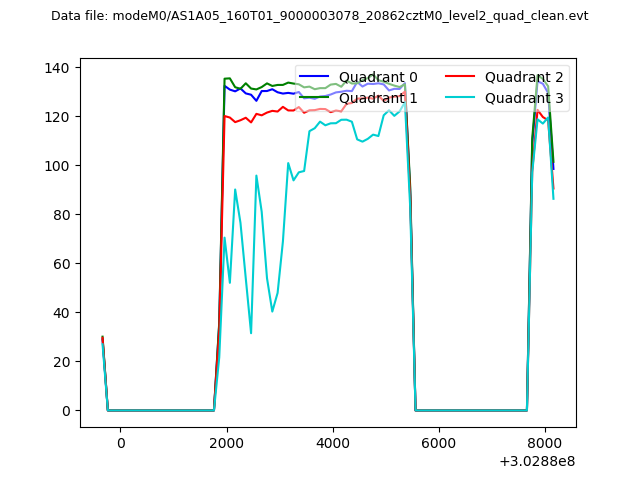 |
|
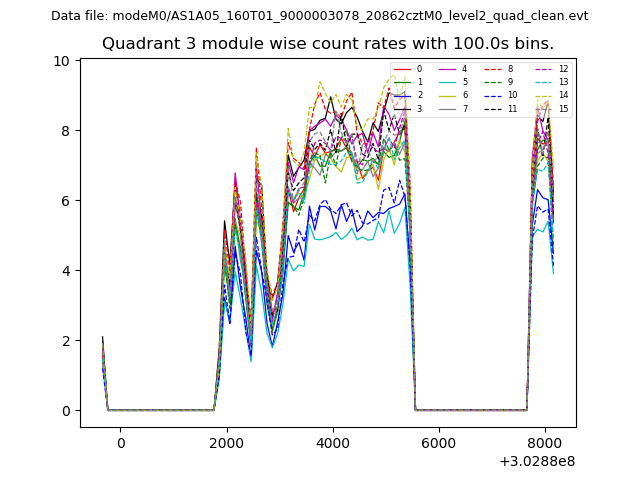
| Module-wise count rates for Quadrant A Data is divided into 100 sec bins |
 |
 |
| Module-wise count rates for Quadrant B Data is divided into 100 sec bins |
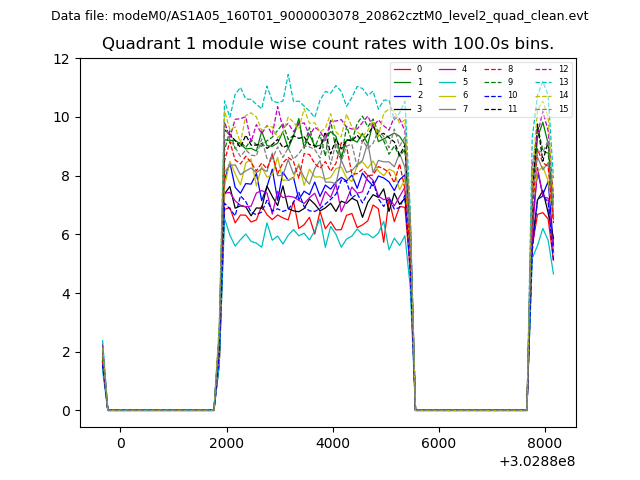 |
 |
| Module-wise count rates for Quadrant C Data is divided into 100 sec bins |
 |
 |
| Module-wise count rates for Quadrant D Data is divided into 100 sec bins |
 |
 |
| Parameter | Plot |
|---|---|
| CZT HV Monitor |  |
| D_VDD | 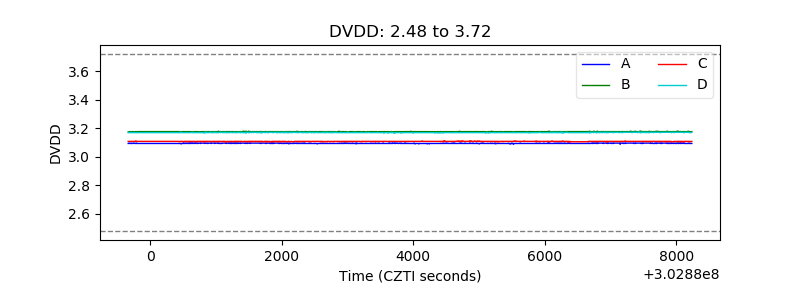 |
| Temperature 1 | 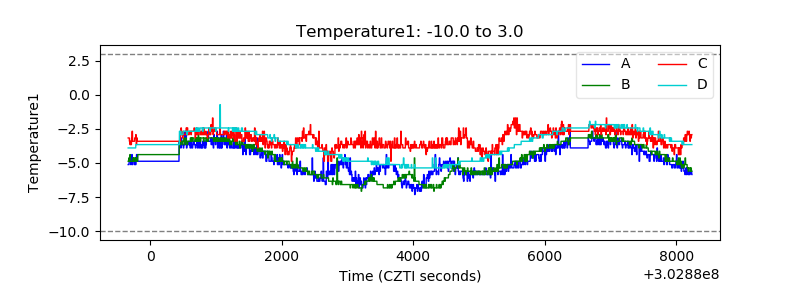 |
| Veto HV Monitor | 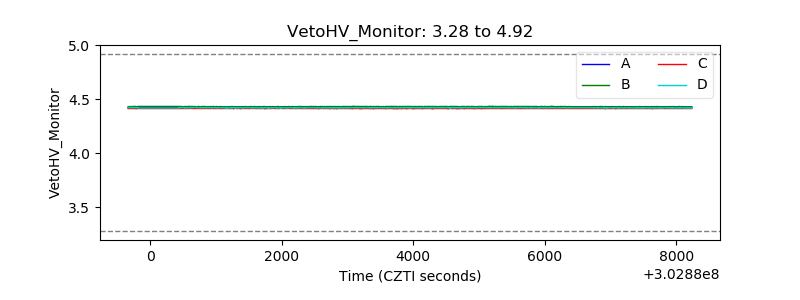 |
| Veto LLD | 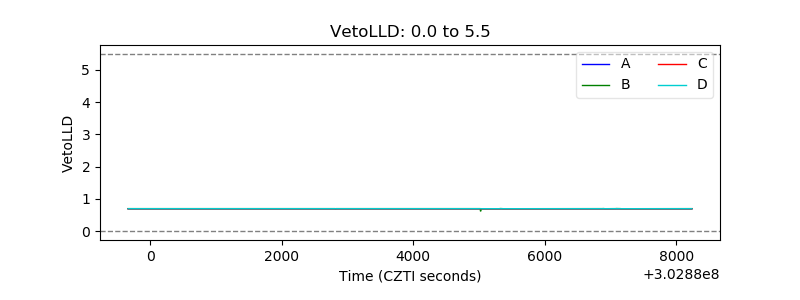 |
| Alpha Counter | 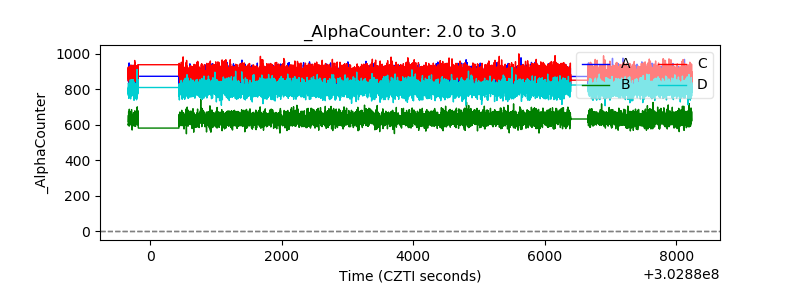 |
| _CPM_Rate | 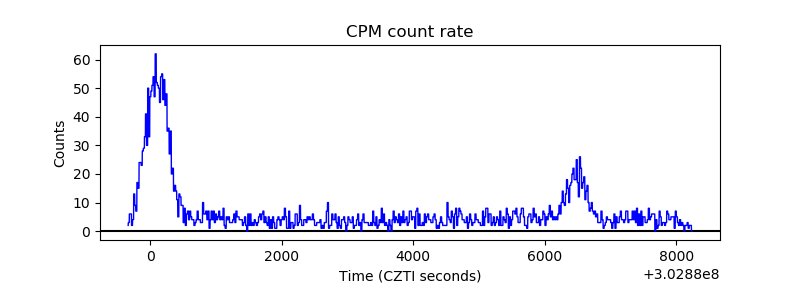 |
| CZT Counter | 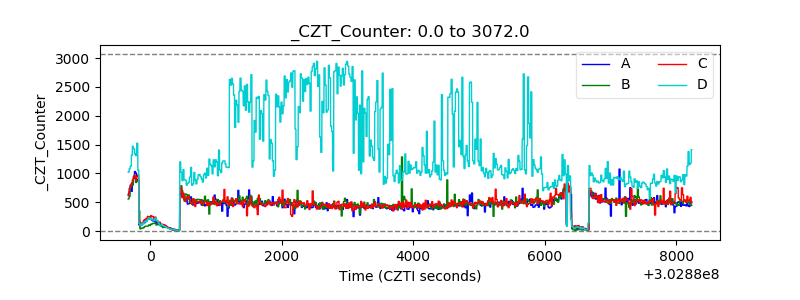 |
| +2.5 Volts monitor |  |
| +5 Volts monitor | 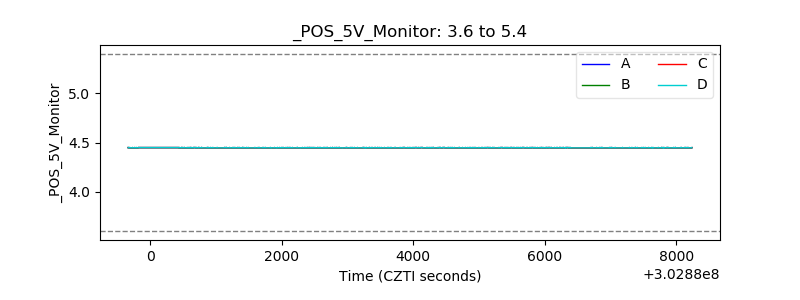 |
| _ROLL_ROT | 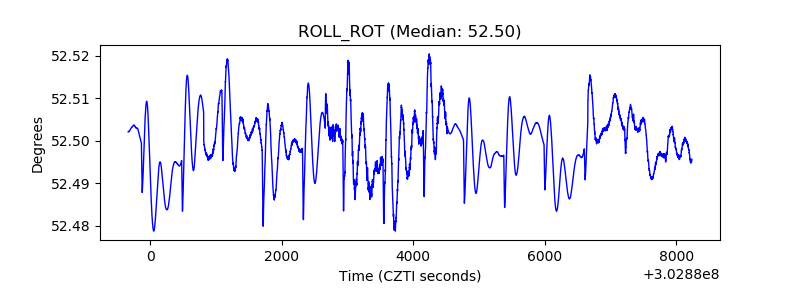 |
| _Roll_DEC | 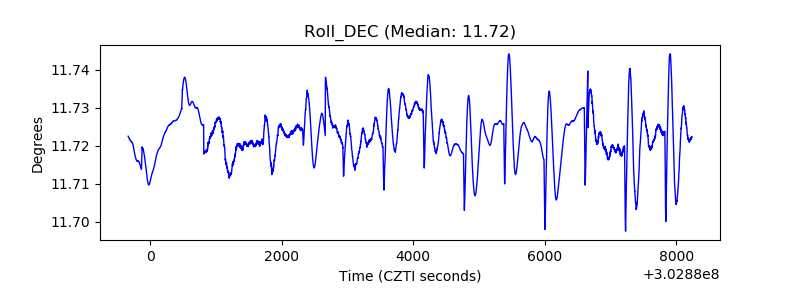 |
| _Roll_RA | 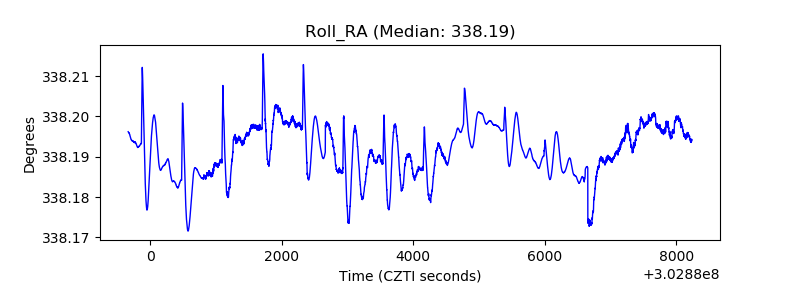 |
| Veto Counter | 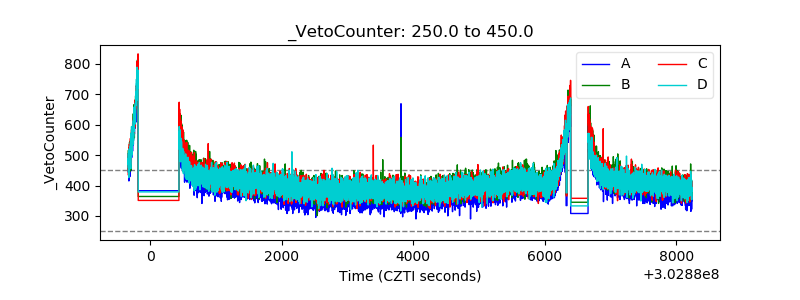 |