| Param | Original file | Final file |
|---|---|---|
| Filename | modeM0/AS1A05_160T01_9000003078_20863cztM0_level2.evt | modeM0/AS1A05_160T01_9000003078_20863cztM0_level2_quad_clean.evt |
| Size (bytes) | 298,347,840 | 36,414,720 |
| Size | 284.5 MB | 34.7 MB |
| Events in quadrant A | 1,621,272 | 227,100 |
| Events in quadrant B | 1,672,246 | 232,231 |
| Events in quadrant C | 1,660,703 | 213,777 |
| Events in quadrant D | 3,854,753 | 193,694 |
| Mode M9 | |||
|---|---|---|---|
| Quadrant | BADHDUFLAG | Total packets | Discarded packets |
| A | 1 | 140194730236808 | 46 |
| B | 1 | -1 | -1 |
| C | 1 | -1 | -1 |
| D | 1 | -1 | -1 |
| Mode M0 | |||
|---|---|---|---|
| Quadrant | BADHDUFLAG | Total packets | Discarded packets |
| A | 0 | 9108 | 2240 |
| B | 0 | 9173 | 2216 |
| C | 0 | 9043 | 2160 |
| D | 0 | 19086 | 5515 |
| Mode SS | |||
|---|---|---|---|
| Quadrant | BADHDUFLAG | Total packets | Discarded packets |
| A | 0 | 88 | 18 |
| B | 0 | 87 | 21 |
| C | 0 | 92 | 22 |
| D | 0 | 87 | 21 |
| Quadrant | Total seconds | Saturated seconds | Saturation percentage |
|---|---|---|---|
| A | 3345 | 9 | 0.269058% |
| B | 3356 | 11 | 0.327771% |
| C | 3351 | 22 | 0.656520% |
| D | 3181 | 211 | 6.633134% |
Noise dominated data is calculated using 1-second bins in cleaned event files. If a bin has >2000 counts, and if more than 50% of those come from <1% of pixels, then it is considered to be noise-dominated and hence unusable.
| Quadrant | # 1 sec bins | Bins with >0 counts | Bins with >2000 counts | High rate bins dominated by noise | Noise dominated (total time) | Noise dominated (detector-on time) | Marked lightcurve |
|---|---|---|---|---|---|---|---|
| A | 7778 | 3497 | 0 | 0 | 0.00% | 0.00% | 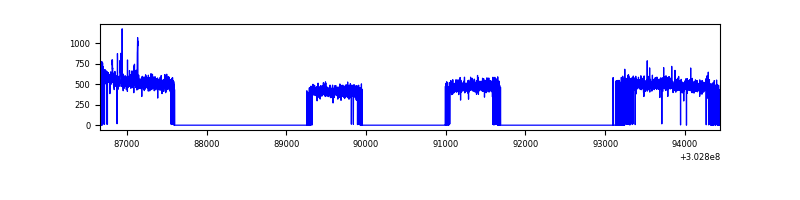 |
| B | 7779 | 3502 | 2 | 2 | 0.03% | 0.06% | 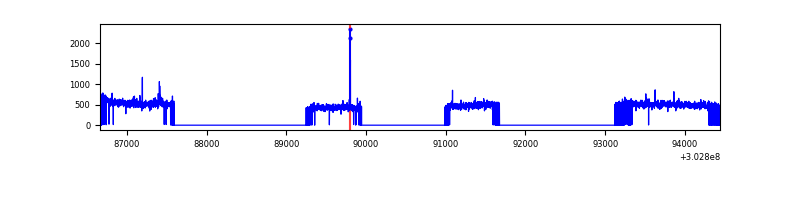 |
| C | 7777 | 3509 | 0 | 0 | 0.00% | 0.00% | 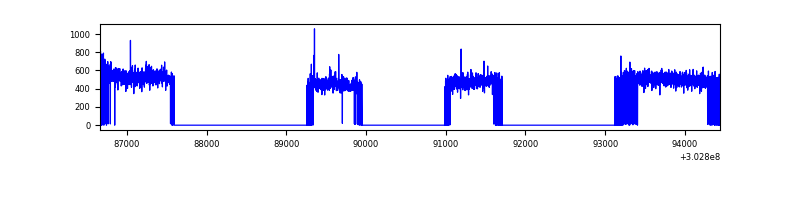 |
| D | 7758 | 3348 | 92 | 92 | 1.19% | 2.75% | 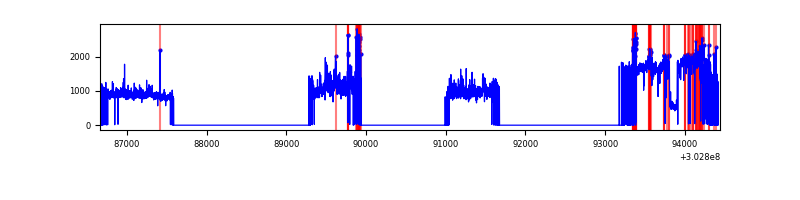 |
Top three noisy pixels from each quadrant. If the there are fewer than three noisy pixels in the level2.evt file, extra rows are filled as -1
| Pixel properties | Quadrant properties | ||||||
|---|---|---|---|---|---|---|---|
| Quadrant | DetID | PixID | Counts | Sigma | Mean | Median | Sigma |
| A | 15 | 174 | 12835 | 143.56 | 417 | 407 | 86.6 |
| A | 0 | 226 | 3623 | 37.15 | 417 | 407 | 86.6 |
| A | 3 | 137 | 3569 | 36.52 | 417 | 407 | 86.6 |
| B | 0 | 189 | 14643 | 175.11 | 418 | 407 | 81.3 |
| B | 0 | 190 | 14429 | 172.48 | 418 | 407 | 81.3 |
| B | 12 | 111 | 10001 | 118.01 | 418 | 407 | 81.3 |
| C | 14 | 238 | 62198 | 660.01 | 396 | 398 | 93.6 |
| C | 3 | 233 | 45878 | 485.71 | 396 | 398 | 93.6 |
| C | 9 | 54 | 2992 | 27.7 | 396 | 398 | 93.6 |
| D | 1 | 239 | 2182958 | 23502.79 | 378 | 366 | 92.9 |
| D | 5 | 222 | 85836 | 920.37 | 378 | 366 | 92.9 |
| D | 7 | 38 | 54036 | 577.93 | 378 | 366 | 92.9 |
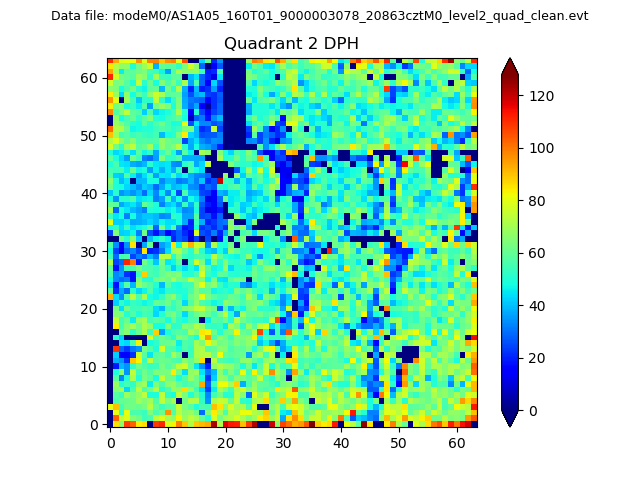
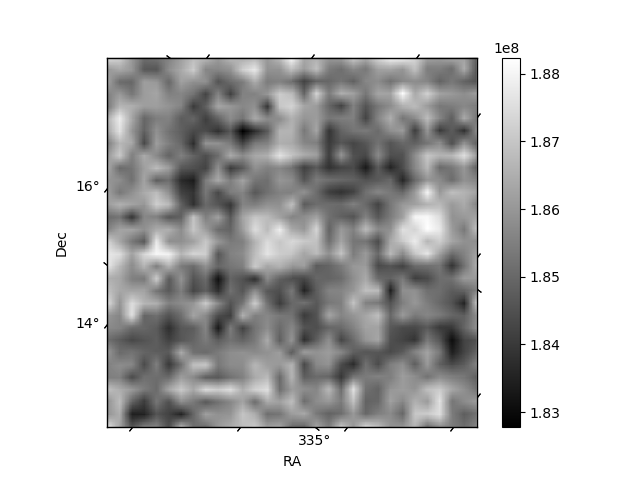
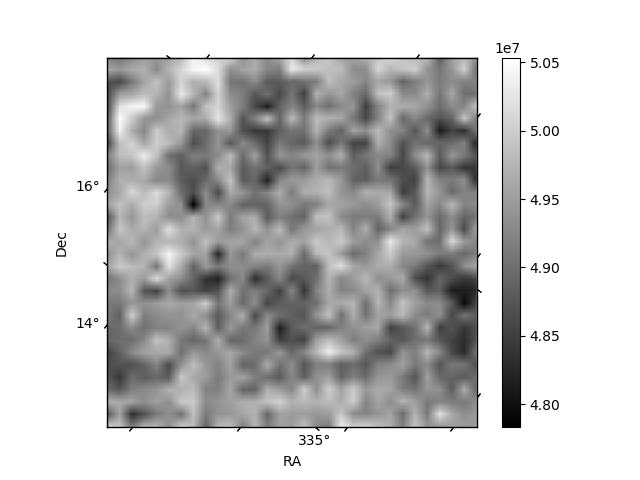
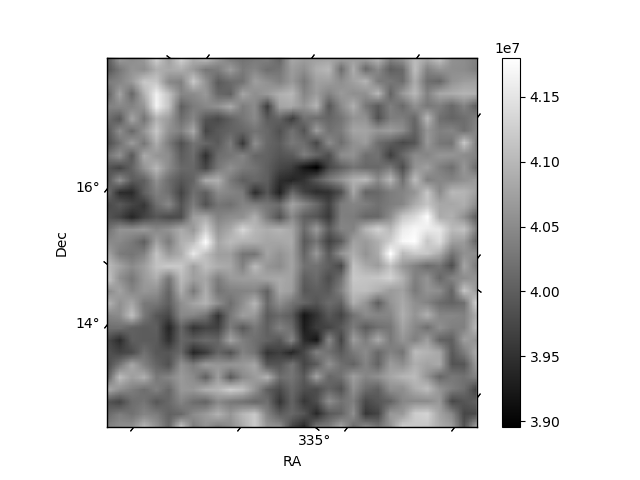
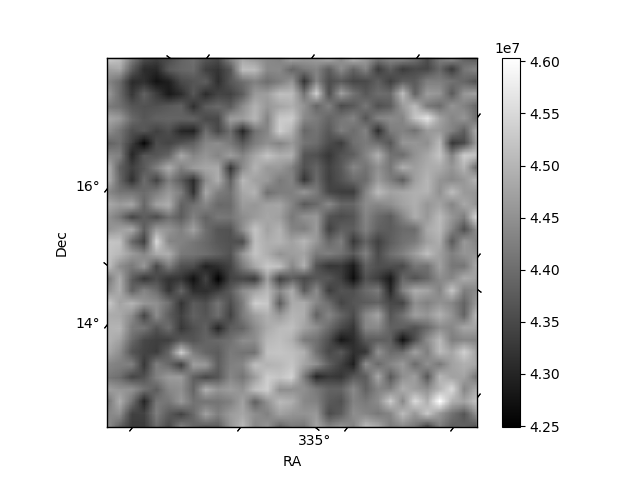
Histogram calculated using DETX and DETY for each event in the final _common_clean file
| Quadrant A | 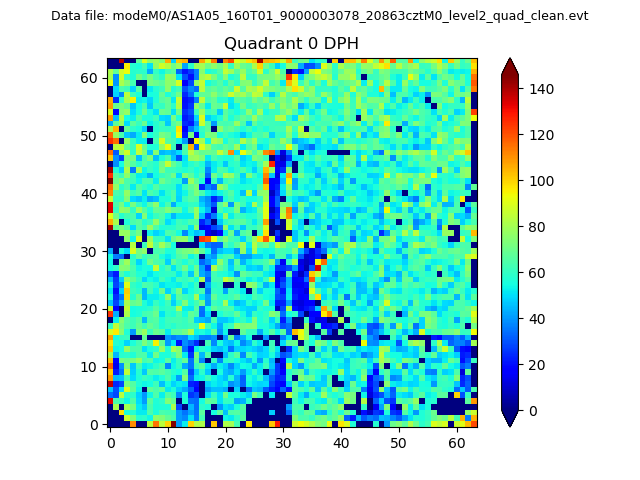 |
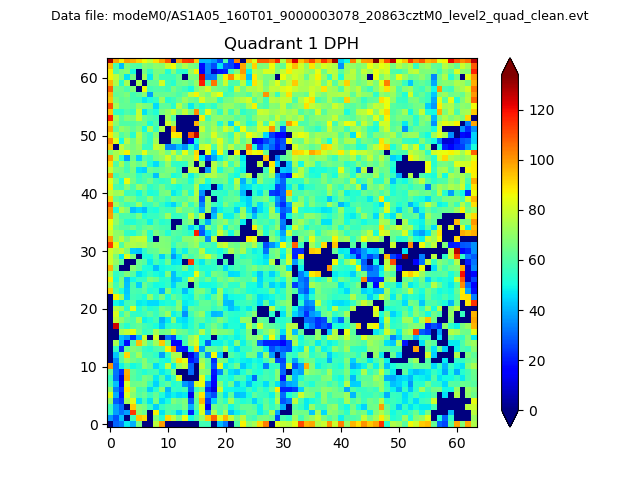 |
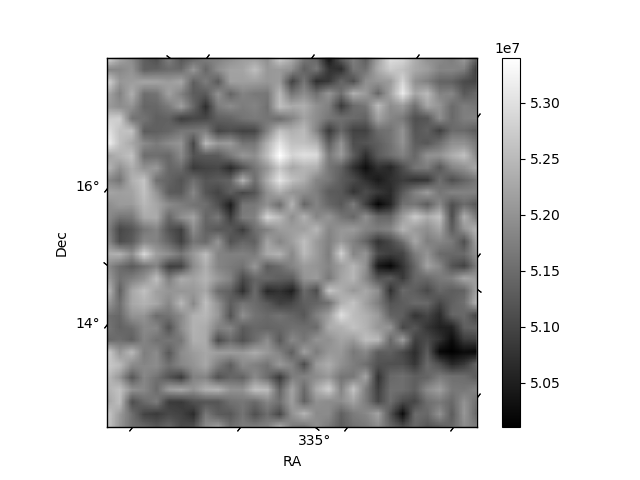
Quadrant B |
|---|---|---|---|
| Quadrant D | 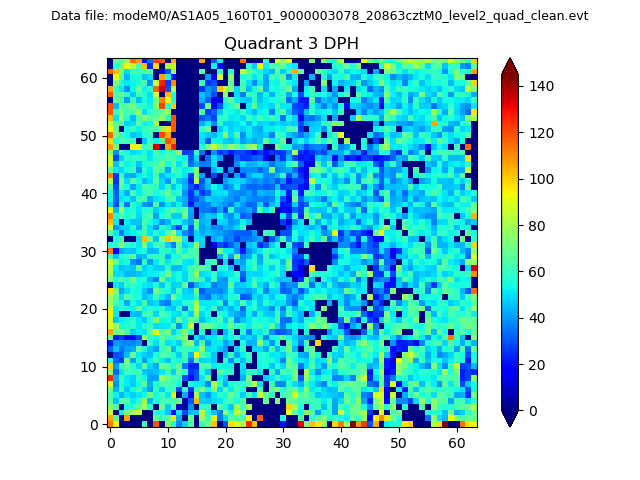 |
 |
Quadrant C |
| Plot type | Count rate plots | Images |
|---|---|---|
| Comparison with Poisson distribution Blue bars denote a histogram of data divided into 1 sec bins. Red curve is a Poisson curve with rate = median count rate of data. |
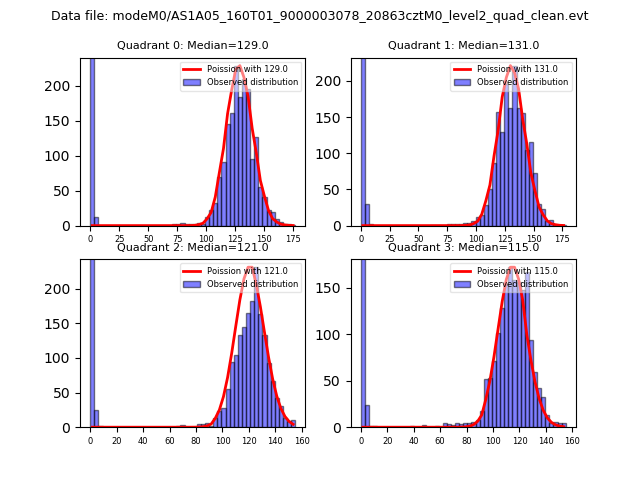 |
 |
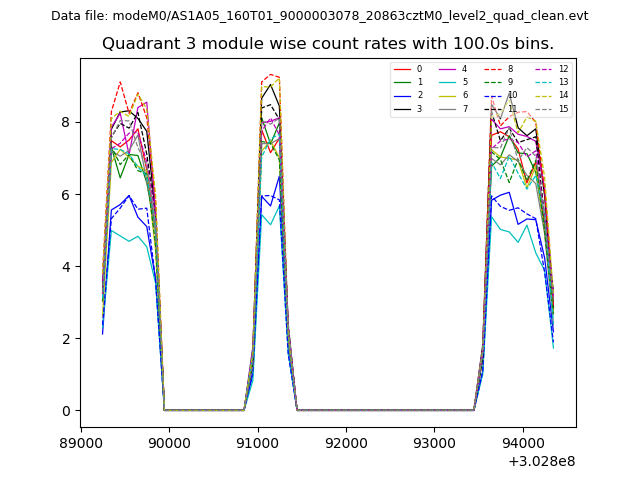
| Quadrant-wise count rates Data is divided into 100 sec bins |
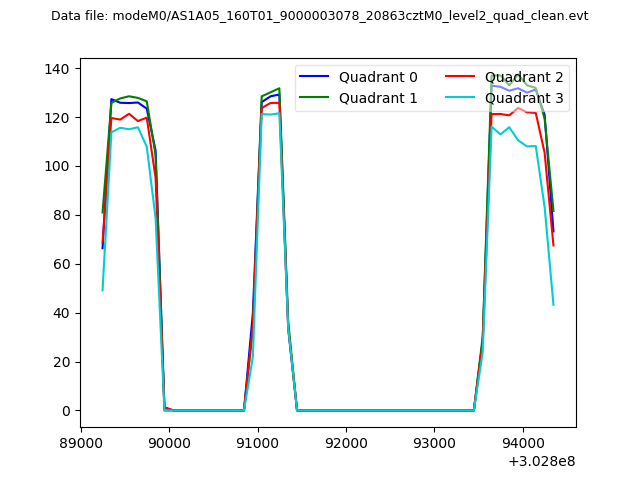 |
|
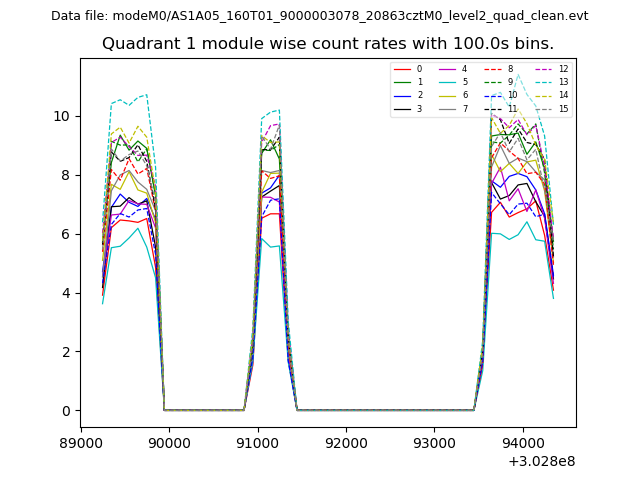
| Module-wise count rates for Quadrant A Data is divided into 100 sec bins |
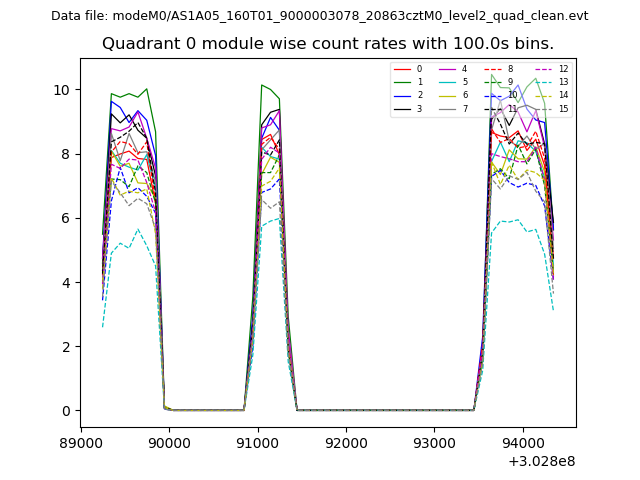 |
 |
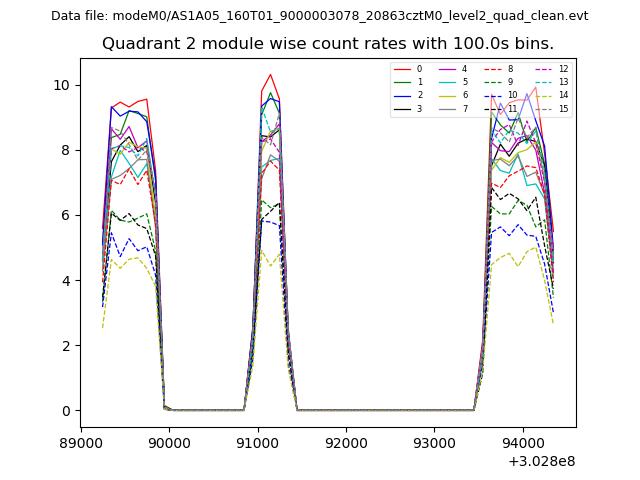
| Module-wise count rates for Quadrant B Data is divided into 100 sec bins |
 |
 |
| Module-wise count rates for Quadrant C Data is divided into 100 sec bins |
 |
 |
| Module-wise count rates for Quadrant D Data is divided into 100 sec bins |
 |
 |
| Parameter | Plot |
|---|---|
| CZT HV Monitor | 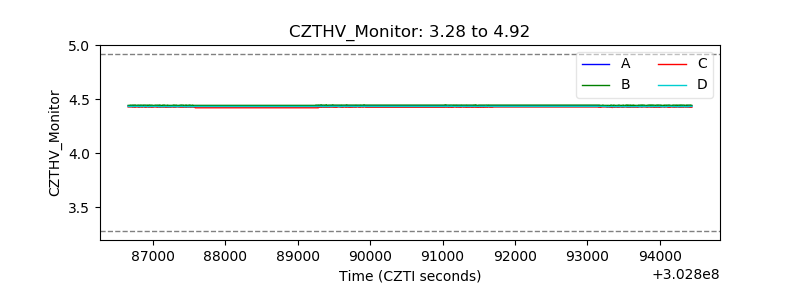 |
| D_VDD | 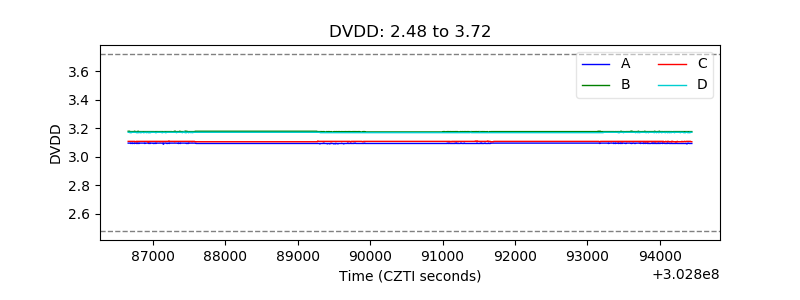 |
| Temperature 1 | 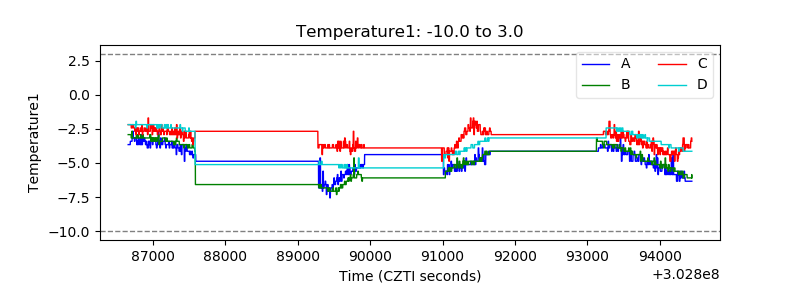 |
| Veto HV Monitor | 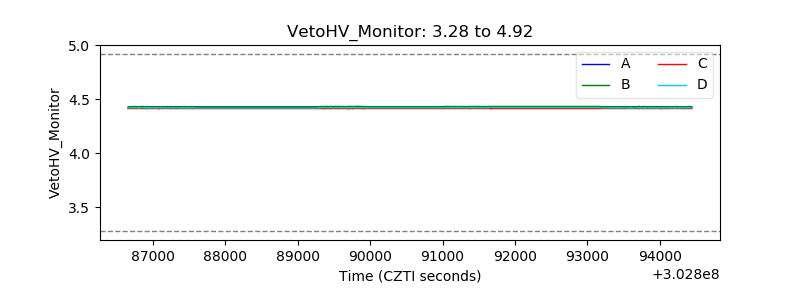 |
| Veto LLD |  |
| Alpha Counter | 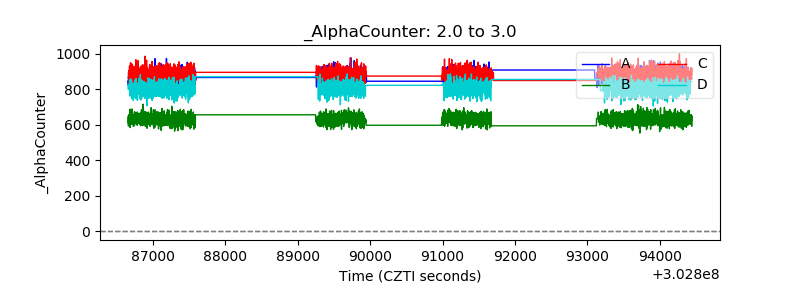 |
| _CPM_Rate | 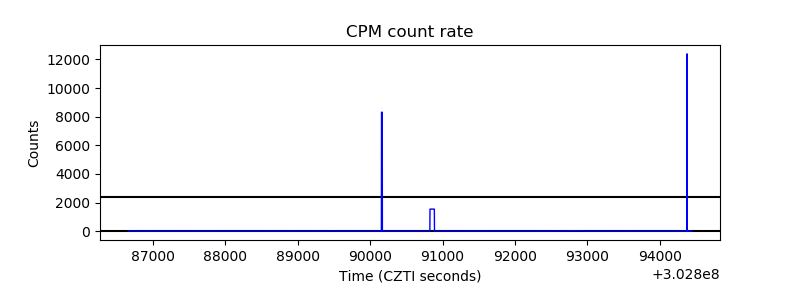 |
| CZT Counter | 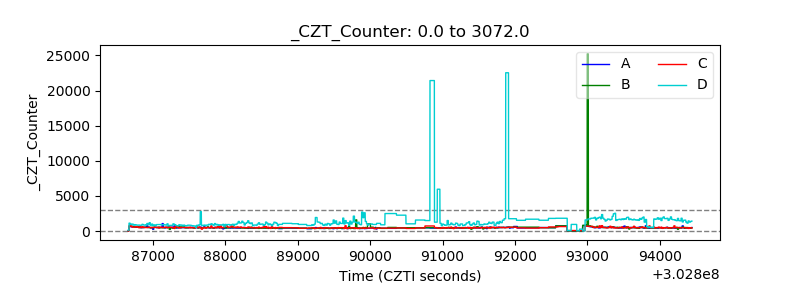 |
| +2.5 Volts monitor |  |
| +5 Volts monitor |  |
| _ROLL_ROT |  |
| _Roll_DEC | 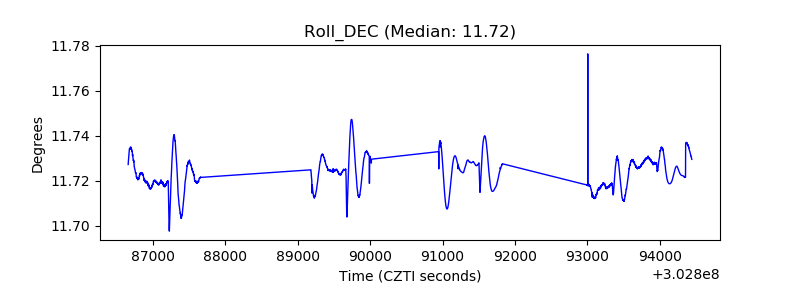 |
| _Roll_RA | 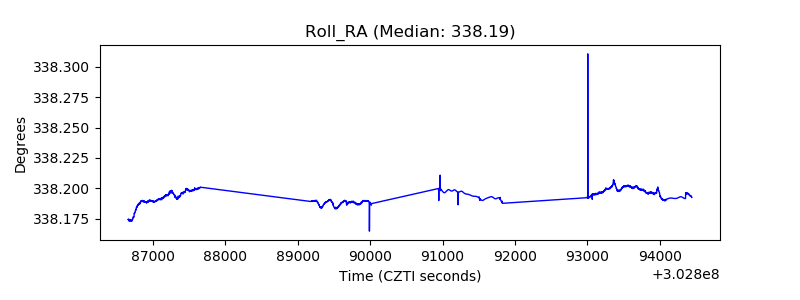 |
| Veto Counter |  |