| Param | Original file | Final file |
|---|---|---|
| Filename | modeM0/AS1A05_160T01_9000003078_20869cztM0_level2.evt | modeM0/AS1A05_160T01_9000003078_20869cztM0_level2_quad_clean.evt |
| Size (bytes) | 456,333,120 | 63,780,480 |
| Size | 435.2 MB | 60.8 MB |
| Events in quadrant A | 2,403,537 | 416,326 |
| Events in quadrant B | 2,527,723 | 432,800 |
| Events in quadrant C | 2,434,087 | 391,420 |
| Events in quadrant D | 6,120,605 | 345,187 |
| Mode M9 | |||
|---|---|---|---|
| Quadrant | BADHDUFLAG | Total packets | Discarded packets |
| A | 0 | 11 | 0 |
| B | 0 | 11 | 0 |
| C | 0 | 11 | 1 |
| D | 0 | 11 | 1 |
| Mode M0 | |||
|---|---|---|---|
| Quadrant | BADHDUFLAG | Total packets | Discarded packets |
| A | 0 | 11298 | 1131 |
| B | 0 | 11502 | 1020 |
| C | 0 | 11445 | 1165 |
| D | 0 | 24604 | 3021 |
| Mode SS | |||
|---|---|---|---|
| Quadrant | BADHDUFLAG | Total packets | Discarded packets |
| A | 0 | 111 | 13 |
| B | 0 | 112 | 12 |
| C | 0 | 111 | 10 |
| D | 0 | 110 | 8 |
| Quadrant | Total seconds | Saturated seconds | Saturation percentage |
|---|---|---|---|
| A | 4929 | 40 | 0.811524% |
| B | 4994 | 55 | 1.101322% |
| C | 4930 | 72 | 1.460446% |
| D | 4824 | 783 | 16.231343% |
Noise dominated data is calculated using 1-second bins in cleaned event files. If a bin has >2000 counts, and if more than 50% of those come from <1% of pixels, then it is considered to be noise-dominated and hence unusable.
| Quadrant | # 1 sec bins | Bins with >0 counts | Bins with >2000 counts | High rate bins dominated by noise | Noise dominated (total time) | Noise dominated (detector-on time) | Marked lightcurve |
|---|---|---|---|---|---|---|---|
| A | 7343 | 5064 | 0 | 0 | 0.00% | 0.00% | 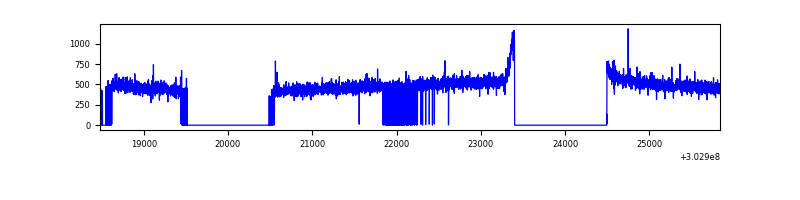 |
| B | 7358 | 5116 | 1 | 1 | 0.01% | 0.02% | 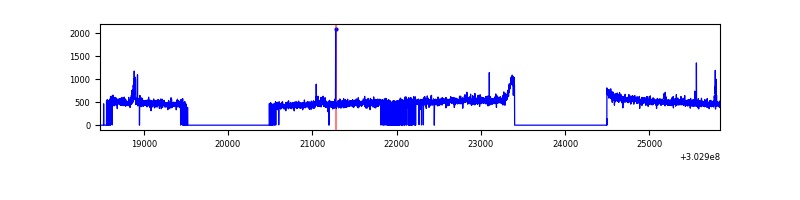 |
| C | 7327 | 5065 | 0 | 0 | 0.00% | 0.00% | 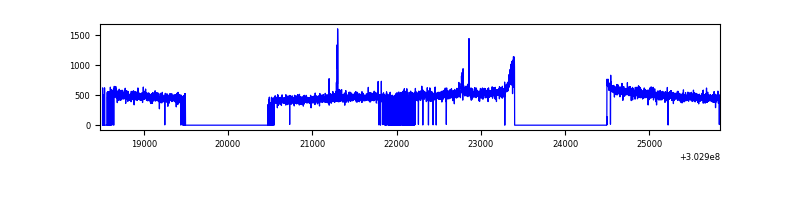 |
| D | 7252 | 4964 | 625 | 625 | 8.62% | 12.59% | 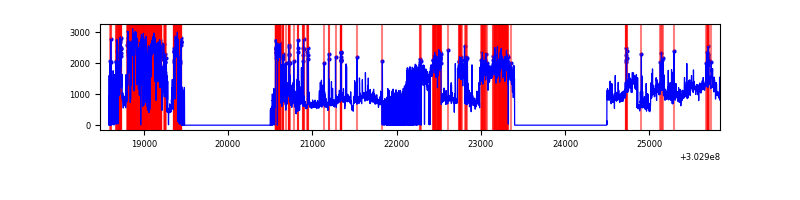 |
Top three noisy pixels from each quadrant. If the there are fewer than three noisy pixels in the level2.evt file, extra rows are filled as -1
| Pixel properties | Quadrant properties | ||||||
|---|---|---|---|---|---|---|---|
| Quadrant | DetID | PixID | Counts | Sigma | Mean | Median | Sigma |
| A | 3 | 137 | 5310 | 36.85 | 625 | 614 | 127.4 |
| A | 0 | 226 | 5233 | 36.25 | 625 | 614 | 127.4 |
| A | 12 | 194 | 4409 | 29.78 | 625 | 614 | 127.4 |
| B | 0 | 230 | 20812 | 166.82 | 633 | 618 | 121.0 |
| B | 12 | 111 | 14708 | 116.4 | 633 | 618 | 121.0 |
| B | 11 | 111 | 13073 | 102.89 | 633 | 618 | 121.0 |
| C | 14 | 238 | 93759 | 669.29 | 592 | 596 | 139.2 |
| C | 9 | 54 | 20214 | 140.94 | 592 | 596 | 139.2 |
| C | 3 | 233 | 6996 | 45.98 | 592 | 596 | 139.2 |
| D | 1 | 20 | 2023955 | 14794.3 | 561 | 544 | 136.8 |
| D | 1 | 52 | 1747227 | 12770.99 | 561 | 544 | 136.8 |
| D | 5 | 222 | 94731 | 688.65 | 561 | 544 | 136.8 |
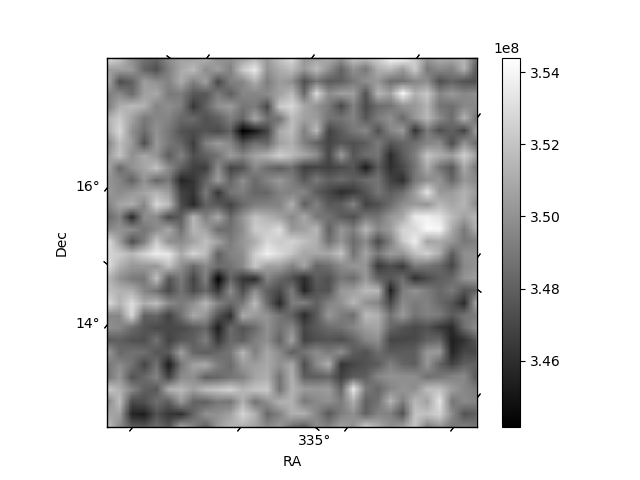
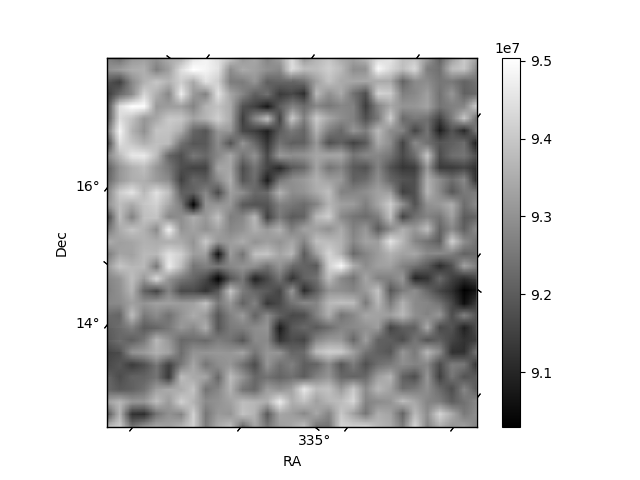
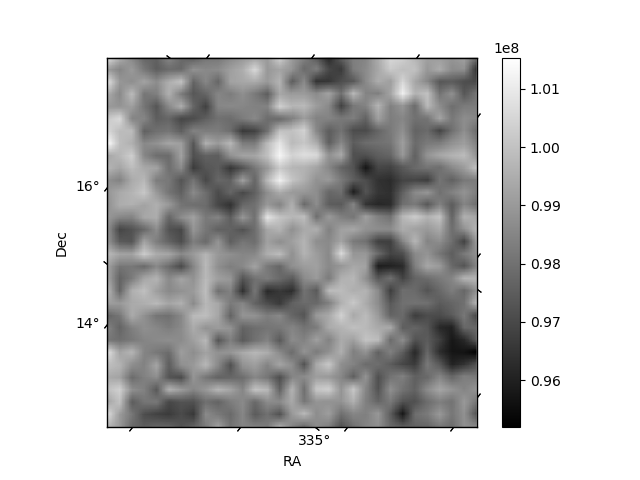
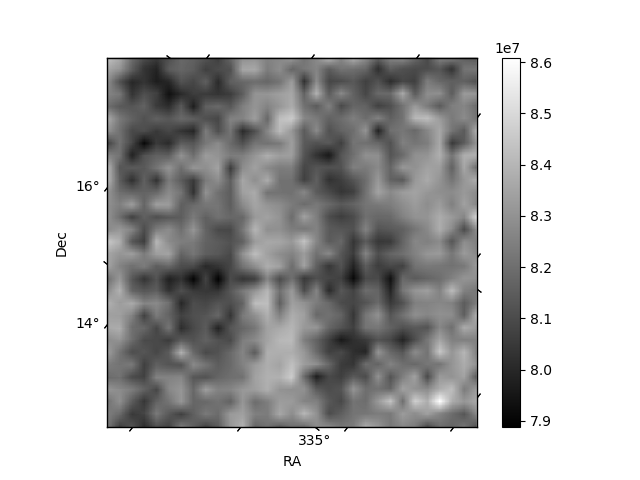
Histogram calculated using DETX and DETY for each event in the final _common_clean file
| Quadrant A | 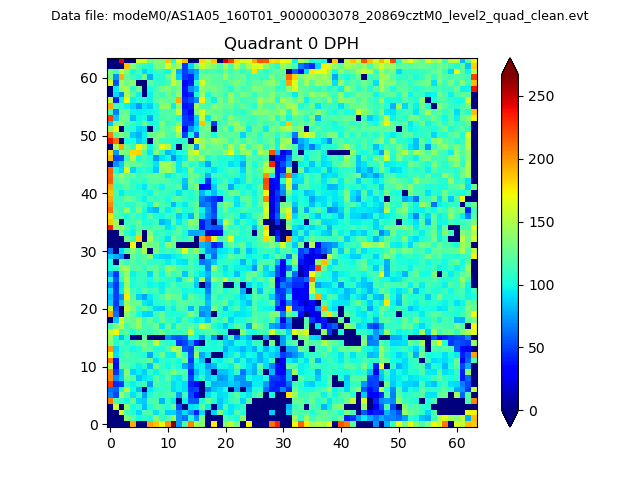 |
 |
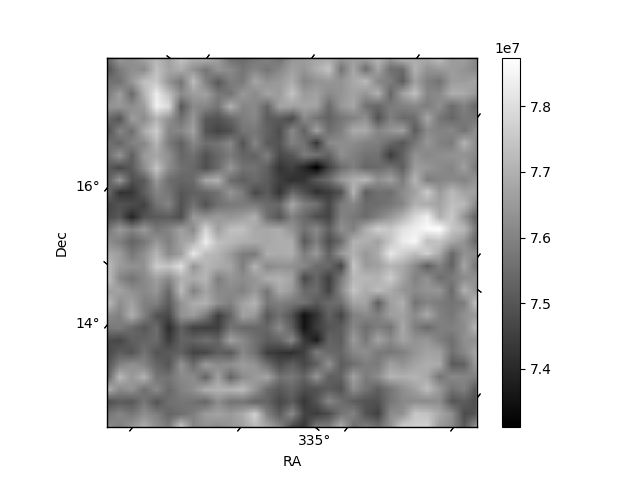
Quadrant B |
|---|---|---|---|
| Quadrant D | 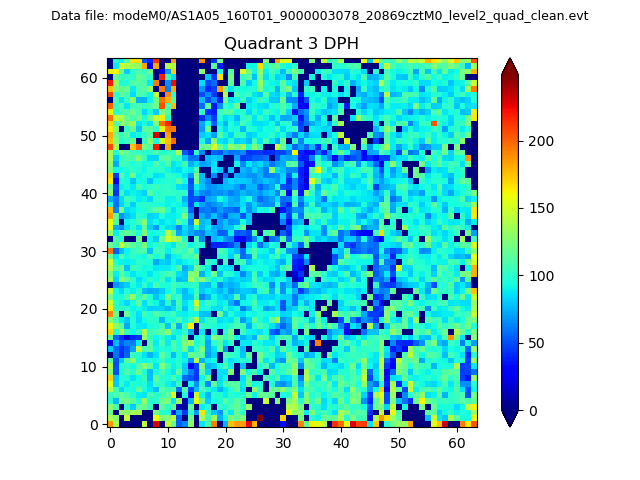 |
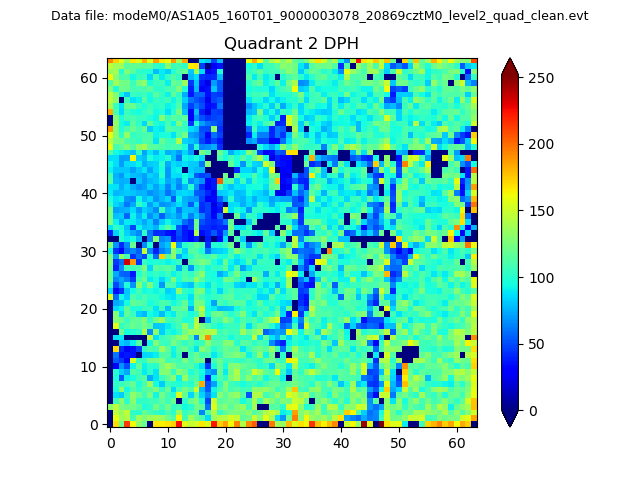 |
Quadrant C |
| Plot type | Count rate plots | Images |
|---|---|---|
| Comparison with Poisson distribution Blue bars denote a histogram of data divided into 1 sec bins. Red curve is a Poisson curve with rate = median count rate of data. |
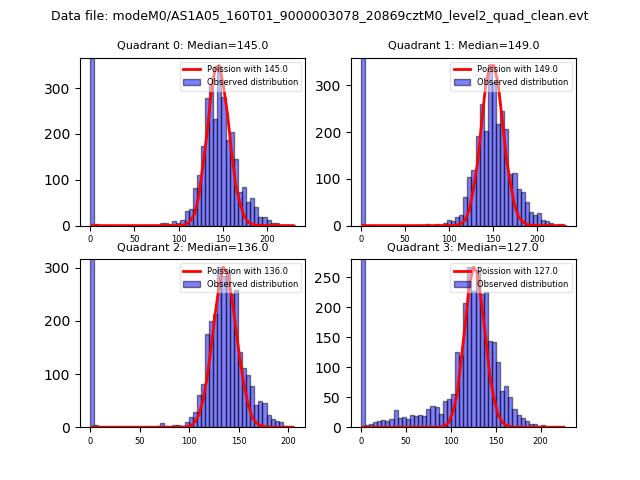 |
 |
| Quadrant-wise count rates Data is divided into 100 sec bins |
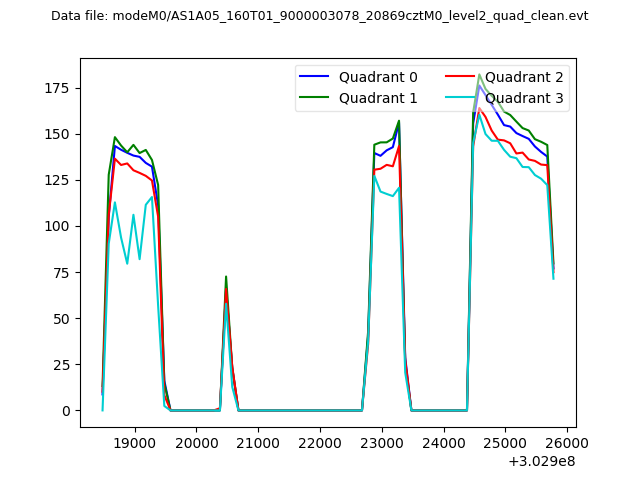 |
|
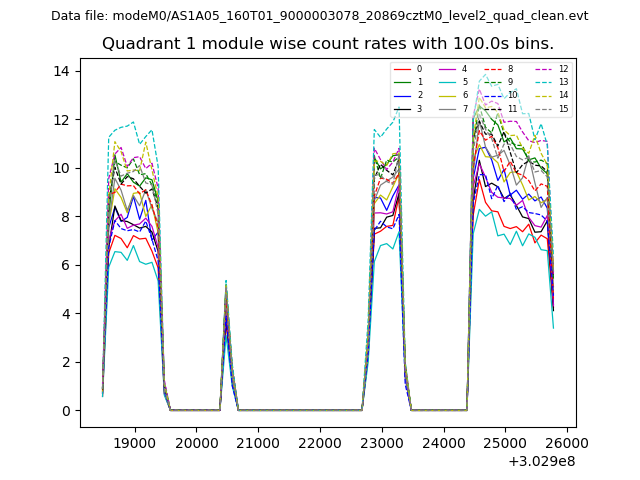
| Module-wise count rates for Quadrant A Data is divided into 100 sec bins |
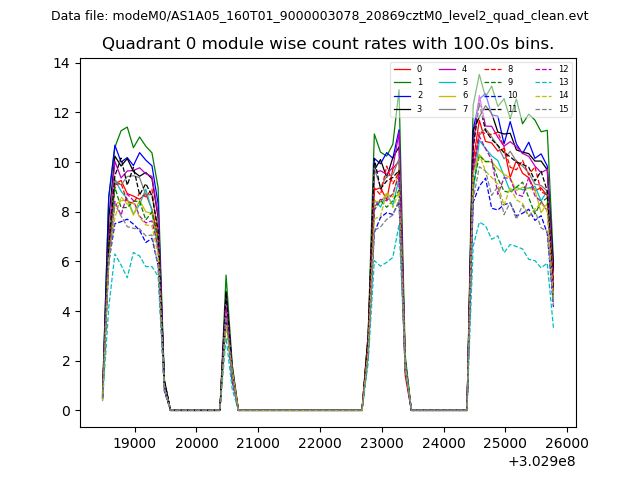 |
 |
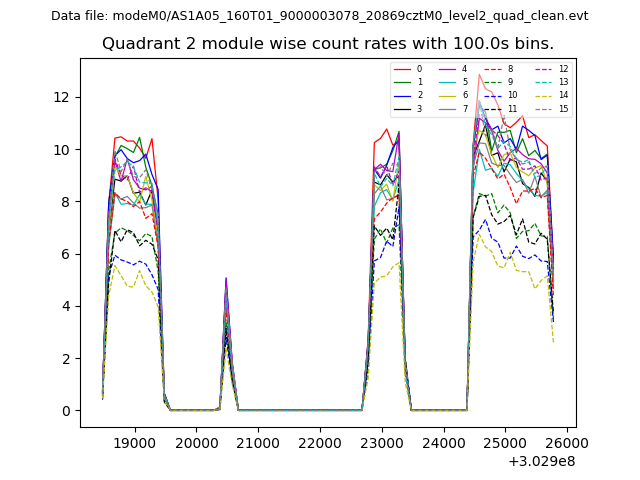
| Module-wise count rates for Quadrant B Data is divided into 100 sec bins |
 |
 |
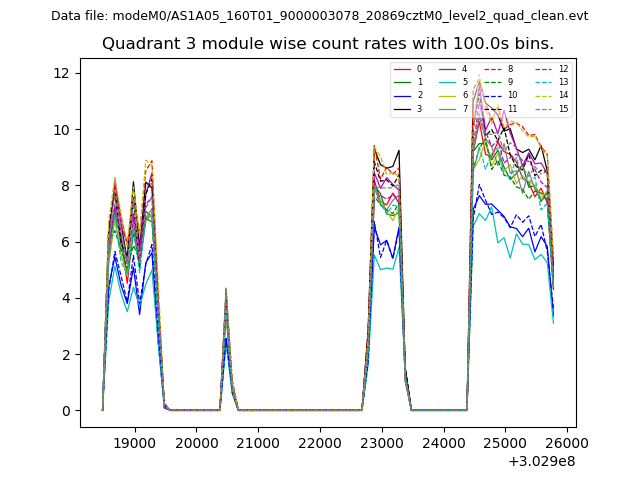
| Module-wise count rates for Quadrant C Data is divided into 100 sec bins |
 |
 |
| Module-wise count rates for Quadrant D Data is divided into 100 sec bins |
 |
 |
| Parameter | Plot |
|---|---|
| CZT HV Monitor | 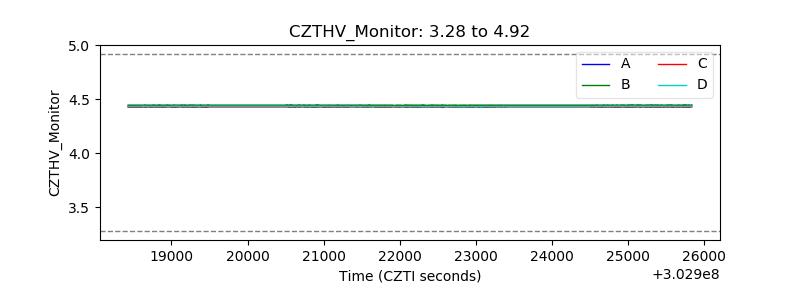 |
| D_VDD | 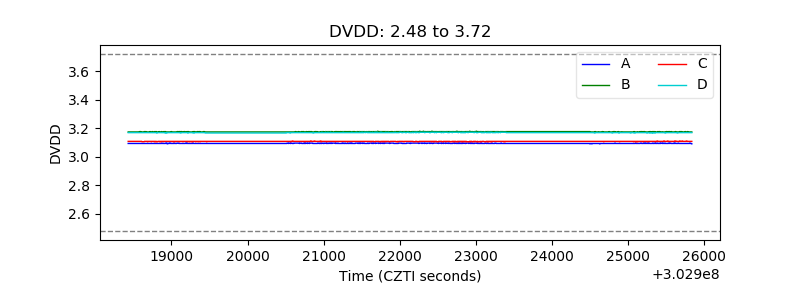 |
| Temperature 1 | 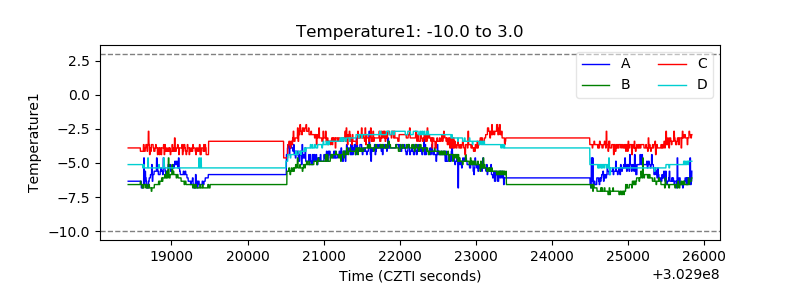 |
| Veto HV Monitor |  |
| Veto LLD | 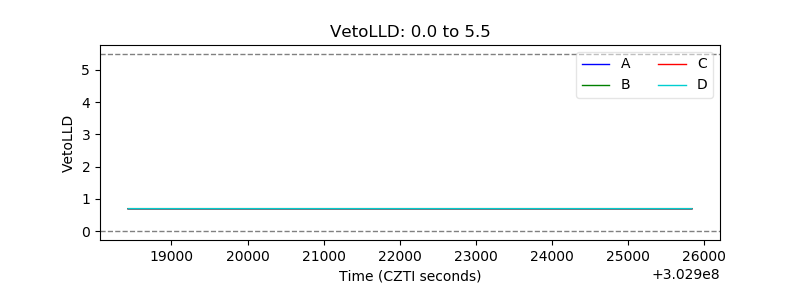 |
| Alpha Counter | 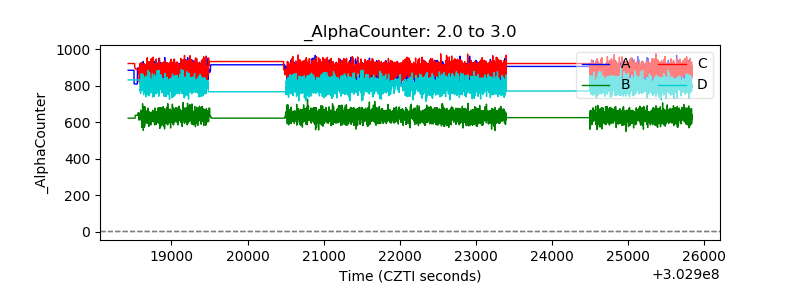 |
| _CPM_Rate | 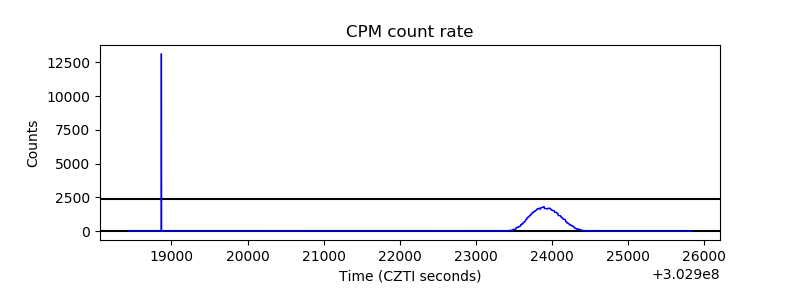 |
| CZT Counter | 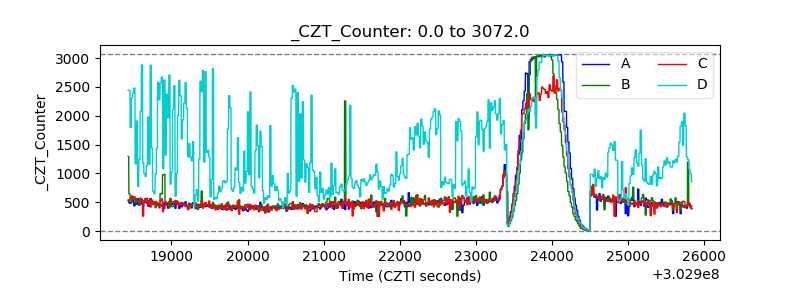 |
| +2.5 Volts monitor |  |
| +5 Volts monitor | 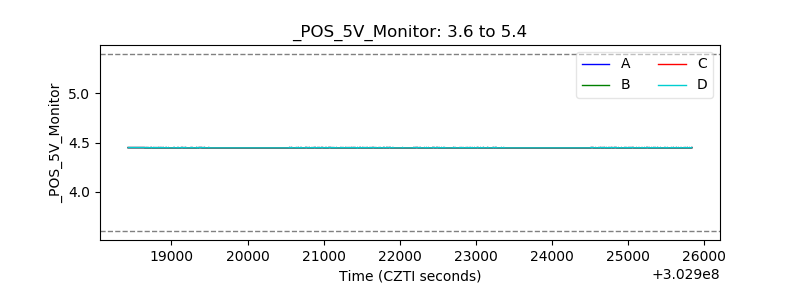 |
| _ROLL_ROT | 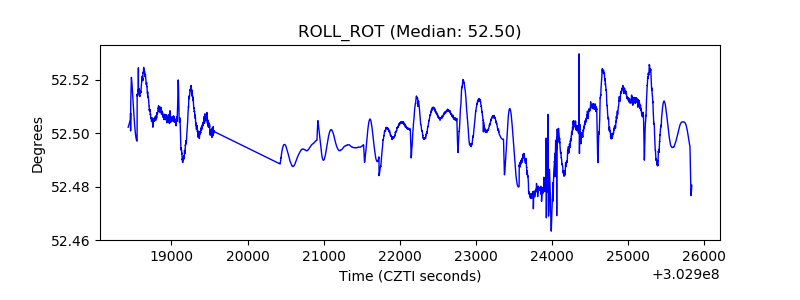 |
| _Roll_DEC | 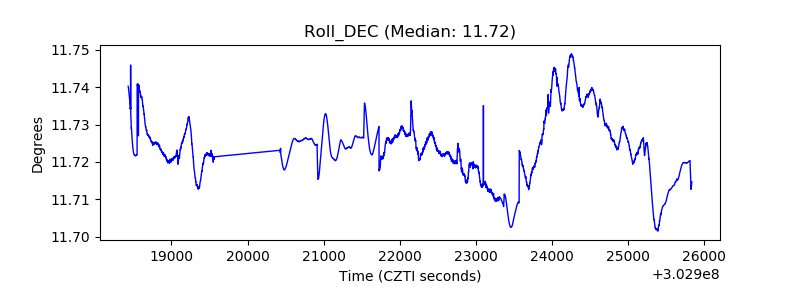 |
| _Roll_RA |  |
| Veto Counter | 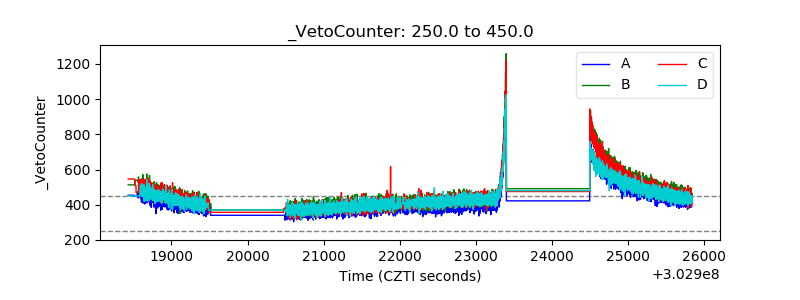 |