| Param | Original file | Final file |
|---|---|---|
| Filename | modeM0/AS1A05_160T01_9000003078_20870cztM0_level2.evt | modeM0/AS1A05_160T01_9000003078_20870cztM0_level2_quad_clean.evt |
| Size (bytes) | 3,872,450,880 | 480,234,240 |
| Size | 3.6 GB | 458.0 MB |
| Events in quadrant A | 18,077,379 | 3,186,156 |
| Events in quadrant B | 18,855,933 | 3,263,827 |
| Events in quadrant C | 18,575,323 | 3,021,948 |
| Events in quadrant D | 59,189,751 | 2,436,299 |
| Mode M9 | |||
|---|---|---|---|
| Quadrant | BADHDUFLAG | Total packets | Discarded packets |
| A | 0 | 54 | 0 |
| B | 0 | 54 | 0 |
| C | 0 | 54 | 0 |
| D | 0 | 54 | 0 |
| Mode M0 | |||
|---|---|---|---|
| Quadrant | BADHDUFLAG | Total packets | Discarded packets |
| A | 0 | 79613 | 852 |
| B | 0 | 81226 | 878 |
| C | 0 | 80545 | 853 |
| D | 0 | 204889 | 2567 |
| Mode SS | |||
|---|---|---|---|
| Quadrant | BADHDUFLAG | Total packets | Discarded packets |
| A | 0 | 792 | 12 |
| B | 0 | 792 | 6 |
| C | 0 | 792 | 4 |
| D | 0 | 792 | 4 |
| Quadrant | Total seconds | Saturated seconds | Saturation percentage |
|---|---|---|---|
| A | 38381 | 265 | 0.690446% |
| B | 38375 | 372 | 0.969381% |
| C | 38382 | 562 | 1.464228% |
| D | 38220 | 12925 | 33.817373% |
Noise dominated data is calculated using 1-second bins in cleaned event files. If a bin has >2000 counts, and if more than 50% of those come from <1% of pixels, then it is considered to be noise-dominated and hence unusable.
| Quadrant | # 1 sec bins | Bins with >0 counts | Bins with >2000 counts | High rate bins dominated by noise | Noise dominated (total time) | Noise dominated (detector-on time) | Marked lightcurve |
|---|---|---|---|---|---|---|---|
| A | 44236 | 38544 | 0 | 0 | 0.00% | 0.00% | 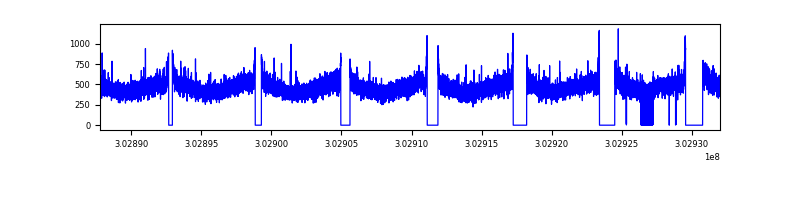 |
| B | 44237 | 38539 | 15 | 15 | 0.03% | 0.04% | 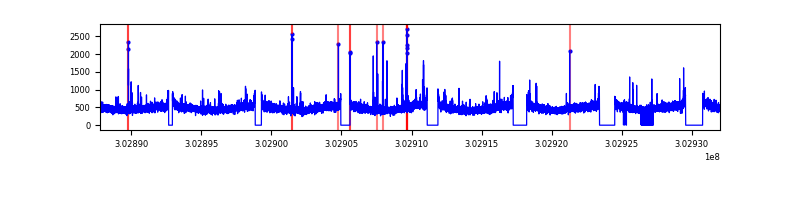 |
| C | 44237 | 38575 | 56 | 56 | 0.13% | 0.15% | 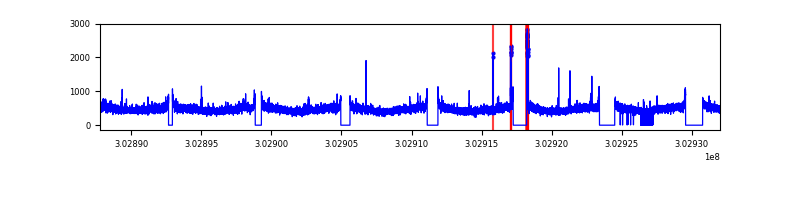 |
| D | 44237 | 38371 | 12267 | 12267 | 27.73% | 31.97% | 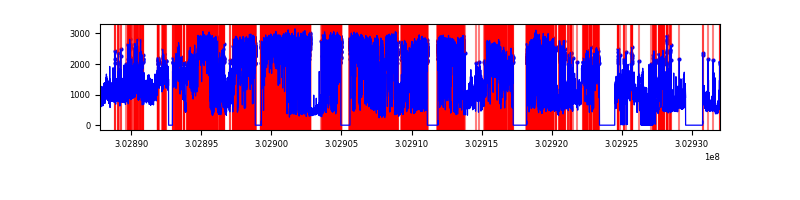 |
Top three noisy pixels from each quadrant. If the there are fewer than three noisy pixels in the level2.evt file, extra rows are filled as -1
| Pixel properties | Quadrant properties | ||||||
|---|---|---|---|---|---|---|---|
| Quadrant | DetID | PixID | Counts | Sigma | Mean | Median | Sigma |
| A | 0 | 226 | 40001 | 37.66 | 4699 | 4603 | 939.9 |
| A | 3 | 137 | 39536 | 37.17 | 4699 | 4603 | 939.9 |
| A | 12 | 194 | 32671 | 29.86 | 4699 | 4603 | 939.9 |
| B | 0 | 189 | 205487 | 227.21 | 4687 | 4582 | 884.2 |
| B | 12 | 111 | 110941 | 120.29 | 4687 | 4582 | 884.2 |
| B | 11 | 111 | 97845 | 105.47 | 4687 | 4582 | 884.2 |
| C | 14 | 238 | 700956 | 673.25 | 4459 | 4496 | 1034.5 |
| C | 3 | 233 | 227426 | 215.5 | 4459 | 4496 | 1034.5 |
| C | 0 | 10 | 171095 | 161.05 | 4459 | 4496 | 1034.5 |
| D | 1 | 52 | 32599176 | 35166.37 | 3866 | 3761 | 926.9 |
| D | 1 | 239 | 6564765 | 7078.5 | 3866 | 3761 | 926.9 |
| D | 1 | 20 | 4004238 | 4316.01 | 3866 | 3761 | 926.9 |
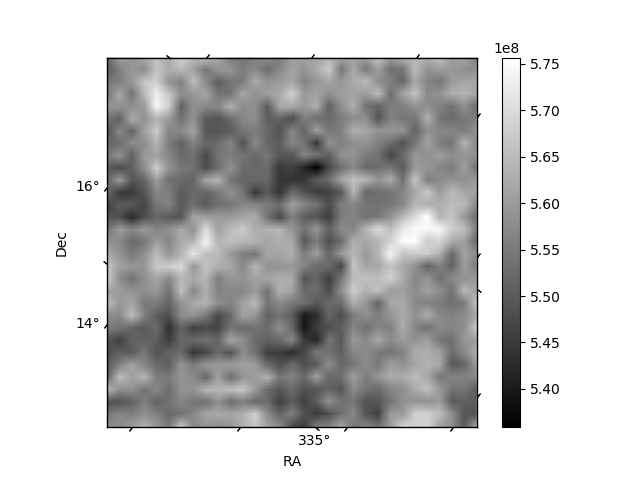
Histogram calculated using DETX and DETY for each event in the final _common_clean file
| Quadrant A | 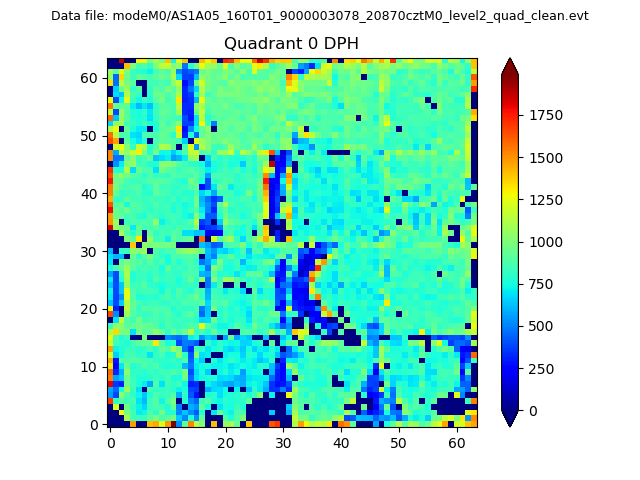 |
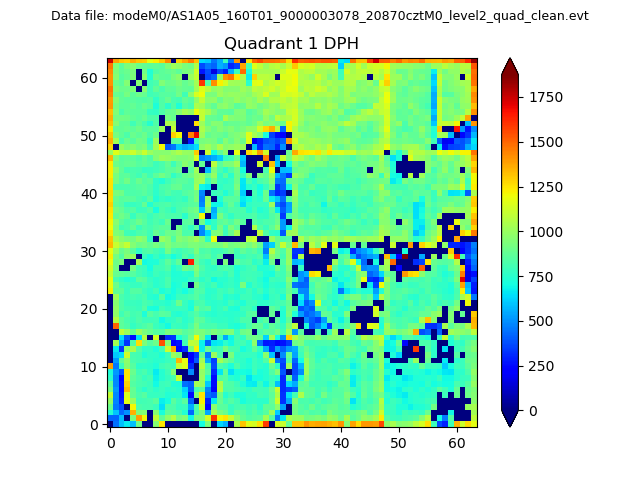 |
Quadrant B |
|---|---|---|---|
| Quadrant D | 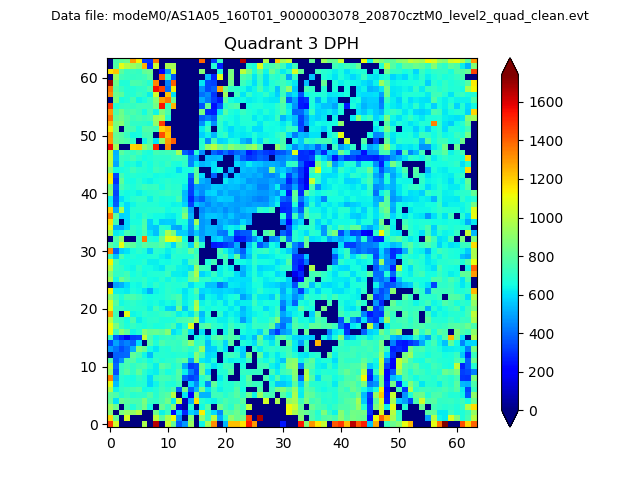 |
 |
Quadrant C |
| Plot type | Count rate plots | Images |
|---|---|---|
| Comparison with Poisson distribution Blue bars denote a histogram of data divided into 1 sec bins. Red curve is a Poisson curve with rate = median count rate of data. |
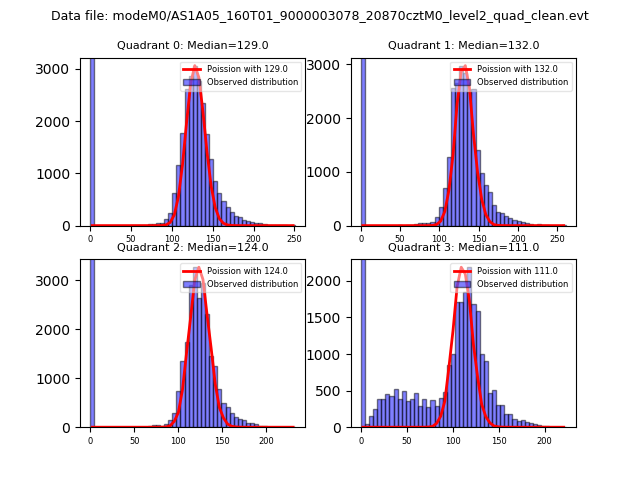 |
 |
| Quadrant-wise count rates Data is divided into 100 sec bins |
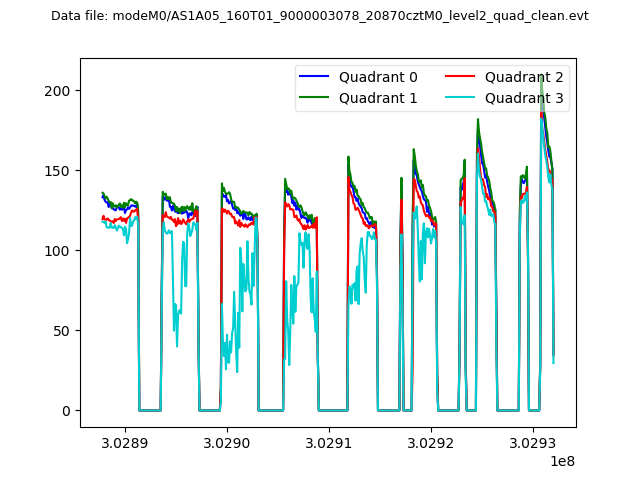 |
|
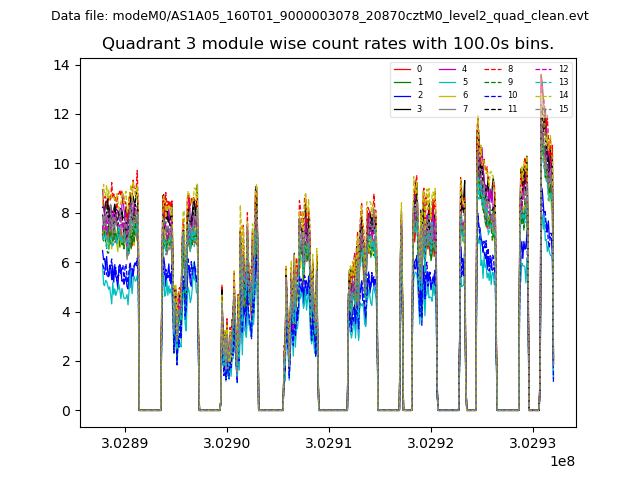
| Module-wise count rates for Quadrant A Data is divided into 100 sec bins |
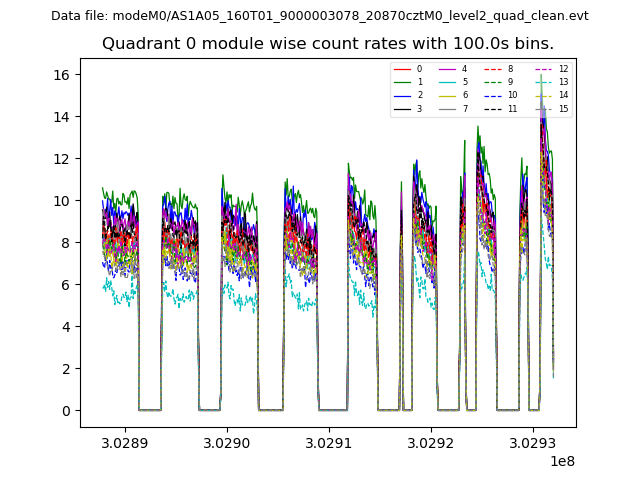 |
 |
| Module-wise count rates for Quadrant B Data is divided into 100 sec bins |
 |
 |
| Module-wise count rates for Quadrant C Data is divided into 100 sec bins |
 |
 |
| Module-wise count rates for Quadrant D Data is divided into 100 sec bins |
 |
 |
| Parameter | Plot |
|---|---|
| CZT HV Monitor | 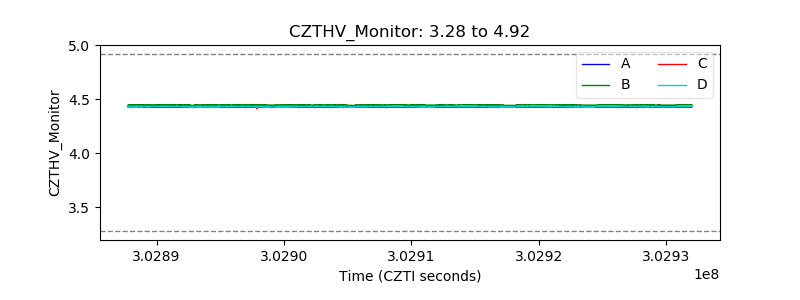 |
| D_VDD | 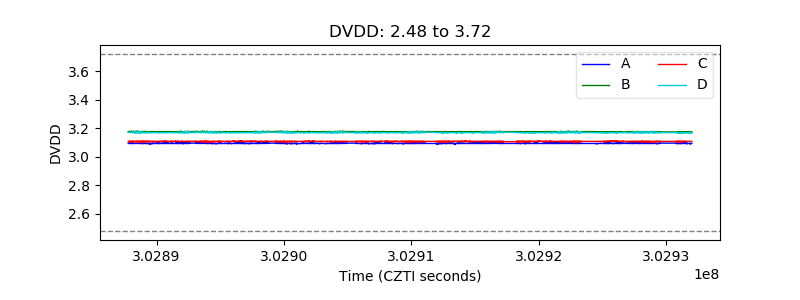 |
| Temperature 1 | 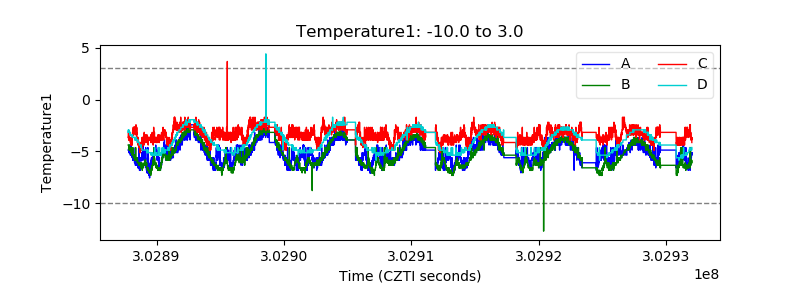 |
| Veto HV Monitor | 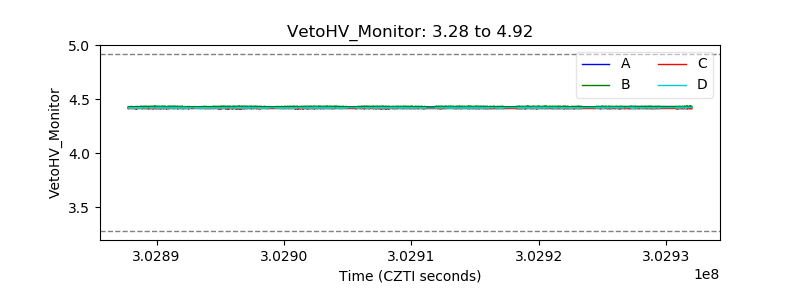 |
| Veto LLD | 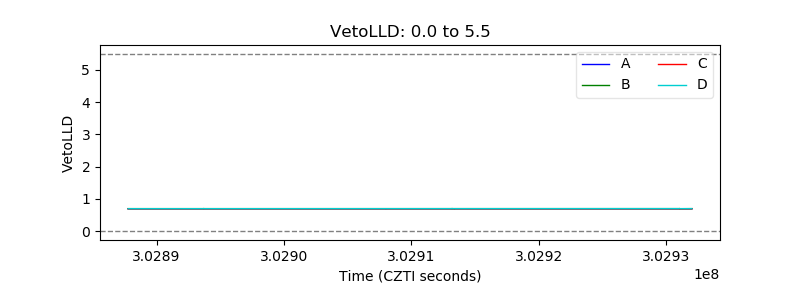 |
| Alpha Counter |  |
| _CPM_Rate | 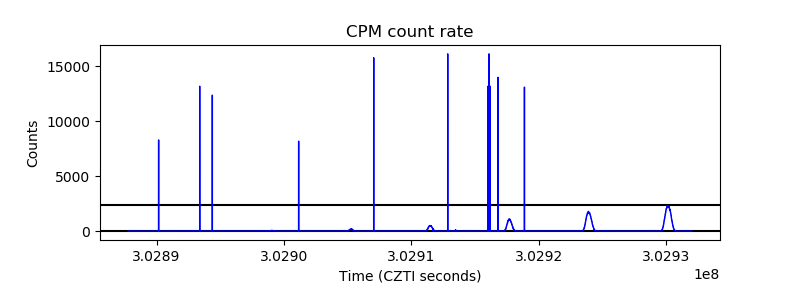 |
| CZT Counter | 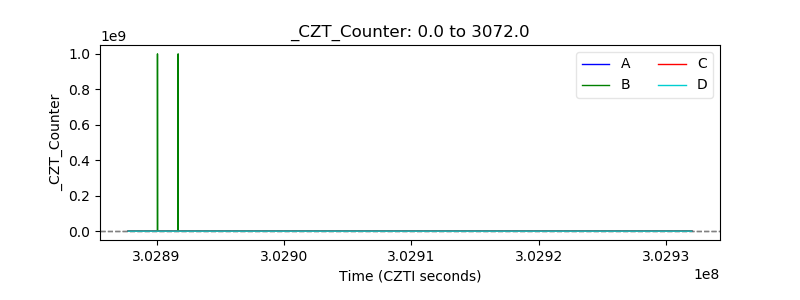 |
| +2.5 Volts monitor |  |
| +5 Volts monitor |  |
| _ROLL_ROT | 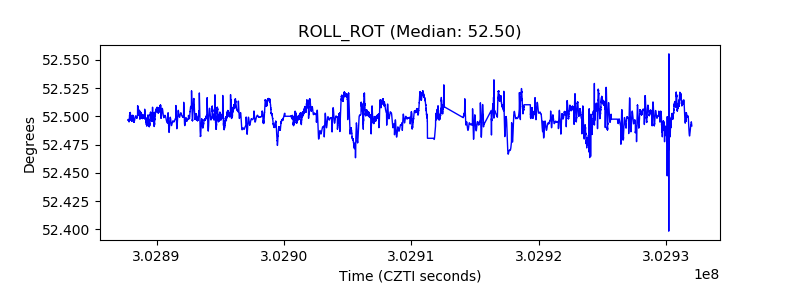 |
| _Roll_DEC | 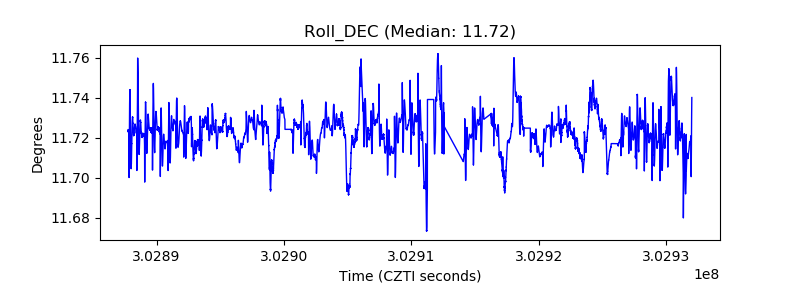 |
| _Roll_RA | 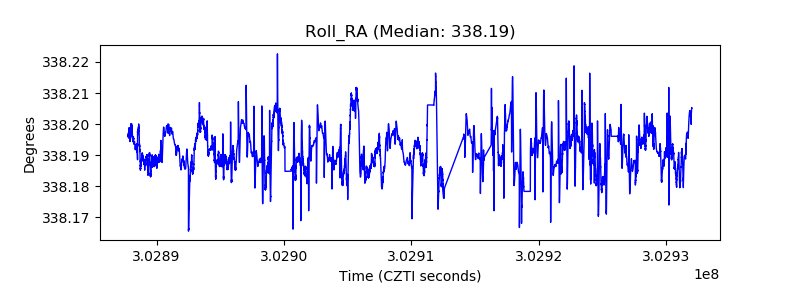 |
| Veto Counter | 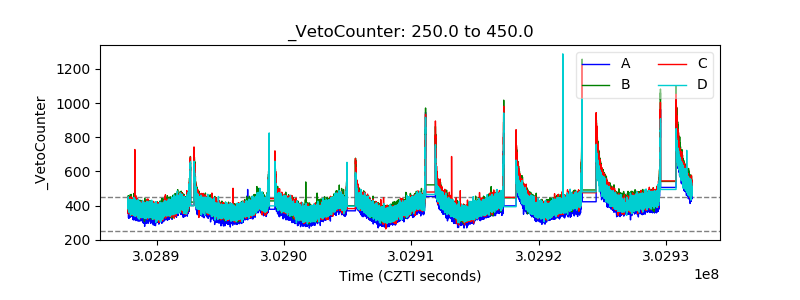 |