| Param | Original file | Final file |
|---|---|---|
| Filename | modeM0/AS1A05_160T01_9000003078_20871cztM0_level2.evt | modeM0/AS1A05_160T01_9000003078_20871cztM0_level2_quad_clean.evt |
| Size (bytes) | 592,044,480 | 95,497,920 |
| Size | 564.6 MB | 91.1 MB |
| Events in quadrant A | 3,416,767 | 637,747 |
| Events in quadrant B | 3,491,348 | 652,866 |
| Events in quadrant C | 3,353,622 | 595,008 |
| Events in quadrant D | 7,231,949 | 556,464 |
| Mode M9 | |||
|---|---|---|---|
| Quadrant | BADHDUFLAG | Total packets | Discarded packets |
| A | 0 | 13 | 0 |
| B | 0 | 13 | 0 |
| C | 0 | 14 | 0 |
| D | 0 | 14 | 0 |
| Mode M0 | |||
|---|---|---|---|
| Quadrant | BADHDUFLAG | Total packets | Discarded packets |
| A | 0 | 13862 | 2 |
| B | 0 | 14141 | 2 |
| C | 0 | 13717 | 2 |
| D | 0 | 25972 | 2 |
| Mode SS | |||
|---|---|---|---|
| Quadrant | BADHDUFLAG | Total packets | Discarded packets |
| A | 0 | 132 | 0 |
| B | 0 | 132 | 0 |
| C | 0 | 132 | 0 |
| D | 0 | 132 | 0 |
| Quadrant | Total seconds | Saturated seconds | Saturation percentage |
|---|---|---|---|
| A | 6445 | 59 | 0.915438% |
| B | 6444 | 79 | 1.225947% |
| C | 6444 | 87 | 1.350093% |
| D | 6444 | 874 | 13.563004% |
Noise dominated data is calculated using 1-second bins in cleaned event files. If a bin has >2000 counts, and if more than 50% of those come from <1% of pixels, then it is considered to be noise-dominated and hence unusable.
| Quadrant | # 1 sec bins | Bins with >0 counts | Bins with >2000 counts | High rate bins dominated by noise | Noise dominated (total time) | Noise dominated (detector-on time) | Marked lightcurve |
|---|---|---|---|---|---|---|---|
| A | 7730 | 6446 | 0 | 0 | 0.00% | 0.00% | 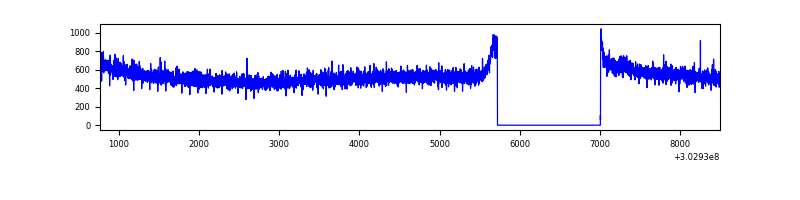 |
| B | 7729 | 6445 | 1 | 1 | 0.01% | 0.02% | 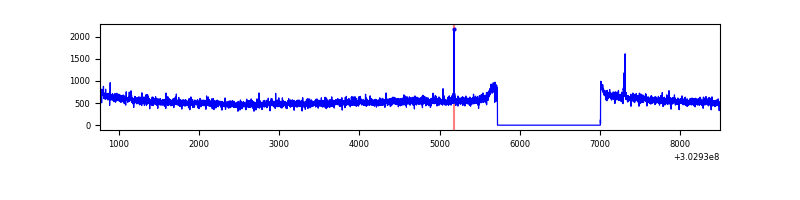 |
| C | 7729 | 6445 | 0 | 0 | 0.00% | 0.00% | 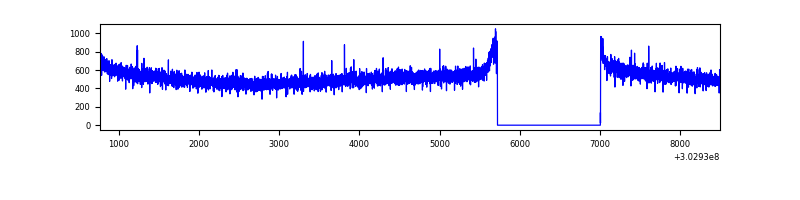 |
| D | 7729 | 6445 | 837 | 837 | 10.83% | 12.99% |  |
Top three noisy pixels from each quadrant. If the there are fewer than three noisy pixels in the level2.evt file, extra rows are filled as -1
| Pixel properties | Quadrant properties | ||||||
|---|---|---|---|---|---|---|---|
| Quadrant | DetID | PixID | Counts | Sigma | Mean | Median | Sigma |
| A | 0 | 226 | 7665 | 38.73 | 888 | 874 | 175.4 |
| A | 3 | 137 | 6827 | 33.95 | 888 | 874 | 175.4 |
| A | 12 | 194 | 6132 | 29.99 | 888 | 874 | 175.4 |
| B | 0 | 219 | 25137 | 148.0 | 877 | 858 | 164.0 |
| B | 12 | 111 | 19564 | 114.03 | 877 | 858 | 164.0 |
| B | 11 | 111 | 17374 | 100.68 | 877 | 858 | 164.0 |
| C | 14 | 238 | 131992 | 686.11 | 825 | 834 | 191.2 |
| C | 13 | 61 | 5822 | 26.09 | 825 | 834 | 191.2 |
| C | 7 | 247 | 2875 | 10.68 | 825 | 834 | 191.2 |
| D | 1 | 20 | 2029151 | 10280.52 | 823 | 802 | 197.3 |
| D | 9 | 1 | 1759821 | 8915.44 | 823 | 802 | 197.3 |
| D | 5 | 222 | 153572 | 774.3 | 823 | 802 | 197.3 |
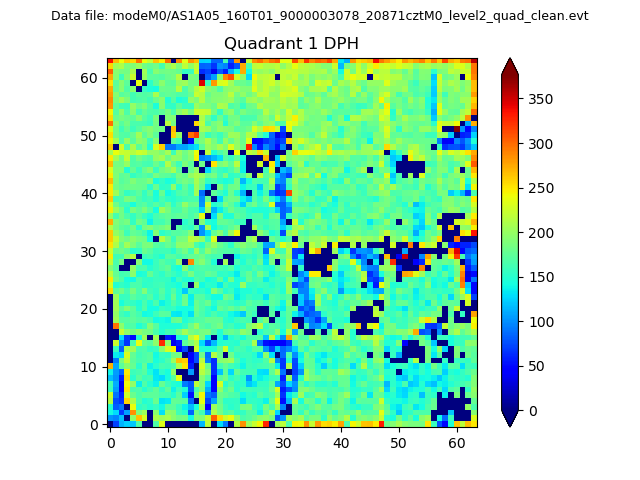
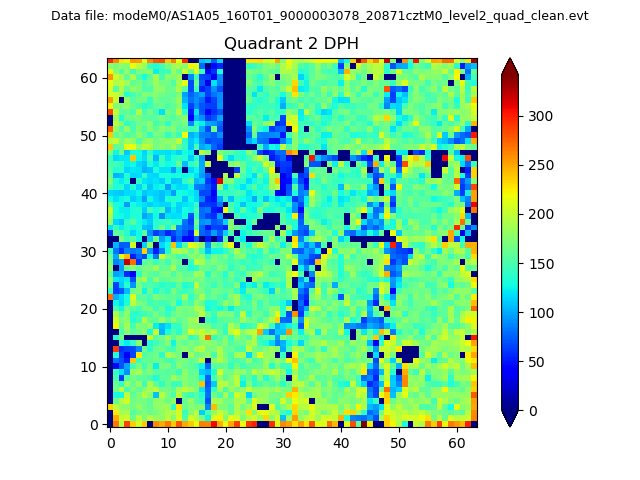
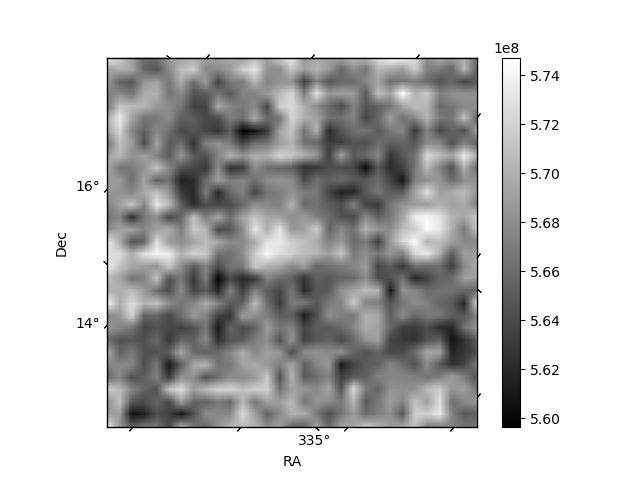
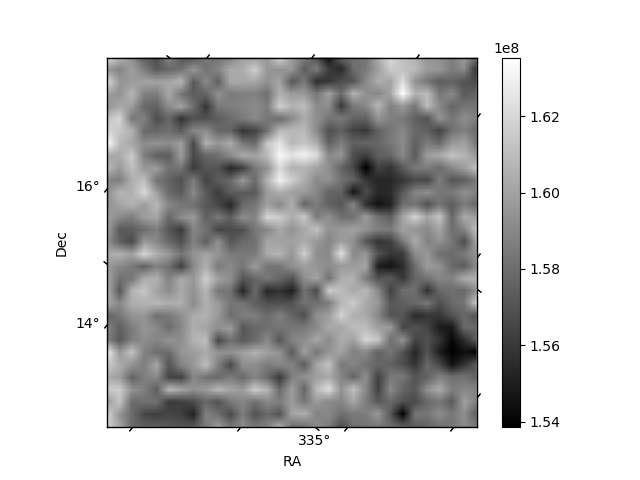
Histogram calculated using DETX and DETY for each event in the final _common_clean file
| Quadrant A | 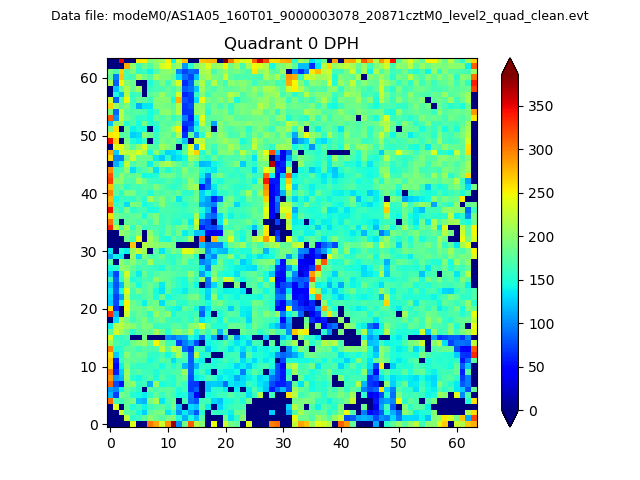 |
 |
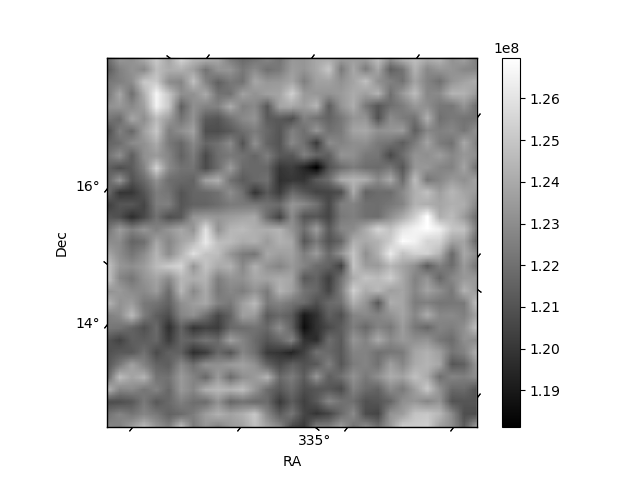
Quadrant B |
|---|---|---|---|
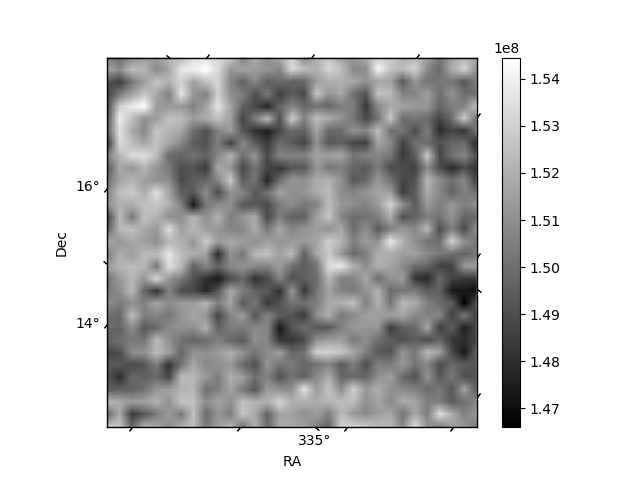
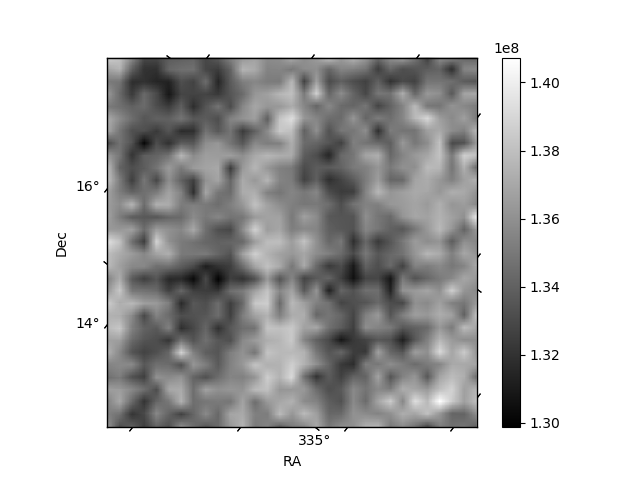
| Quadrant D | 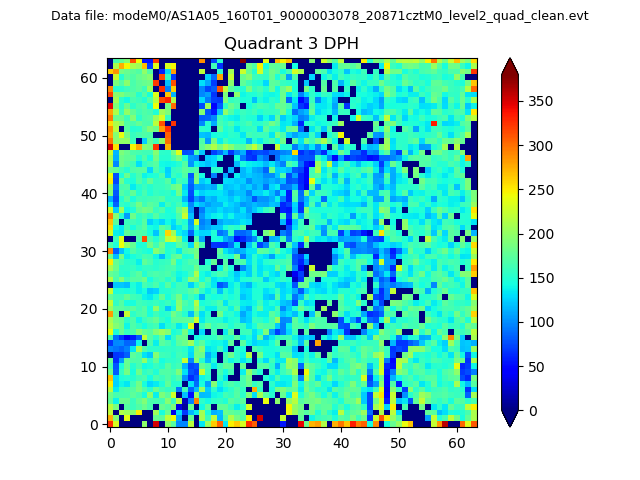 |
 |
Quadrant C |
| Plot type | Count rate plots | Images |
|---|---|---|
| Comparison with Poisson distribution Blue bars denote a histogram of data divided into 1 sec bins. Red curve is a Poisson curve with rate = median count rate of data. |
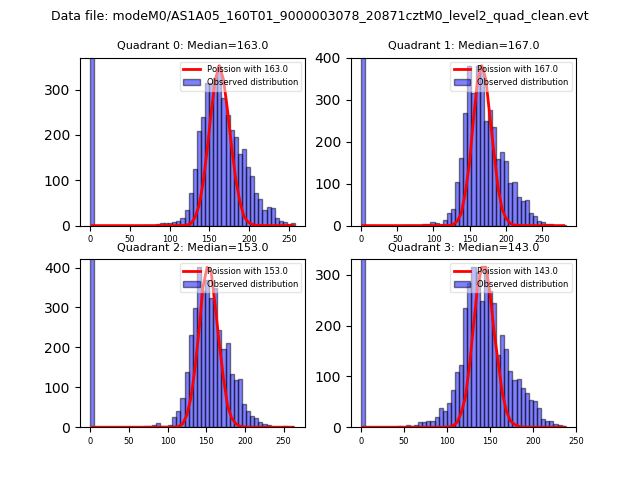 |
 |
| Quadrant-wise count rates Data is divided into 100 sec bins |
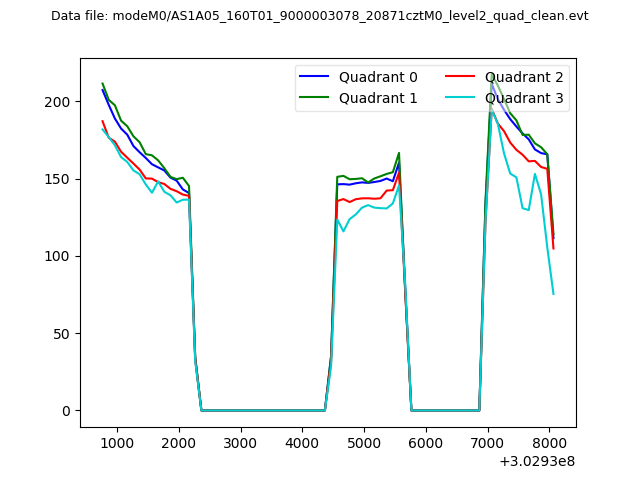 |
|
| Module-wise count rates for Quadrant A Data is divided into 100 sec bins |
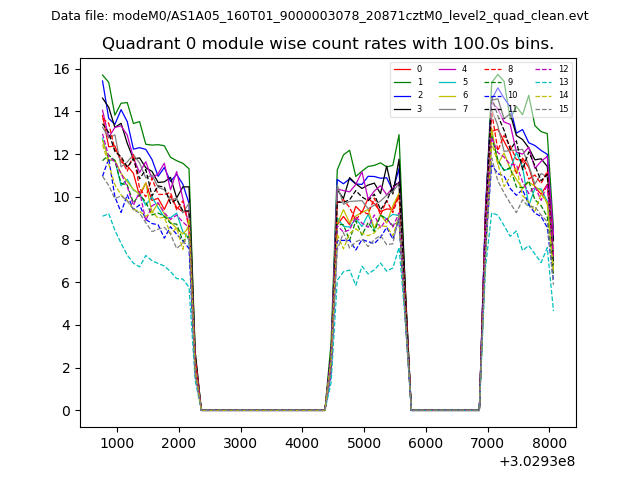 |
 |
| Module-wise count rates for Quadrant B Data is divided into 100 sec bins |
 |
 |
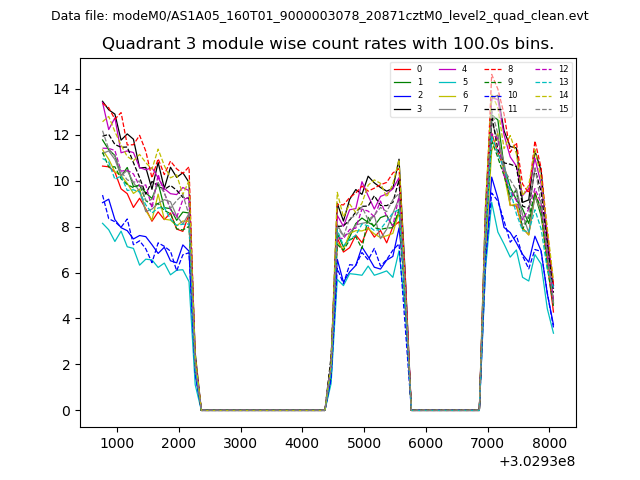
| Module-wise count rates for Quadrant C Data is divided into 100 sec bins |
 |
 |
| Module-wise count rates for Quadrant D Data is divided into 100 sec bins |
 |
 |
| Parameter | Plot |
|---|---|
| CZT HV Monitor |  |
| D_VDD | 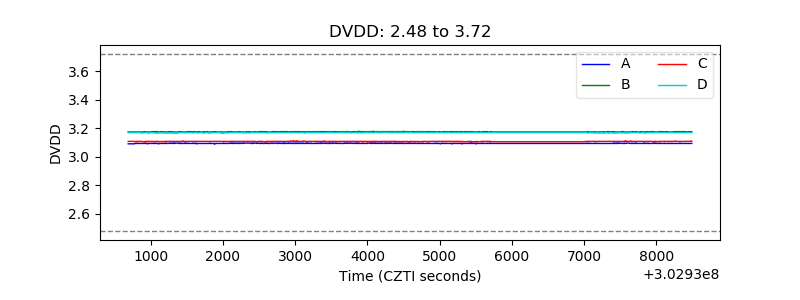 |
| Temperature 1 | 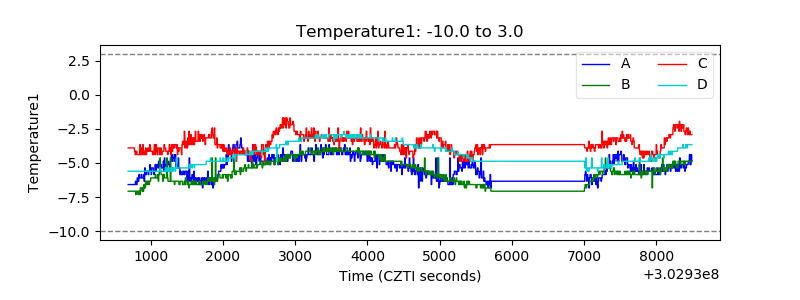 |
| Veto HV Monitor | 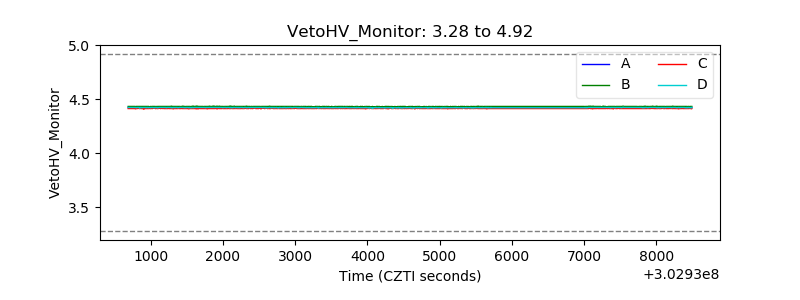 |
| Veto LLD | 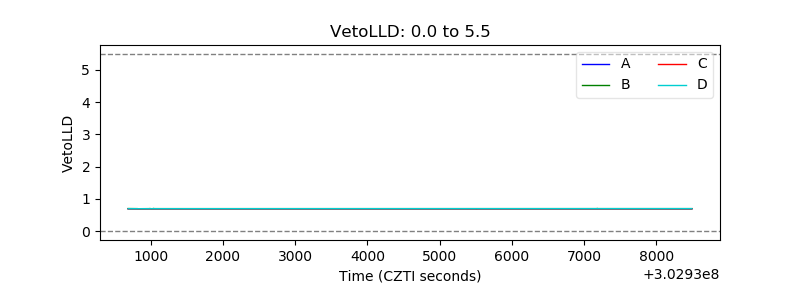 |
| Alpha Counter | 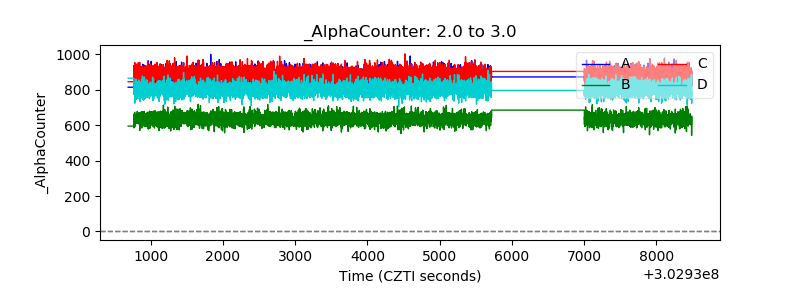 |
| _CPM_Rate | 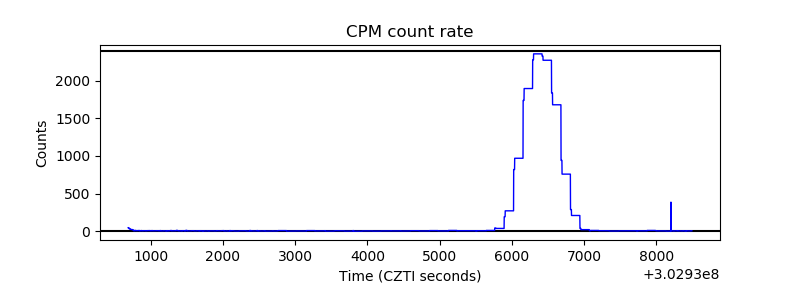 |
| CZT Counter |  |
| +2.5 Volts monitor |  |
| +5 Volts monitor | 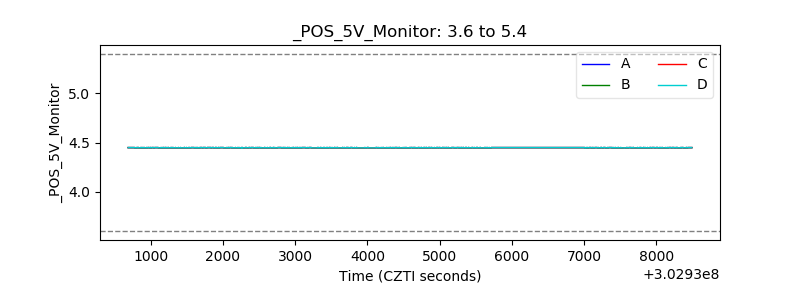 |
| _ROLL_ROT | 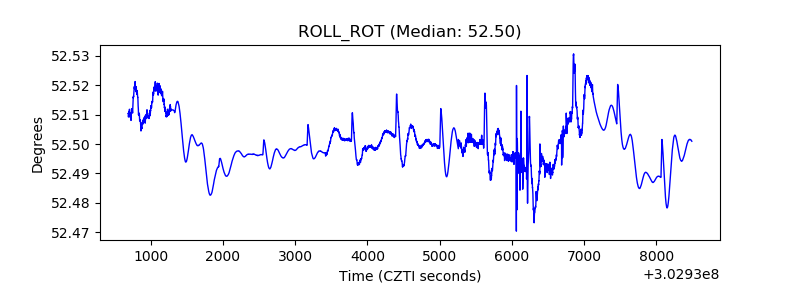 |
| _Roll_DEC | 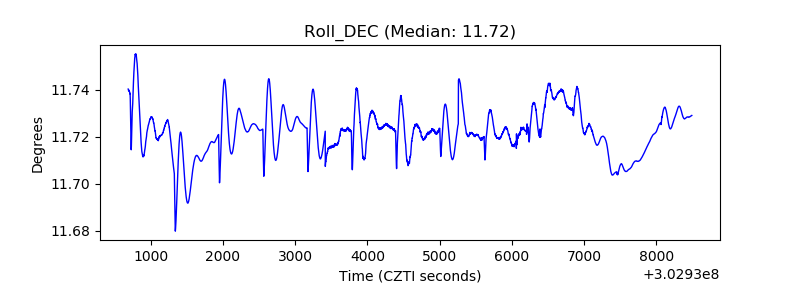 |
| _Roll_RA | 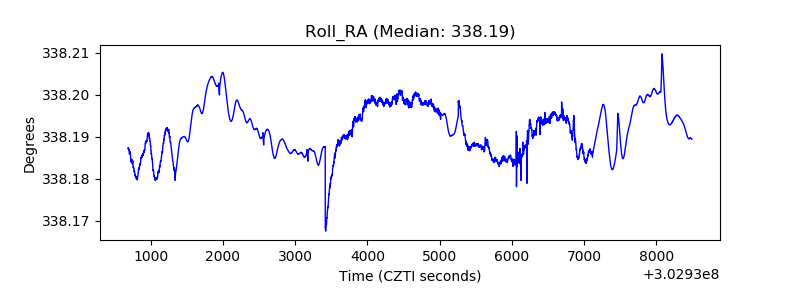 |
| Veto Counter | 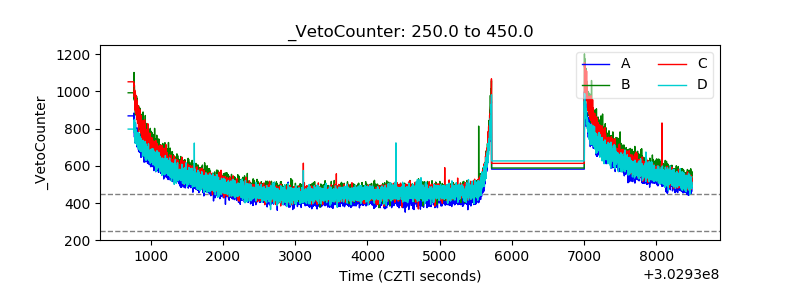 |