| Param | Original file | Final file |
|---|---|---|
| Filename | modeM0/AS1A05_160T01_9000003078_20873cztM0_level2.evt | modeM0/AS1A05_160T01_9000003078_20873cztM0_level2_quad_clean.evt |
| Size (bytes) | 581,466,240 | 70,395,840 |
| Size | 554.5 MB | 67.1 MB |
| Events in quadrant A | 3,252,850 | 450,267 |
| Events in quadrant B | 3,402,406 | 456,914 |
| Events in quadrant C | 3,196,095 | 421,783 |
| Events in quadrant D | 7,348,484 | 379,326 |
| Mode M9 | |||
|---|---|---|---|
| Quadrant | BADHDUFLAG | Total packets | Discarded packets |
| A | 0 | 13 | 0 |
| B | 0 | 13 | 0 |
| C | 0 | 13 | 0 |
| D | 0 | 13 | 0 |
| Mode M0 | |||
|---|---|---|---|
| Quadrant | BADHDUFLAG | Total packets | Discarded packets |
| A | 0 | 12951 | 1 |
| B | 0 | 13571 | 1 |
| C | 0 | 12792 | 1 |
| D | 0 | 26063 | 2 |
| Mode SS | |||
|---|---|---|---|
| Quadrant | BADHDUFLAG | Total packets | Discarded packets |
| A | 0 | 124 | 0 |
| B | 0 | 124 | 0 |
| C | 0 | 124 | 0 |
| D | 0 | 124 | 0 |
| Quadrant | Total seconds | Saturated seconds | Saturation percentage |
|---|---|---|---|
| A | 6054 | 105 | 1.734390% |
| B | 6054 | 148 | 2.444665% |
| C | 6054 | 117 | 1.932607% |
| D | 6053 | 1100 | 18.172807% |
Noise dominated data is calculated using 1-second bins in cleaned event files. If a bin has >2000 counts, and if more than 50% of those come from <1% of pixels, then it is considered to be noise-dominated and hence unusable.
| Quadrant | # 1 sec bins | Bins with >0 counts | Bins with >2000 counts | High rate bins dominated by noise | Noise dominated (total time) | Noise dominated (detector-on time) | Marked lightcurve |
|---|---|---|---|---|---|---|---|
| A | 7354 | 6055 | 0 | 0 | 0.00% | 0.00% | 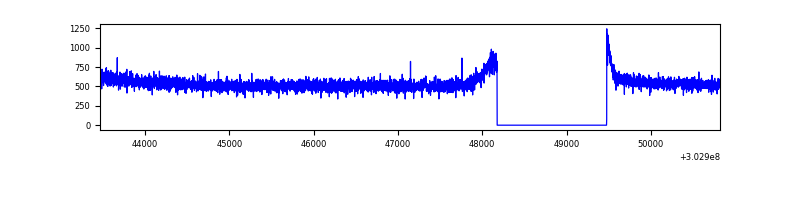 |
| B | 7354 | 6055 | 11 | 11 | 0.15% | 0.18% | 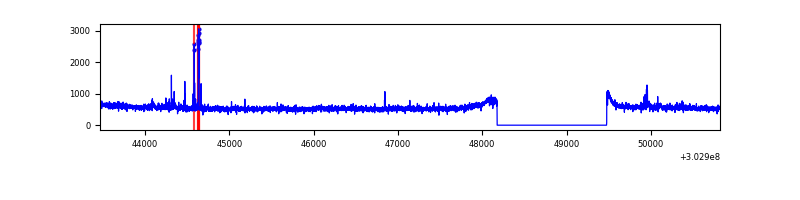 |
| C | 7354 | 6055 | 0 | 0 | 0.00% | 0.00% | 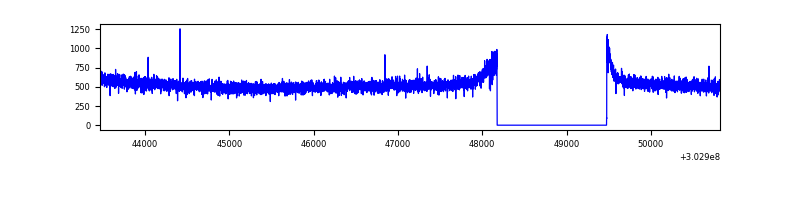 |
| D | 7353 | 6054 | 1234 | 1234 | 16.78% | 20.38% |  |
Top three noisy pixels from each quadrant. If the there are fewer than three noisy pixels in the level2.evt file, extra rows are filled as -1
| Pixel properties | Quadrant properties | ||||||
|---|---|---|---|---|---|---|---|
| Quadrant | DetID | PixID | Counts | Sigma | Mean | Median | Sigma |
| A | 0 | 226 | 7300 | 38.51 | 846 | 830 | 168.0 |
| A | 3 | 137 | 6729 | 35.11 | 846 | 830 | 168.0 |
| A | 12 | 194 | 6086 | 31.28 | 846 | 830 | 168.0 |
| B | 3 | 64 | 45584 | 287.4 | 831 | 813 | 155.8 |
| B | 0 | 189 | 44128 | 278.05 | 831 | 813 | 155.8 |
| B | 0 | 229 | 29072 | 181.4 | 831 | 813 | 155.8 |
| C | 14 | 238 | 126514 | 685.07 | 786 | 792 | 183.5 |
| C | 13 | 61 | 5402 | 25.12 | 786 | 792 | 183.5 |
| C | 7 | 247 | 2719 | 10.5 | 786 | 792 | 183.5 |
| D | 1 | 20 | 2679848 | 14347.63 | 774 | 754 | 186.7 |
| D | 1 | 52 | 1616746 | 8654.29 | 774 | 754 | 186.7 |
| D | 1 | 239 | 44740 | 235.56 | 774 | 754 | 186.7 |
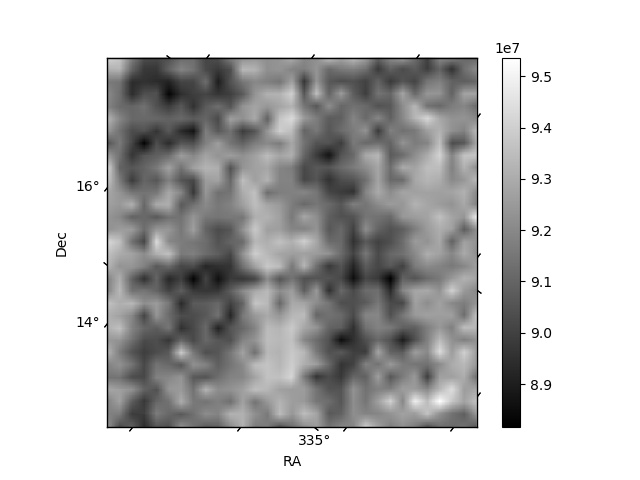
Histogram calculated using DETX and DETY for each event in the final _common_clean file
| Quadrant A |  |
 |
Quadrant B |
|---|---|---|---|
| Quadrant D |  |
 |
Quadrant C |
| Plot type | Count rate plots | Images |
|---|---|---|
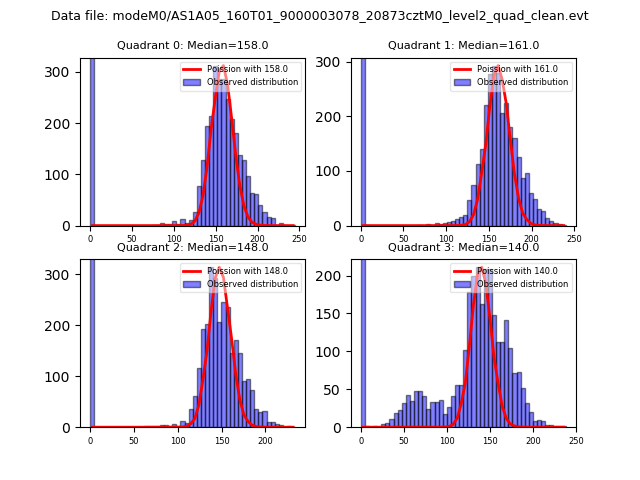
| Comparison with Poisson distribution Blue bars denote a histogram of data divided into 1 sec bins. Red curve is a Poisson curve with rate = median count rate of data. |
 |
 |
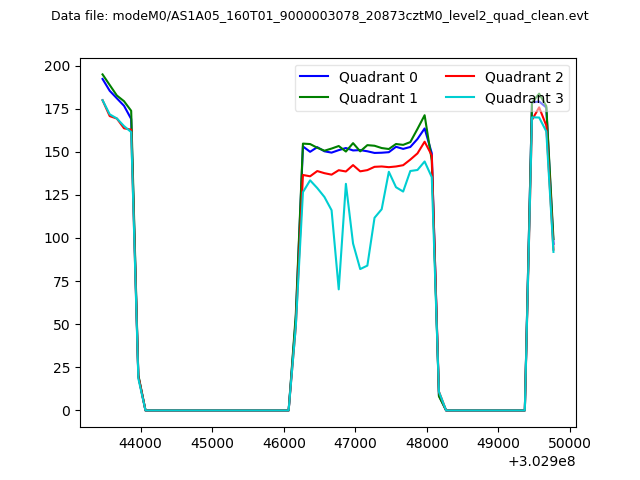
| Quadrant-wise count rates Data is divided into 100 sec bins |
 |
|
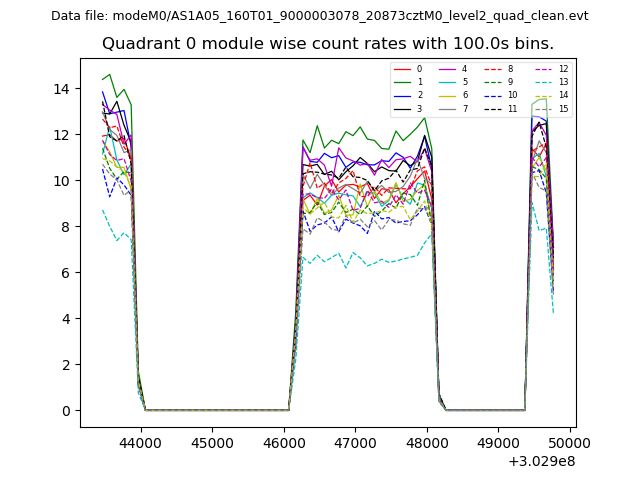
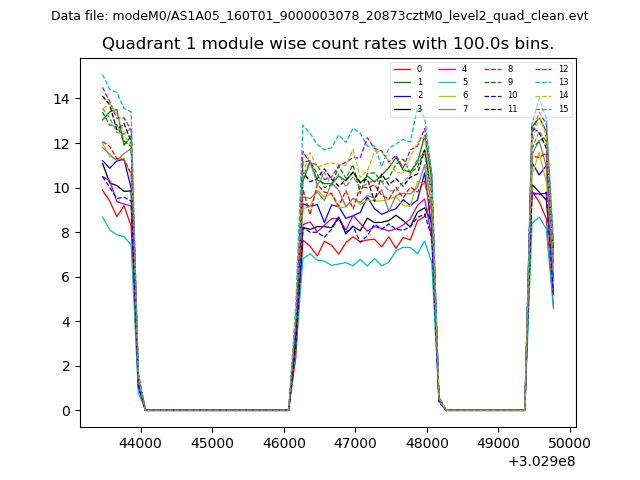
| Module-wise count rates for Quadrant A Data is divided into 100 sec bins |
 |
 |
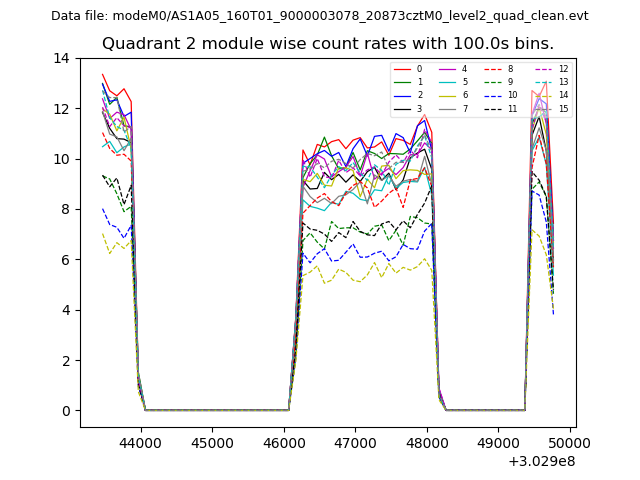
| Module-wise count rates for Quadrant B Data is divided into 100 sec bins |
 |
 |
| Module-wise count rates for Quadrant C Data is divided into 100 sec bins |
 |
 |
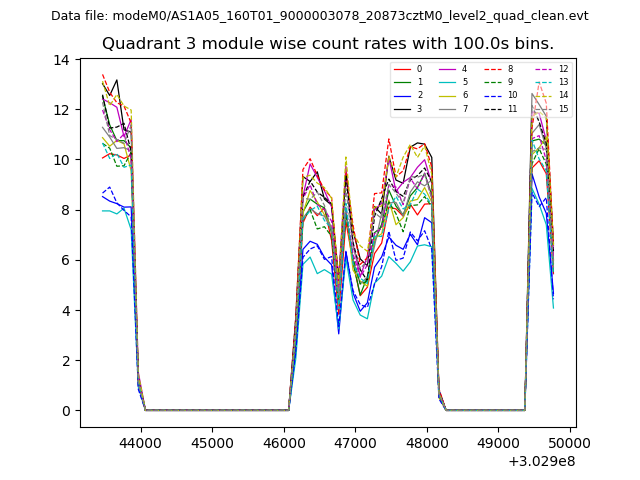
| Module-wise count rates for Quadrant D Data is divided into 100 sec bins |
 |
 |
| Parameter | Plot |
|---|---|
| CZT HV Monitor |  |
| D_VDD | 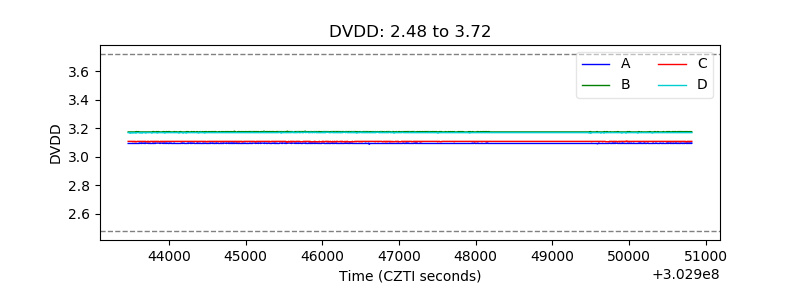 |
| Temperature 1 | 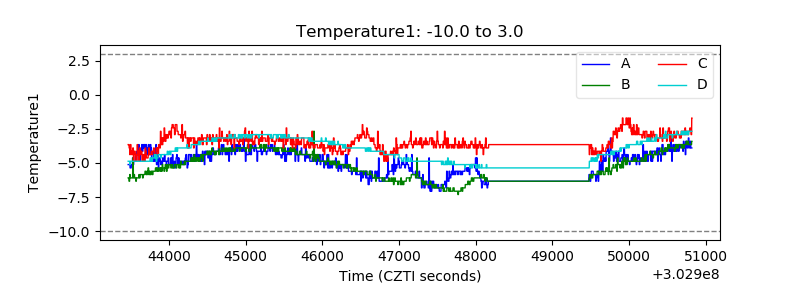 |
| Veto HV Monitor | 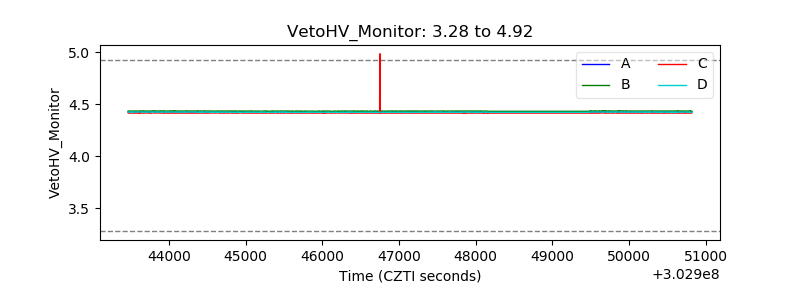 |
| Veto LLD | 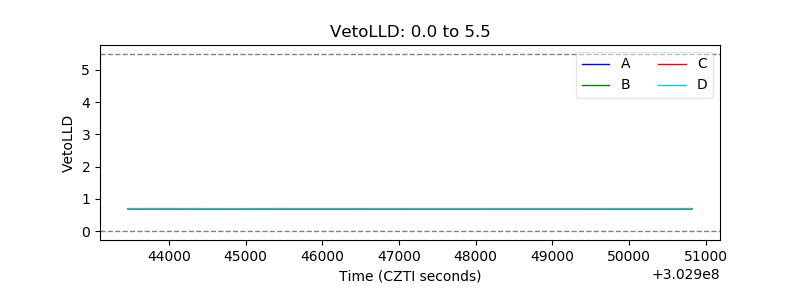 |
| Alpha Counter | 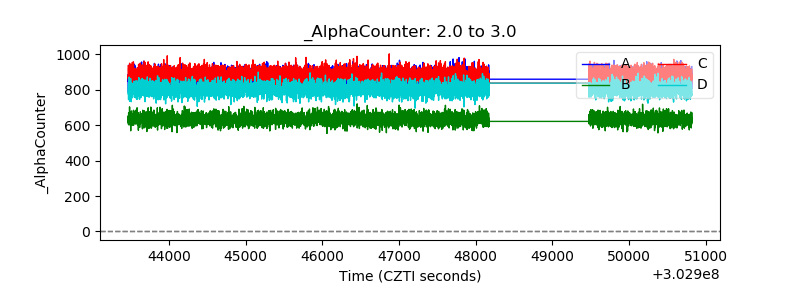 |
| _CPM_Rate | 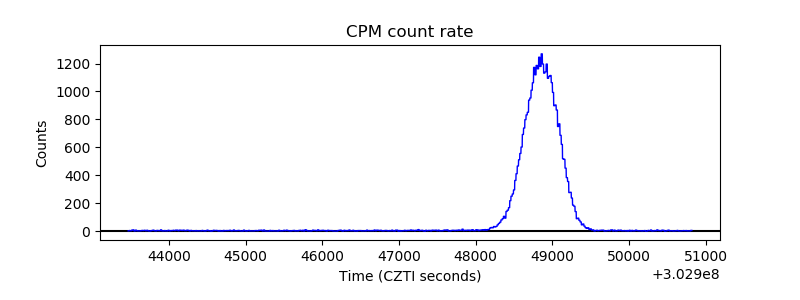 |
| CZT Counter | 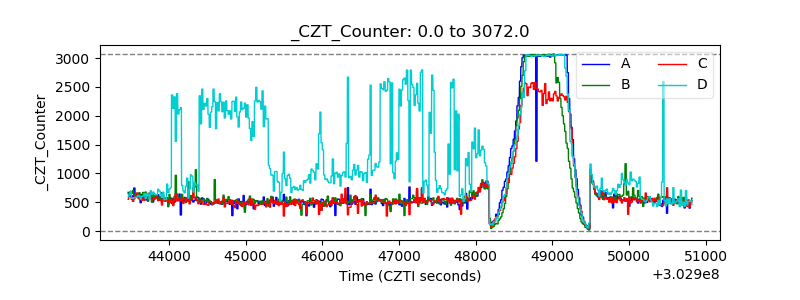 |
| +2.5 Volts monitor |  |
| +5 Volts monitor |  |
| _ROLL_ROT | 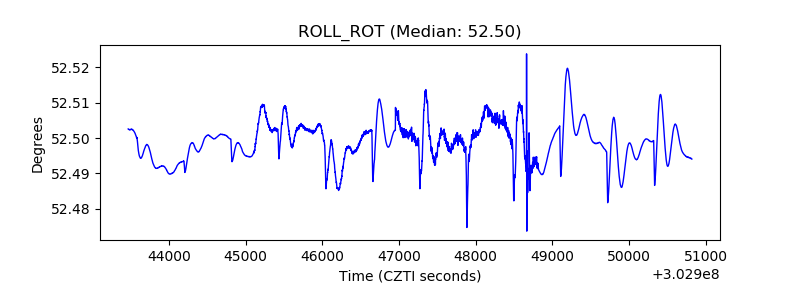 |
| _Roll_DEC | 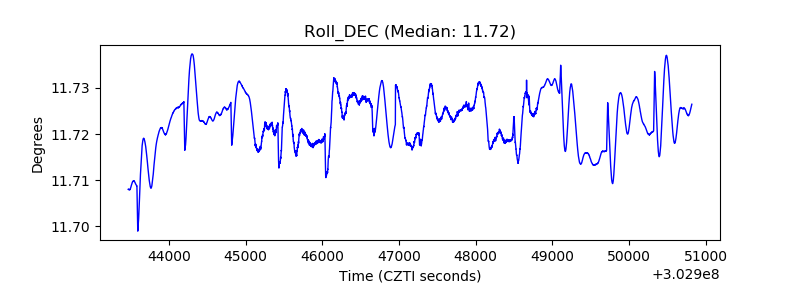 |
| _Roll_RA | 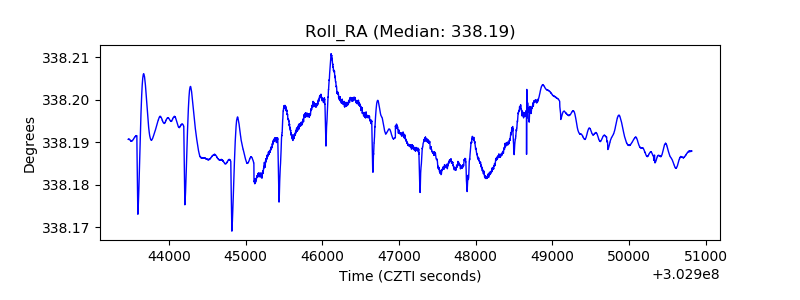 |
| Veto Counter | 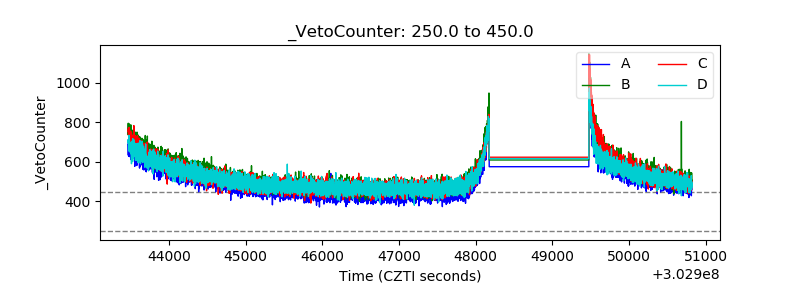 |