| Param | Original file | Final file |
|---|---|---|
| Filename | modeM0/AS1A06_002T03_9000003080cztM0_level2.fits | modeM0/AS1A06_002T03_9000003080cztM0_level2_quad_clean.evt |
| Size (bytes) | 1,421,020,800 | 912,510,720 |
| Size | 1.3 GB | 870.2 MB |
| Events in quadrant A | 3,924,760 | 4,400,915 |
| Events in quadrant B | 9,628,920 | 4,373,744 |
| Events in quadrant C | 9,910,266 | 4,267,372 |
| Events in quadrant D | 8,390,643 | 3,414,470 |
| Mode M9 | |||
|---|---|---|---|
| Quadrant | BADHDUFLAG | Total packets | Discarded packets |
| A | 0 | 257 | 0 |
| B | 0 | 257 | 0 |
| C | 0 | 257 | 0 |
| D | 0 | 258 | 0 |
| Mode M0 | |||
|---|---|---|---|
| Quadrant | BADHDUFLAG | Total packets | Discarded packets |
| A | 0 | 342699 | 0 |
| B | 0 | 364126 | 0 |
| C | 0 | 344052 | 0 |
| D | 0 | 508000 | 0 |
| Mode SS | |||
|---|---|---|---|
| Quadrant | BADHDUFLAG | Total packets | Discarded packets |
| A | 0 | 3324 | 0 |
| B | 0 | 3318 | 0 |
| C | 0 | 3312 | 0 |
| D | 0 | 3318 | 0 |
| Quadrant | Total seconds | Saturated seconds | Saturation percentage |
|---|---|---|---|
| A | 163083 | 1997 | 1.224530% |
| B | 163076 | 2869 | 1.759302% |
| C | 163067 | 3045 | 1.867331% |
| D | 163068 | 13978 | 8.571884% |
Noise dominated data is calculated using 1-second bins in cleaned event files. If a bin has >2000 counts, and if more than 50% of those come from <1% of pixels, then it is considered to be noise-dominated and hence unusable.
| Quadrant | # 1 sec bins | Bins with >0 counts | Bins with >2000 counts | High rate bins dominated by noise | Noise dominated (total time) | Noise dominated (detector-on time) | Marked lightcurve |
|---|---|---|---|---|---|---|---|
| A | 196387 | 62951 | 0 | 0 | 0.00% | 0.00% |  |
| B | 1043651 | 163297 | 0 | 0 | 0.00% | 0.00% |  |
| C | 1043651 | 163271 | 0 | 0 | 0.00% | 0.00% |  |
| D | 1043650 | 163186 | 0 | 0 | 0.00% | 0.00% |  |
Top three noisy pixels from each quadrant. If the there are fewer than three noisy pixels in the level2.evt file, extra rows are filled as -1
| Pixel properties | Quadrant properties | ||||||
|---|---|---|---|---|---|---|---|
| Quadrant | DetID | PixID | Counts | Sigma | Mean | Median | Sigma |
| A | 0 | 29 | 3759 | 11.21 | 1021 | 959 | 249.8 |
| A | 7 | 110 | 3139 | 8.73 | 1021 | 959 | 249.8 |
| A | 9 | 19 | 2987 | 8.12 | 1021 | 959 | 249.8 |
| B | 2 | 9 | 7704 | 10.71 | 2549 | 2440 | 491.4 |
| B | 2 | 8 | 6432 | 8.12 | 2549 | 2440 | 491.4 |
| B | 5 | 128 | 6314 | 7.88 | 2549 | 2440 | 491.4 |
| C | 12 | 241 | 6700 | 6.34 | 2621 | 2458 | 669.0 |
| C | 2 | 191 | 6629 | 6.24 | 2621 | 2458 | 669.0 |
| C | 12 | 250 | 6618 | 6.22 | 2621 | 2458 | 669.0 |
| D | 3 | 14 | 6166 | 6.26 | 2400 | 2193 | 635.0 |
| D | 7 | 3 | 5909 | 5.85 | 2400 | 2193 | 635.0 |
| D | 10 | 189 | 5858 | 5.77 | 2400 | 2193 | 635.0 |
Histogram calculated using DETX and DETY for each event in the final _common_clean file
| Quadrant A | 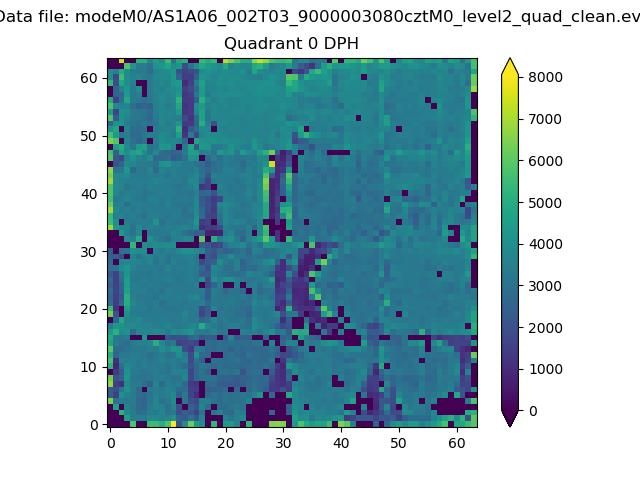 |
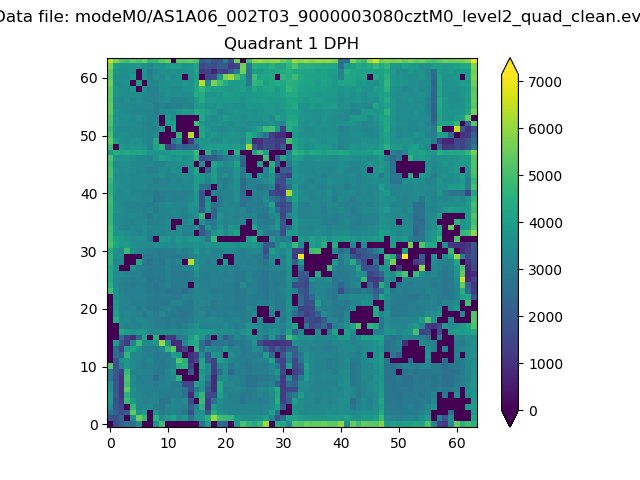 |
Quadrant B |
|---|---|---|---|
| Quadrant D |  |
 |
Quadrant C |
| Plot type | Count rate plots | Images |
|---|---|---|
| Comparison with Poisson distribution Blue bars denote a histogram of data divided into 1 sec bins. Red curve is a Poisson curve with rate = median count rate of data. |
 |
 |
| Quadrant-wise count rates Data is divided into 100 sec bins |
 |
|
| Module-wise count rates for Quadrant A Data is divided into 100 sec bins |
 |
 |
| Module-wise count rates for Quadrant B Data is divided into 100 sec bins |
 |
 |
| Module-wise count rates for Quadrant C Data is divided into 100 sec bins |
 |
 |
| Module-wise count rates for Quadrant D Data is divided into 100 sec bins |
 |
 |
| Parameter | Plot |
|---|---|
| CZT HV Monitor |  |
| D_VDD | 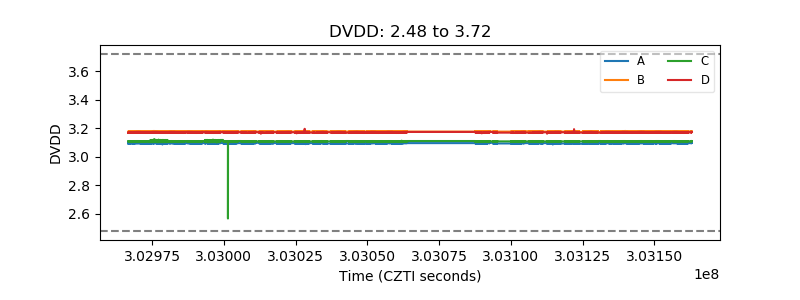 |
| Temperature 1 |  |
| Veto HV Monitor |  |
| Veto LLD |  |
| Alpha Counter |  |
| _CPM_Rate |  |
| CZT Counter |  |
| +2.5 Volts monitor |  |
| +5 Volts monitor |  |
| _ROLL_ROT | 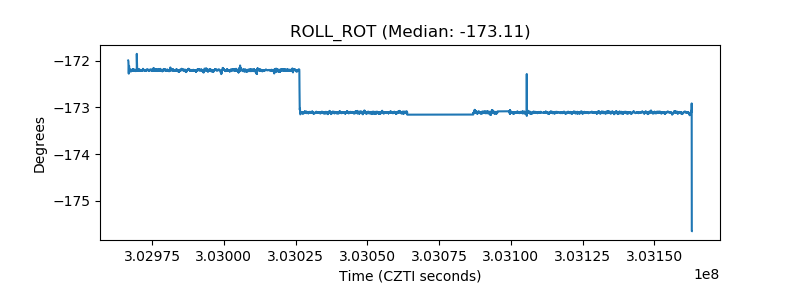 |
| _Roll_DEC |  |
| _Roll_RA |  |
| Veto Counter |  |