| Param | Original file | Final file |
|---|---|---|
| Filename | modeM0/AS1A06_002T03_9000003080_20876cztM0_level2.evt | modeM0/AS1A06_002T03_9000003080_20876cztM0_level2_quad_clean.evt |
| Size (bytes) | 189,233,280 | 29,056,320 |
| Size | 180.5 MB | 27.7 MB |
| Events in quadrant A | 1,311,776 | 176,590 |
| Events in quadrant B | 1,460,517 | 178,269 |
| Events in quadrant C | 1,347,840 | 173,818 |
| Events in quadrant D | 1,436,187 | 168,440 |
| Mode M9 | |||
|---|---|---|---|
| Quadrant | BADHDUFLAG | Total packets | Discarded packets |
| A | 0 | 4 | 0 |
| B | 0 | 4 | 0 |
| C | 0 | 4 | 0 |
| D | 0 | 4 | 0 |
| Mode M0 | |||
|---|---|---|---|
| Quadrant | BADHDUFLAG | Total packets | Discarded packets |
| A | 0 | 5372 | 1 |
| B | 0 | 5847 | 1 |
| C | 0 | 5499 | 1 |
| D | 0 | 5790 | 1 |
| Mode SS | |||
|---|---|---|---|
| Quadrant | BADHDUFLAG | Total packets | Discarded packets |
| A | 0 | 54 | 0 |
| B | 0 | 54 | 0 |
| C | 0 | 54 | 0 |
| D | 0 | 54 | 0 |
| Quadrant | Total seconds | Saturated seconds | Saturation percentage |
|---|---|---|---|
| A | 2533 | 63 | 2.487169% |
| B | 2533 | 65 | 2.566127% |
| C | 2533 | 74 | 2.921437% |
| D | 2533 | 48 | 1.894986% |
Noise dominated data is calculated using 1-second bins in cleaned event files. If a bin has >2000 counts, and if more than 50% of those come from <1% of pixels, then it is considered to be noise-dominated and hence unusable.
| Quadrant | # 1 sec bins | Bins with >0 counts | Bins with >2000 counts | High rate bins dominated by noise | Noise dominated (total time) | Noise dominated (detector-on time) | Marked lightcurve |
|---|---|---|---|---|---|---|---|
| A | 2928 | 2534 | 0 | 0 | 0.00% | 0.00% | 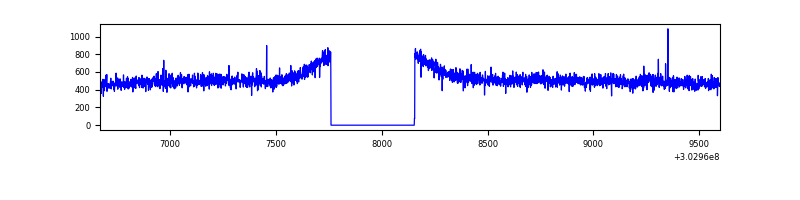 |
| B | 2928 | 2534 | 2 | 2 | 0.07% | 0.08% | 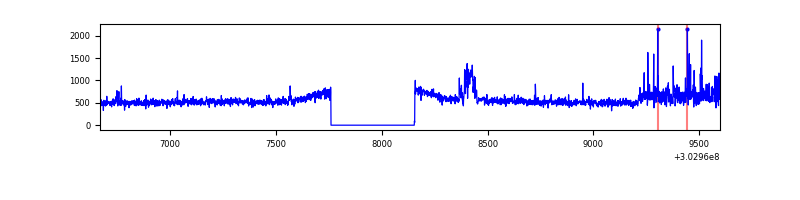 |
| C | 2928 | 2534 | 0 | 0 | 0.00% | 0.00% | 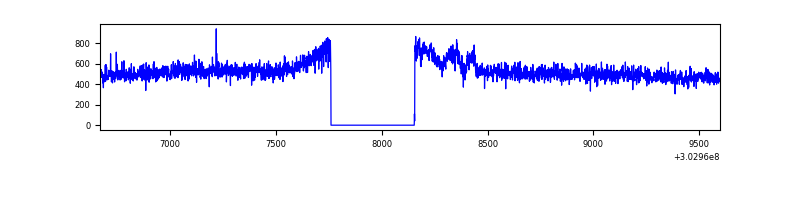 |
| D | 2928 | 2534 | 7 | 7 | 0.24% | 0.28% | 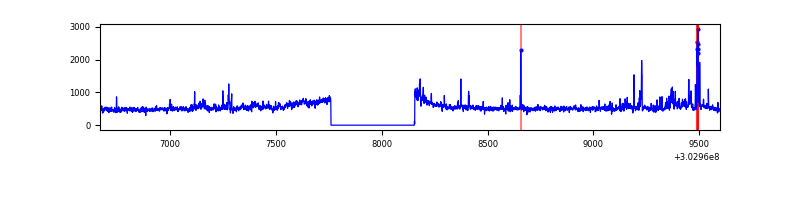 |
Top three noisy pixels from each quadrant. If the there are fewer than three noisy pixels in the level2.evt file, extra rows are filled as -1
| Pixel properties | Quadrant properties | ||||||
|---|---|---|---|---|---|---|---|
| Quadrant | DetID | PixID | Counts | Sigma | Mean | Median | Sigma |
| A | 3 | 137 | 2951 | 37.28 | 340 | 332 | 70.3 |
| A | 0 | 226 | 2916 | 36.78 | 340 | 332 | 70.3 |
| A | 12 | 194 | 2428 | 29.83 | 340 | 332 | 70.3 |
| B | 7 | 220 | 72339 | 1059.21 | 337 | 327 | 68.0 |
| B | 0 | 230 | 34197 | 498.19 | 337 | 327 | 68.0 |
| B | 12 | 111 | 8068 | 113.86 | 337 | 327 | 68.0 |
| C | 14 | 238 | 51620 | 648.05 | 328 | 329 | 79.1 |
| C | 10 | 91 | 13197 | 162.58 | 328 | 329 | 79.1 |
| C | 13 | 61 | 2324 | 25.21 | 328 | 329 | 79.1 |
| D | 1 | 52 | 71216 | 855.55 | 334 | 323 | 82.9 |
| D | 1 | 20 | 47726 | 572.07 | 334 | 323 | 82.9 |
| D | 13 | 153 | 28144 | 335.75 | 334 | 323 | 82.9 |
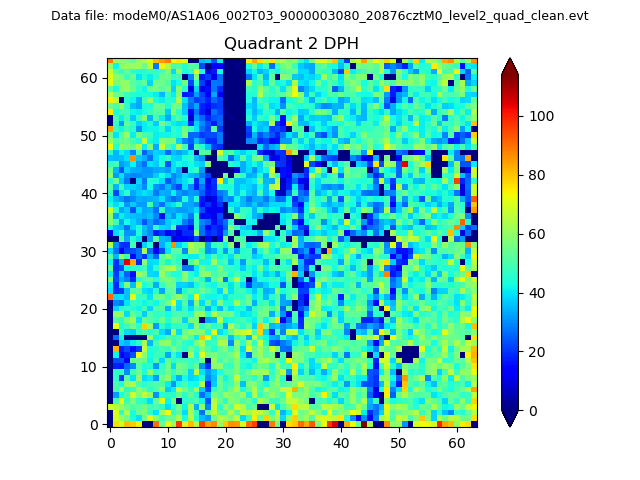
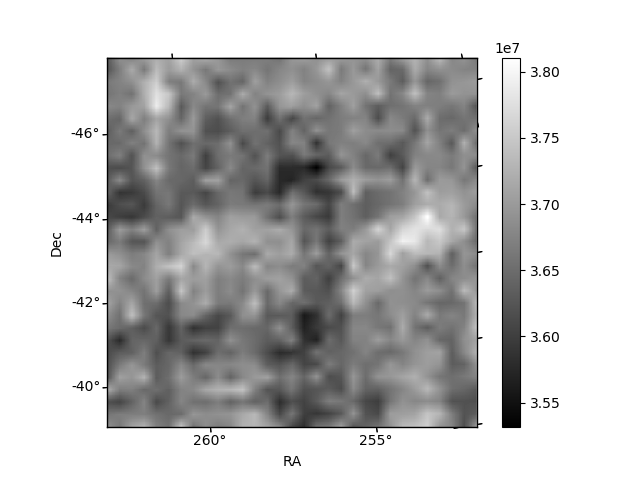
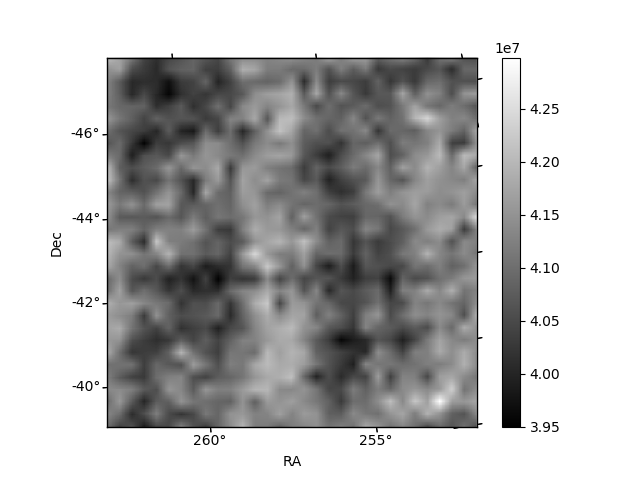
Histogram calculated using DETX and DETY for each event in the final _common_clean file
| Quadrant A | 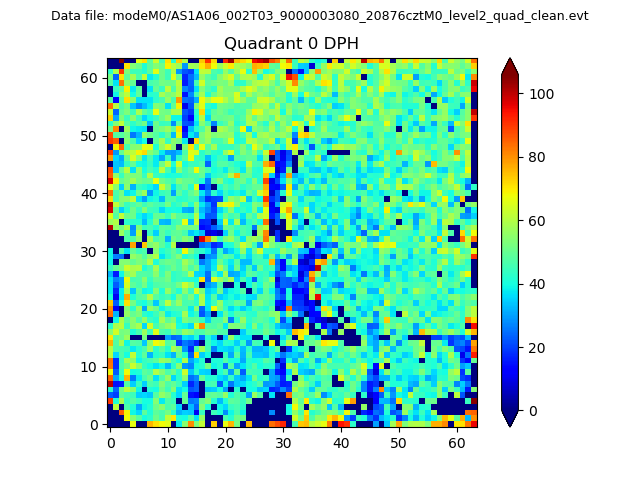 |
 |
Quadrant B |
|---|---|---|---|
| Quadrant D |  |
 |
Quadrant C |
| Plot type | Count rate plots | Images |
|---|---|---|
| Comparison with Poisson distribution Blue bars denote a histogram of data divided into 1 sec bins. Red curve is a Poisson curve with rate = median count rate of data. |
 |
 |
| Quadrant-wise count rates Data is divided into 100 sec bins |
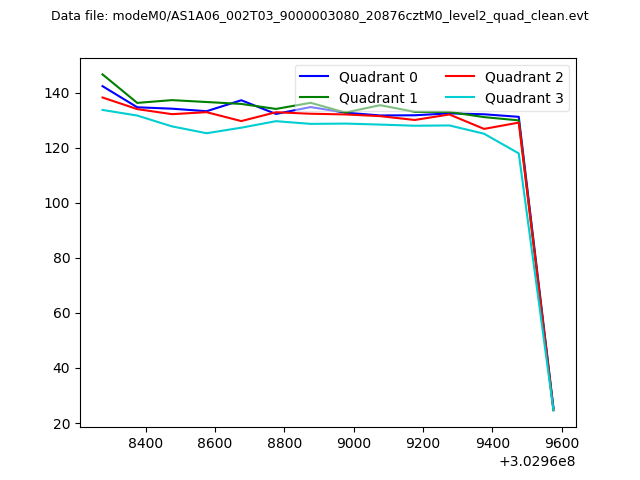 |
|
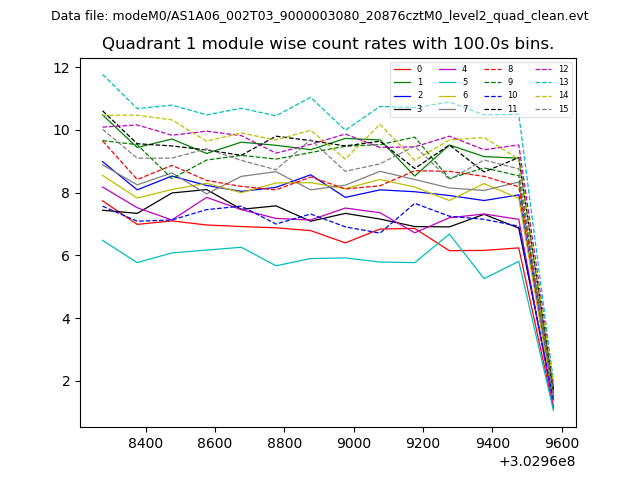
| Module-wise count rates for Quadrant A Data is divided into 100 sec bins |
 |
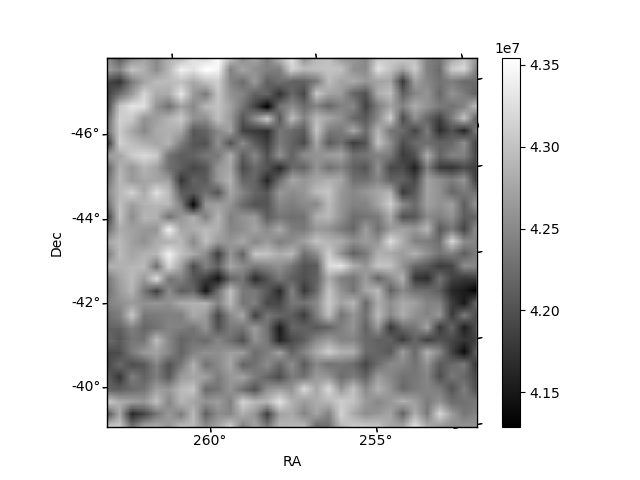 |
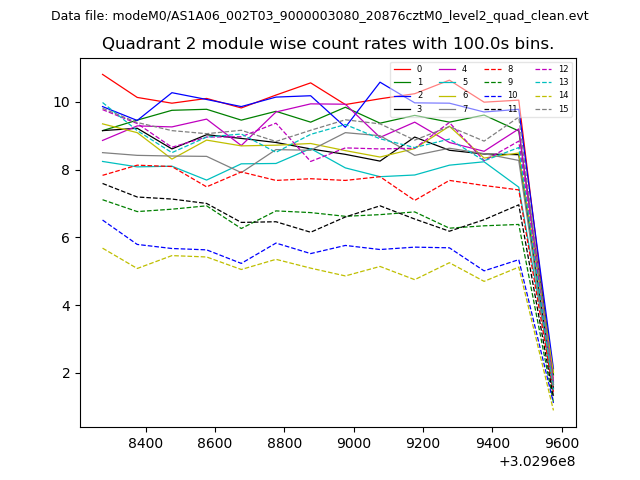
| Module-wise count rates for Quadrant B Data is divided into 100 sec bins |
 |
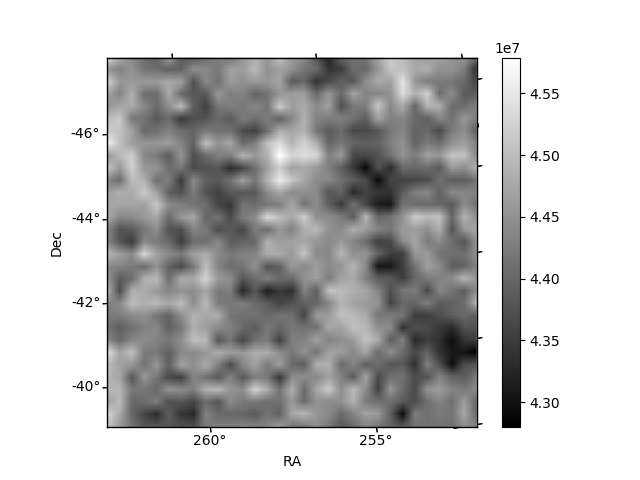 |
| Module-wise count rates for Quadrant C Data is divided into 100 sec bins |
 |
 |
| Module-wise count rates for Quadrant D Data is divided into 100 sec bins |
 |
 |
| Parameter | Plot |
|---|---|
| CZT HV Monitor | 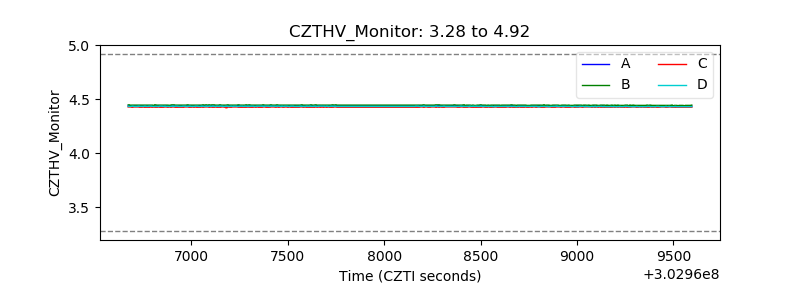 |
| D_VDD | 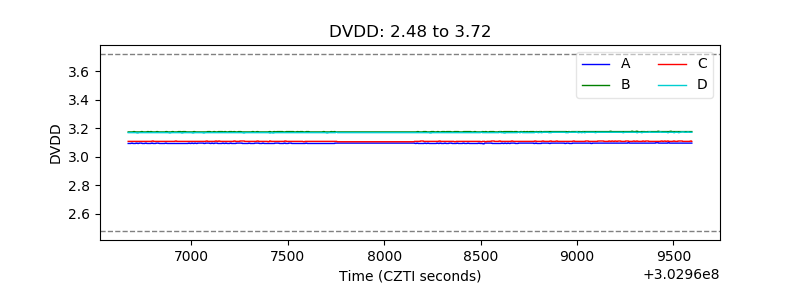 |
| Temperature 1 | 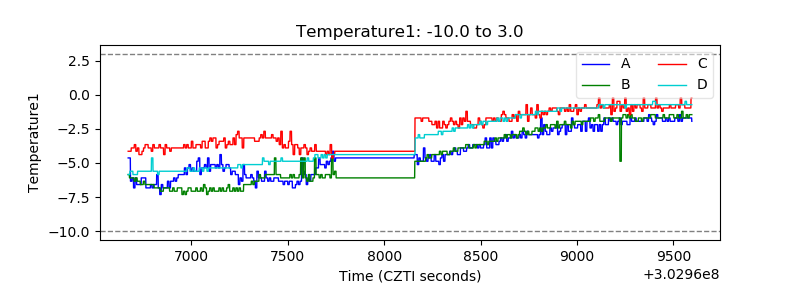 |
| Veto HV Monitor | 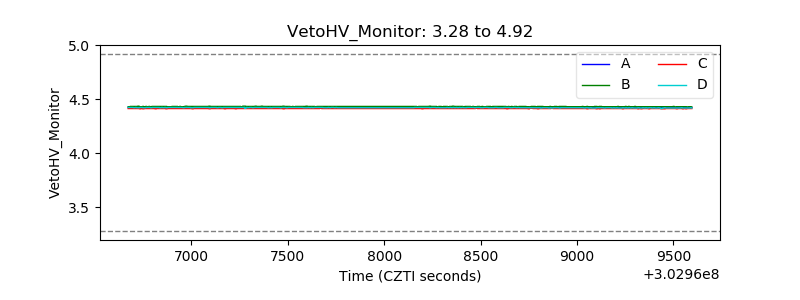 |
| Veto LLD | 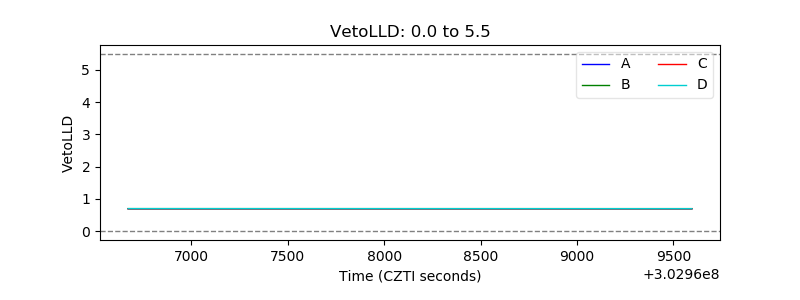 |
| Alpha Counter | 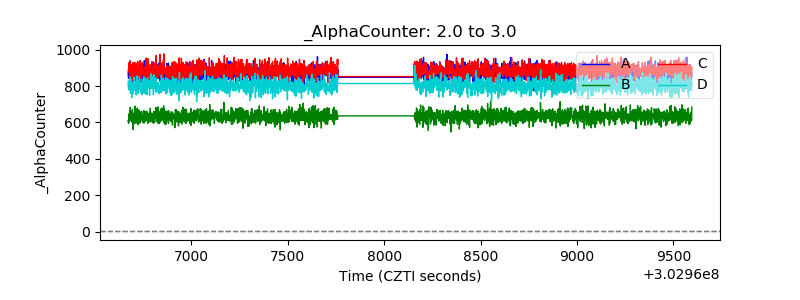 |
| _CPM_Rate | 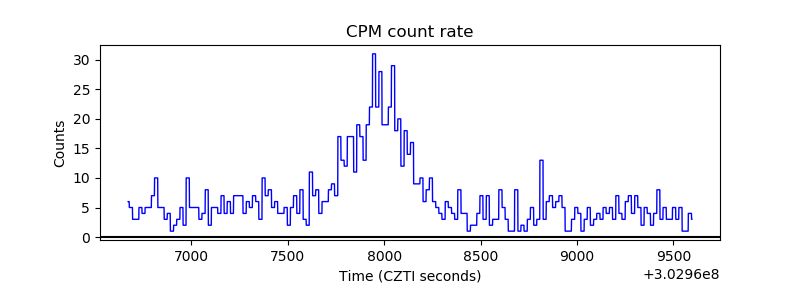 |
| CZT Counter | 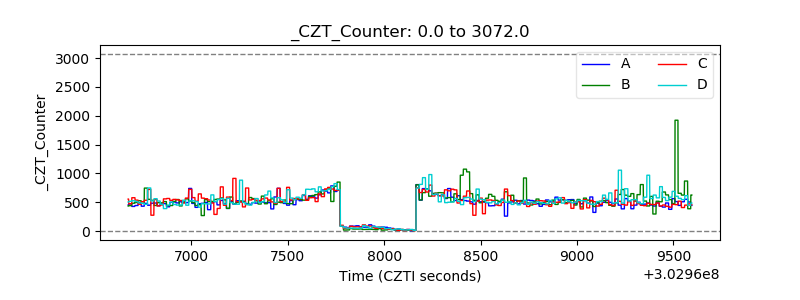 |
| +2.5 Volts monitor |  |
| +5 Volts monitor |  |
| _ROLL_ROT |  |
| _Roll_DEC | 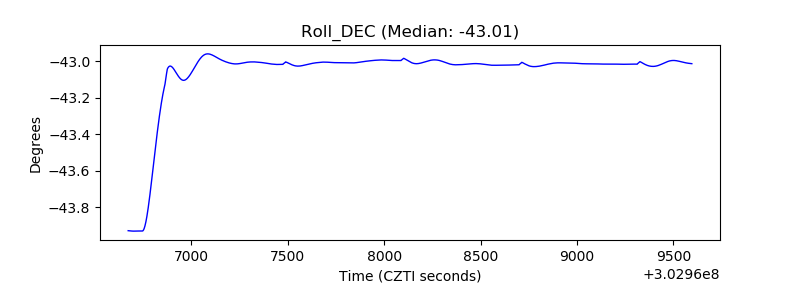 |
| _Roll_RA | 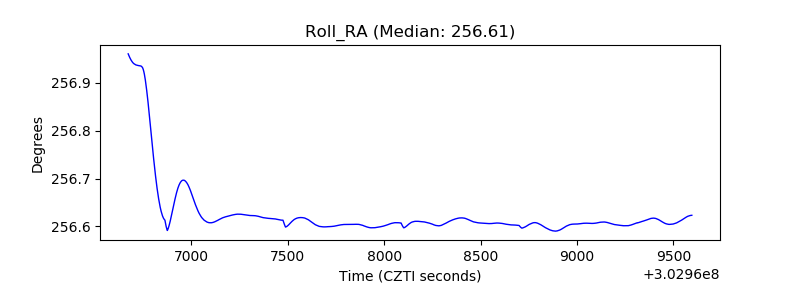 |
| Veto Counter | 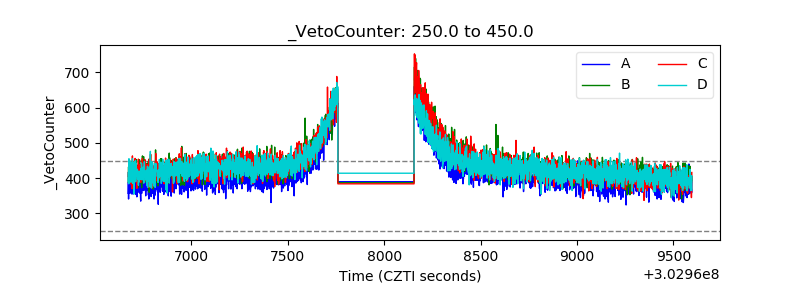 |