| Param | Original file | Final file |
|---|---|---|
| Filename | modeM0/AS1A06_002T03_9000003080_20877cztM0_level2.evt | modeM0/AS1A06_002T03_9000003080_20877cztM0_level2_quad_clean.evt |
| Size (bytes) | 508,429,440 | 101,053,440 |
| Size | 484.9 MB | 96.4 MB |
| Events in quadrant A | 3,391,450 | 656,456 |
| Events in quadrant B | 3,932,857 | 654,385 |
| Events in quadrant C | 3,389,059 | 638,384 |
| Events in quadrant D | 4,202,651 | 616,959 |
| Mode M9 | |||
|---|---|---|---|
| Quadrant | BADHDUFLAG | Total packets | Discarded packets |
| A | 0 | 1 | 0 |
| B | 0 | 1 | 0 |
| C | 0 | 1 | 0 |
| D | 0 | 1 | 0 |
| Mode M0 | |||
|---|---|---|---|
| Quadrant | BADHDUFLAG | Total packets | Discarded packets |
| A | 0 | 14693 | 2 |
| B | 0 | 16181 | 2 |
| C | 0 | 14688 | 2 |
| D | 0 | 17140 | 2 |
| Mode SS | |||
|---|---|---|---|
| Quadrant | BADHDUFLAG | Total packets | Discarded packets |
| A | 0 | 144 | 0 |
| B | 0 | 144 | 0 |
| C | 0 | 144 | 0 |
| D | 0 | 144 | 0 |
| Quadrant | Total seconds | Saturated seconds | Saturation percentage |
|---|---|---|---|
| A | 7094 | 126 | 1.776149% |
| B | 7095 | 193 | 2.720226% |
| C | 7095 | 150 | 2.114165% |
| D | 7095 | 169 | 2.381959% |
Noise dominated data is calculated using 1-second bins in cleaned event files. If a bin has >2000 counts, and if more than 50% of those come from <1% of pixels, then it is considered to be noise-dominated and hence unusable.
| Quadrant | # 1 sec bins | Bins with >0 counts | Bins with >2000 counts | High rate bins dominated by noise | Noise dominated (total time) | Noise dominated (detector-on time) | Marked lightcurve |
|---|---|---|---|---|---|---|---|
| A | 7224 | 7096 | 0 | 0 | 0.00% | 0.00% | 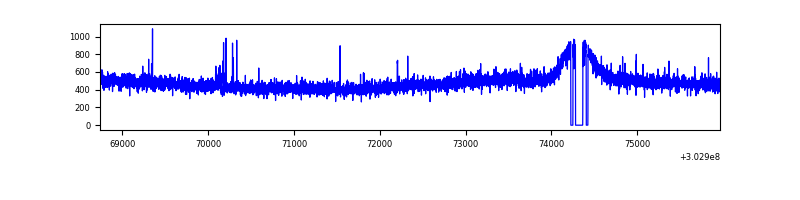 |
| B | 7225 | 7098 | 20 | 20 | 0.28% | 0.28% | 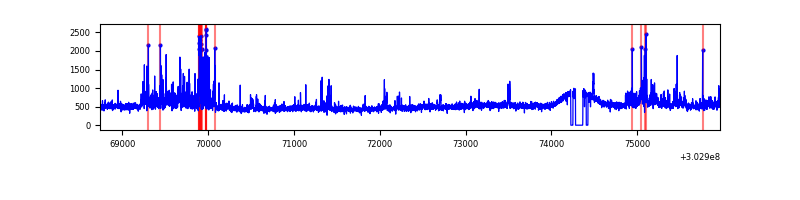 |
| C | 7225 | 7098 | 0 | 0 | 0.00% | 0.00% | 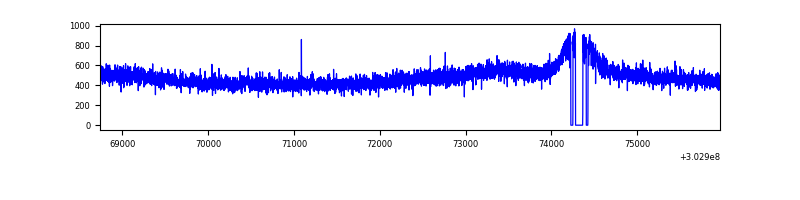 |
| D | 7225 | 7098 | 86 | 86 | 1.19% | 1.21% | 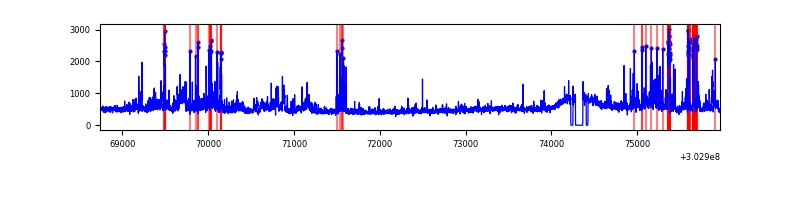 |
Top three noisy pixels from each quadrant. If the there are fewer than three noisy pixels in the level2.evt file, extra rows are filled as -1
| Pixel properties | Quadrant properties | ||||||
|---|---|---|---|---|---|---|---|
| Quadrant | DetID | PixID | Counts | Sigma | Mean | Median | Sigma |
| A | 5 | 98 | 16930 | 90.73 | 877 | 859 | 177.1 |
| A | 0 | 226 | 7770 | 39.02 | 877 | 859 | 177.1 |
| A | 3 | 137 | 7202 | 35.81 | 877 | 859 | 177.1 |
| B | 7 | 220 | 203868 | 1215.65 | 869 | 847 | 167.0 |
| B | 0 | 197 | 81874 | 485.17 | 869 | 847 | 167.0 |
| B | 0 | 189 | 70329 | 416.05 | 869 | 847 | 167.0 |
| C | 14 | 238 | 129838 | 657.86 | 833 | 839 | 196.1 |
| C | 13 | 61 | 5711 | 24.85 | 833 | 839 | 196.1 |
| C | 10 | 91 | 4852 | 20.47 | 833 | 839 | 196.1 |
| D | 1 | 52 | 421996 | 2016.28 | 845 | 819 | 208.9 |
| D | 1 | 20 | 214513 | 1023.01 | 845 | 819 | 208.9 |
| D | 13 | 153 | 147192 | 700.73 | 845 | 819 | 208.9 |
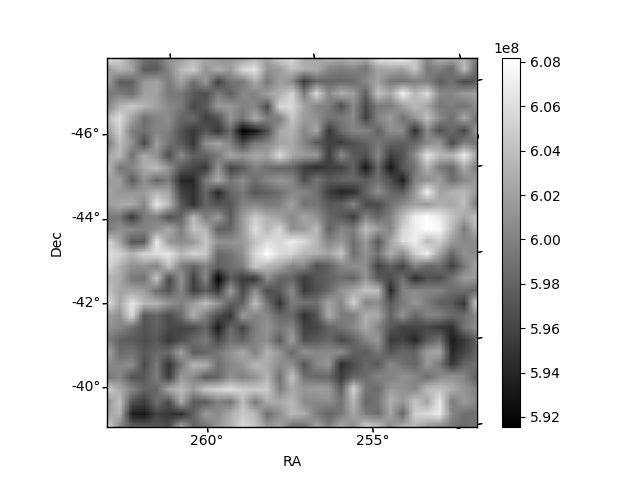
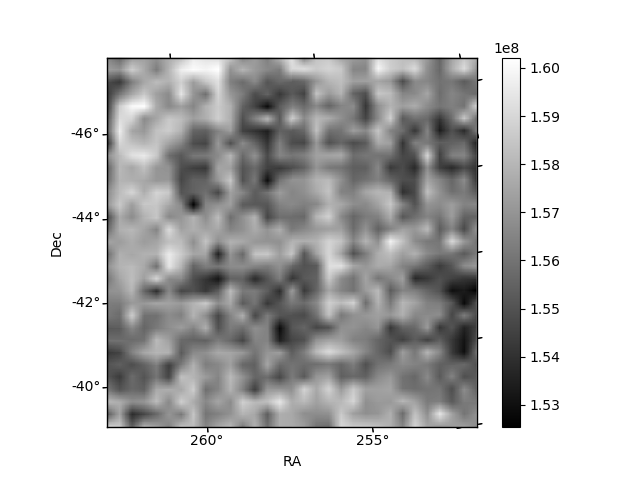
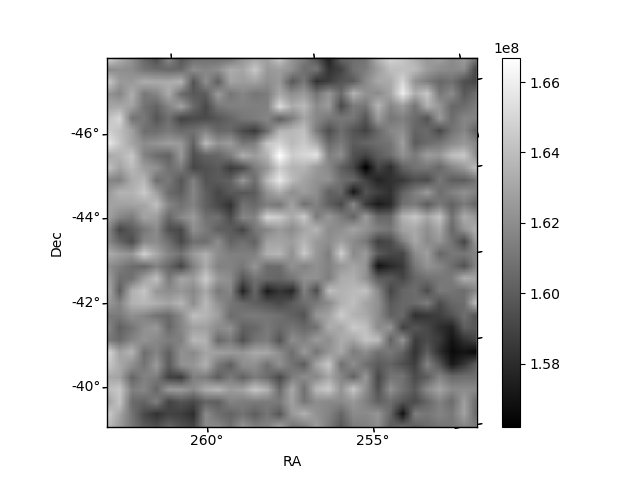
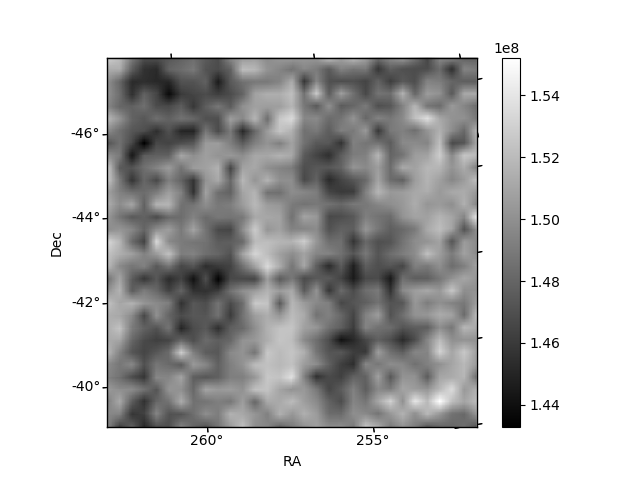
Histogram calculated using DETX and DETY for each event in the final _common_clean file
| Quadrant A | 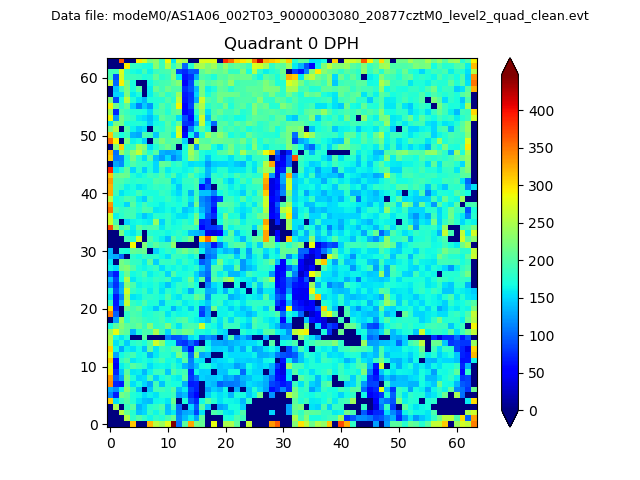 |
 |
Quadrant B |
|---|---|---|---|
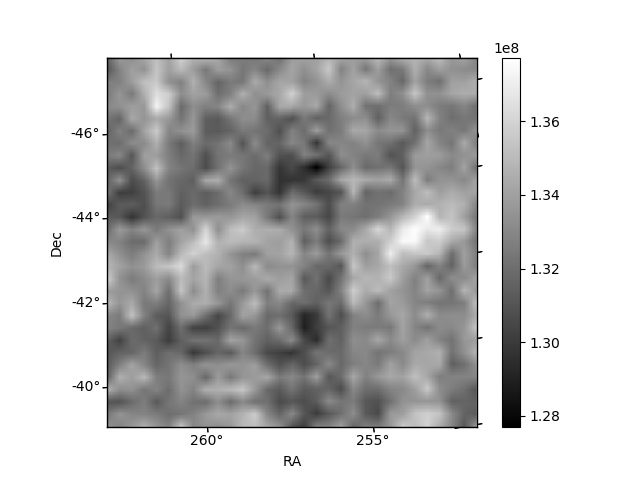
| Quadrant D | 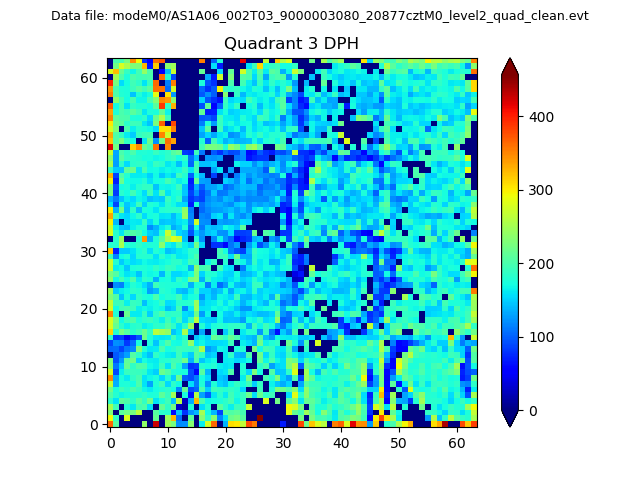 |
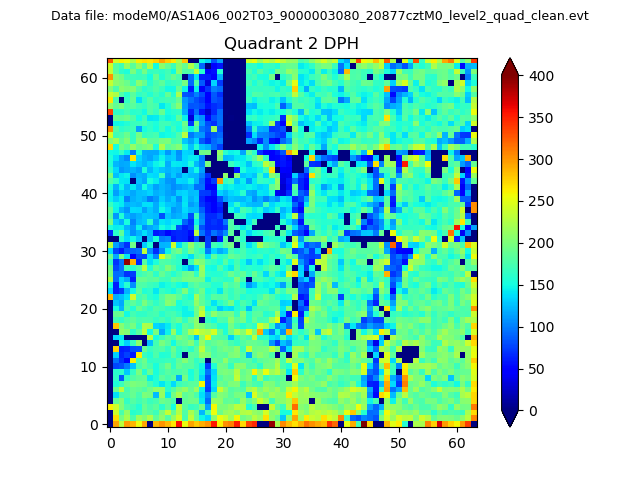 |
Quadrant C |
| Plot type | Count rate plots | Images |
|---|---|---|
| Comparison with Poisson distribution Blue bars denote a histogram of data divided into 1 sec bins. Red curve is a Poisson curve with rate = median count rate of data. |
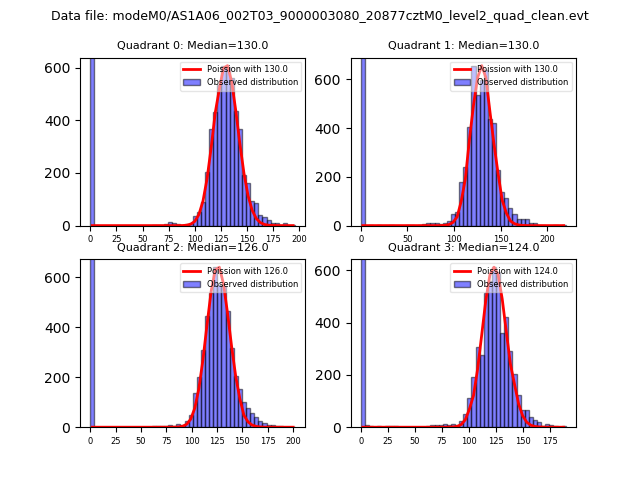 |
 |
| Quadrant-wise count rates Data is divided into 100 sec bins |
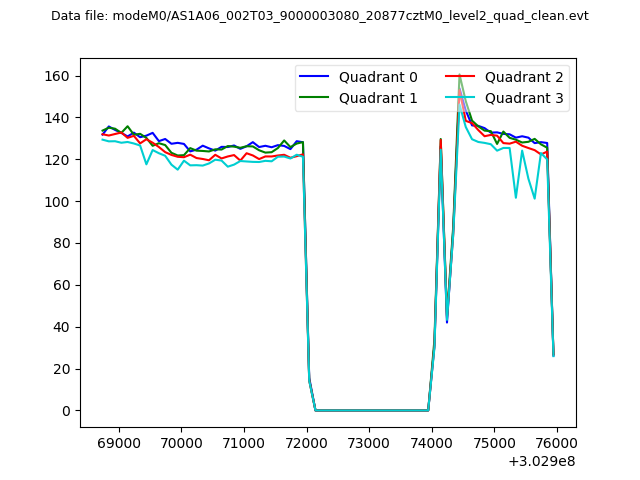 |
|
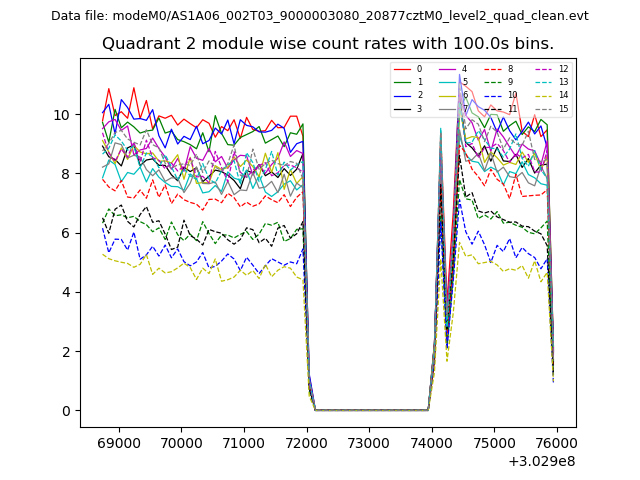
| Module-wise count rates for Quadrant A Data is divided into 100 sec bins |
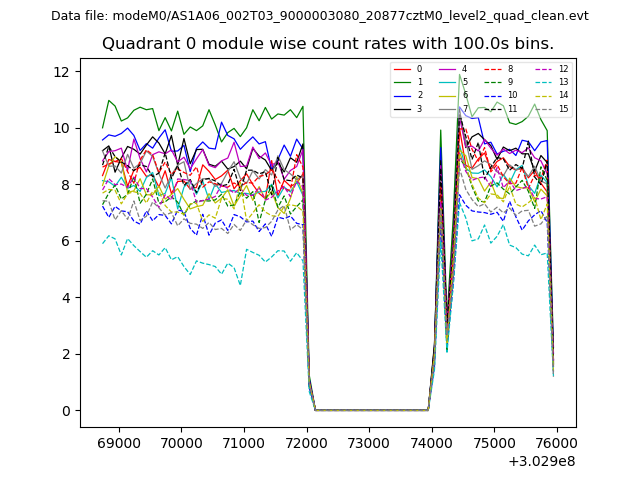 |
 |
| Module-wise count rates for Quadrant B Data is divided into 100 sec bins |
 |
 |
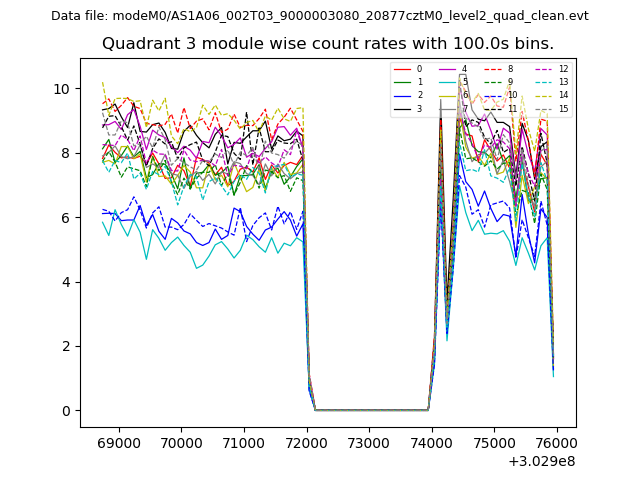
| Module-wise count rates for Quadrant C Data is divided into 100 sec bins |
 |
 |
| Module-wise count rates for Quadrant D Data is divided into 100 sec bins |
 |
 |
| Parameter | Plot |
|---|---|
| CZT HV Monitor | 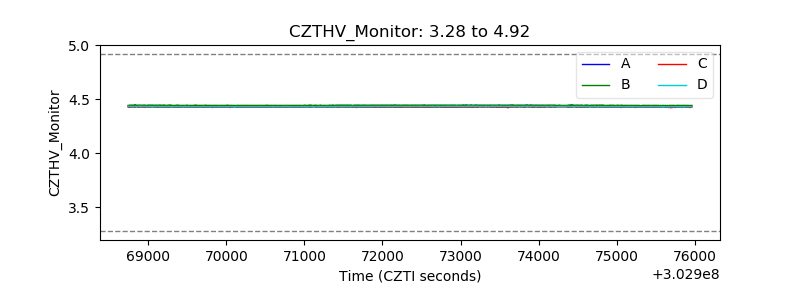 |
| D_VDD | 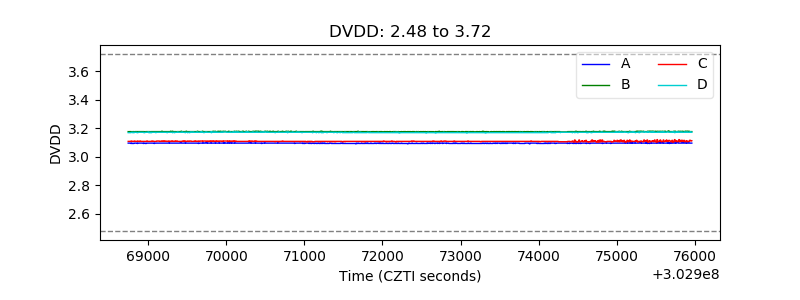 |
| Temperature 1 |  |
| Veto HV Monitor | 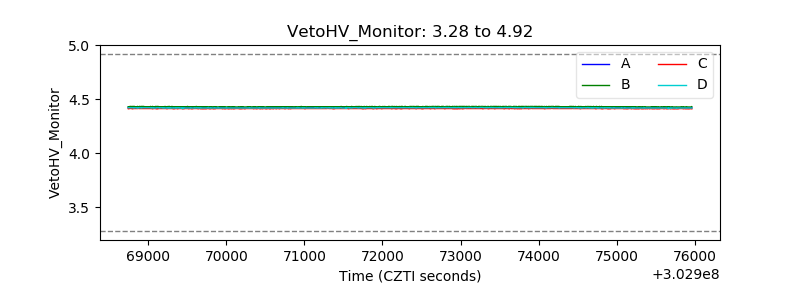 |
| Veto LLD | 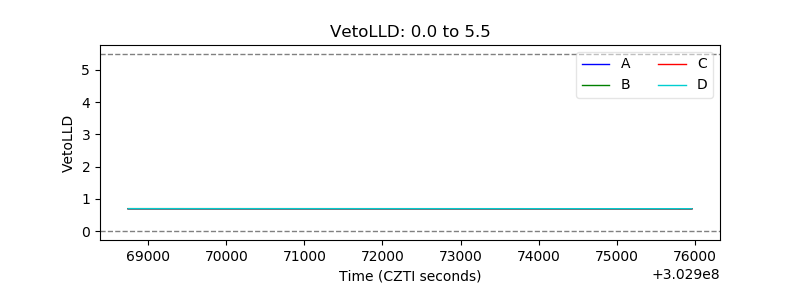 |
| Alpha Counter | 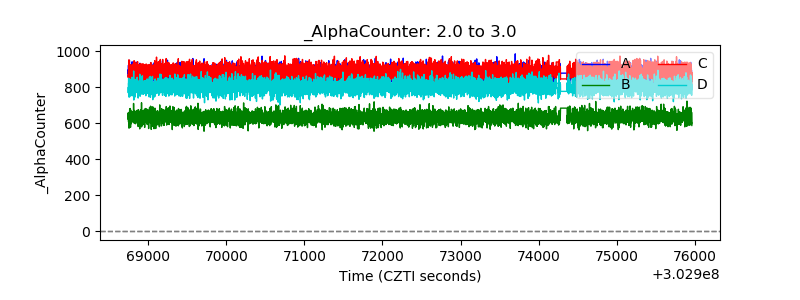 |
| _CPM_Rate | 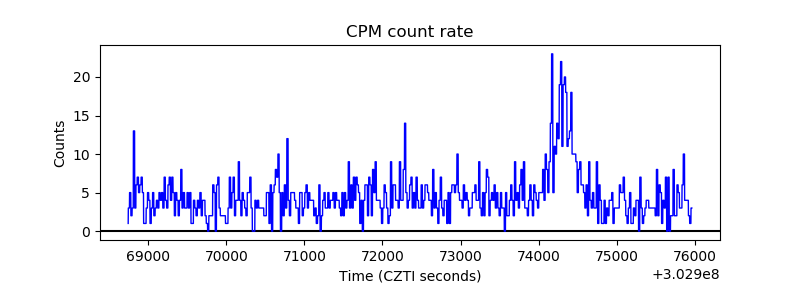 |
| CZT Counter |  |
| +2.5 Volts monitor | 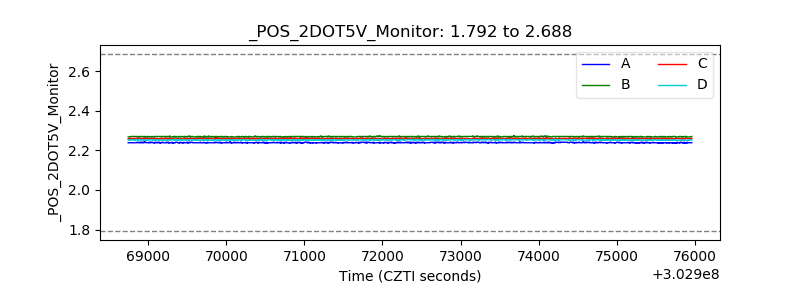 |
| +5 Volts monitor |  |
| _ROLL_ROT | 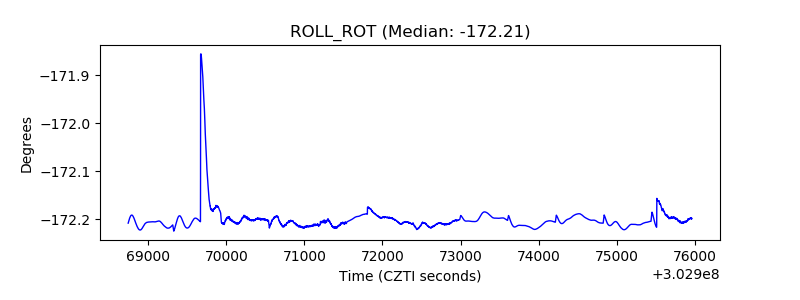 |
| _Roll_DEC | 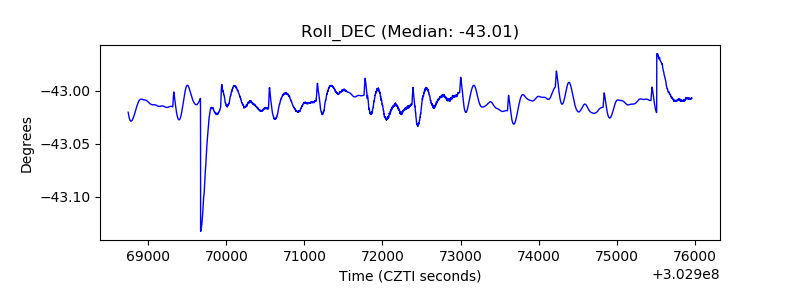 |
| _Roll_RA | 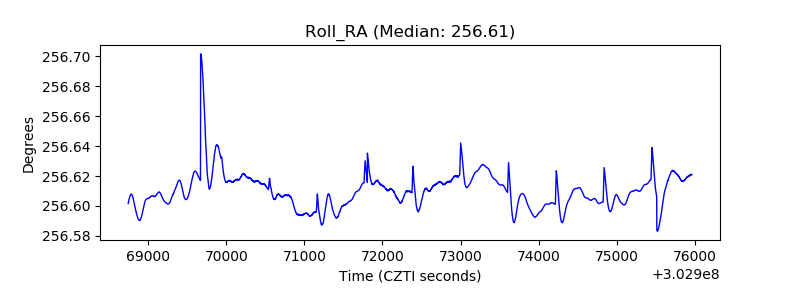 |
| Veto Counter | 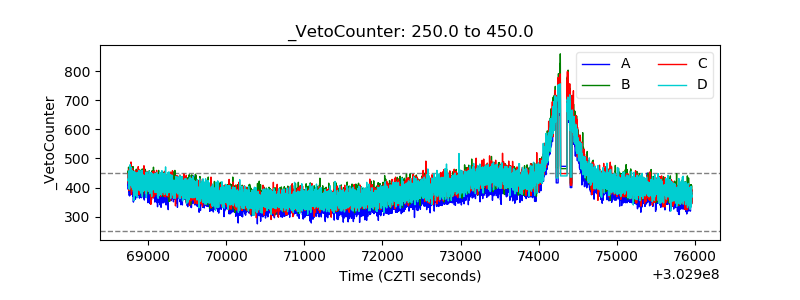 |