| Param | Original file | Final file |
|---|---|---|
| Filename | modeM0/AS1A06_002T03_9000003080_20878cztM0_level2.evt | modeM0/AS1A06_002T03_9000003080_20878cztM0_level2_quad_clean.evt |
| Size (bytes) | 518,739,840 | 102,291,840 |
| Size | 494.7 MB | 97.6 MB |
| Events in quadrant A | 3,374,936 | 666,812 |
| Events in quadrant B | 3,857,761 | 663,000 |
| Events in quadrant C | 3,411,556 | 646,123 |
| Events in quadrant D | 4,573,327 | 616,786 |
| Mode M9 | |||
|---|---|---|---|
| Quadrant | BADHDUFLAG | Total packets | Discarded packets |
| A | 0 | 4 | 0 |
| B | 0 | 4 | 0 |
| C | 0 | 4 | 0 |
| D | 0 | 4 | 0 |
| Mode M0 | |||
|---|---|---|---|
| Quadrant | BADHDUFLAG | Total packets | Discarded packets |
| A | 0 | 14804 | 1 |
| B | 0 | 16047 | 1 |
| C | 0 | 14903 | 1 |
| D | 0 | 18360 | 3 |
| Mode SS | |||
|---|---|---|---|
| Quadrant | BADHDUFLAG | Total packets | Discarded packets |
| A | 0 | 148 | 0 |
| B | 0 | 148 | 0 |
| C | 0 | 148 | 0 |
| D | 0 | 148 | 0 |
| Quadrant | Total seconds | Saturated seconds | Saturation percentage |
|---|---|---|---|
| A | 7252 | 33 | 0.455047% |
| B | 7253 | 67 | 0.923756% |
| C | 7253 | 66 | 0.909968% |
| D | 7252 | 248 | 3.419746% |
Noise dominated data is calculated using 1-second bins in cleaned event files. If a bin has >2000 counts, and if more than 50% of those come from <1% of pixels, then it is considered to be noise-dominated and hence unusable.
| Quadrant | # 1 sec bins | Bins with >0 counts | Bins with >2000 counts | High rate bins dominated by noise | Noise dominated (total time) | Noise dominated (detector-on time) | Marked lightcurve |
|---|---|---|---|---|---|---|---|
| A | 7642 | 7253 | 0 | 0 | 0.00% | 0.00% | 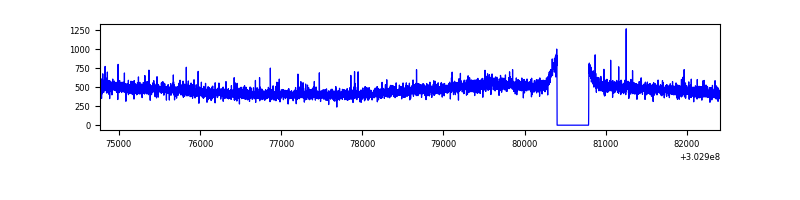 |
| B | 7643 | 7254 | 7 | 7 | 0.09% | 0.10% | 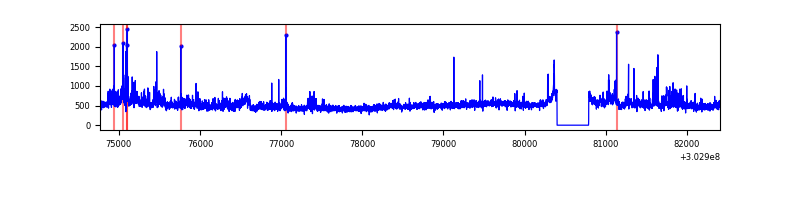 |
| C | 7643 | 7254 | 9 | 9 | 0.12% | 0.12% | 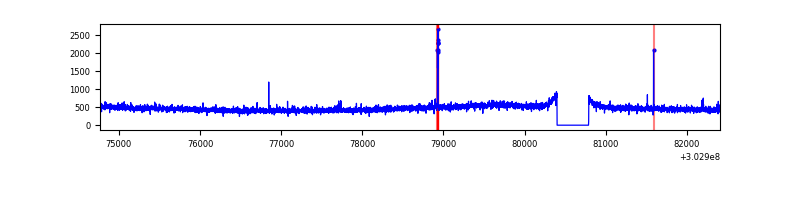 |
| D | 7642 | 7253 | 209 | 209 | 2.73% | 2.88% | 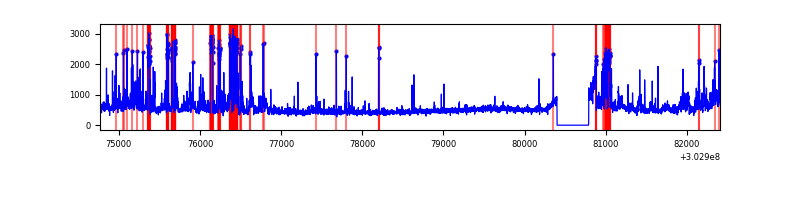 |
Top three noisy pixels from each quadrant. If the there are fewer than three noisy pixels in the level2.evt file, extra rows are filled as -1
| Pixel properties | Quadrant properties | ||||||
|---|---|---|---|---|---|---|---|
| Quadrant | DetID | PixID | Counts | Sigma | Mean | Median | Sigma |
| A | 0 | 226 | 7469 | 37.04 | 877 | 859 | 178.5 |
| A | 3 | 137 | 6997 | 34.39 | 877 | 859 | 178.5 |
| A | 5 | 98 | 6481 | 31.5 | 877 | 859 | 178.5 |
| B | 0 | 189 | 145597 | 864.11 | 867 | 847 | 167.5 |
| B | 0 | 197 | 83478 | 493.28 | 867 | 847 | 167.5 |
| B | 7 | 220 | 57246 | 336.68 | 867 | 847 | 167.5 |
| C | 14 | 238 | 128585 | 656.28 | 827 | 833 | 194.7 |
| C | 9 | 54 | 37212 | 186.88 | 827 | 833 | 194.7 |
| C | 8 | 128 | 10570 | 50.02 | 827 | 833 | 194.7 |
| D | 1 | 52 | 646616 | 3198.65 | 831 | 809 | 201.9 |
| D | 1 | 20 | 263022 | 1298.73 | 831 | 809 | 201.9 |
| D | 1 | 239 | 230439 | 1137.35 | 831 | 809 | 201.9 |
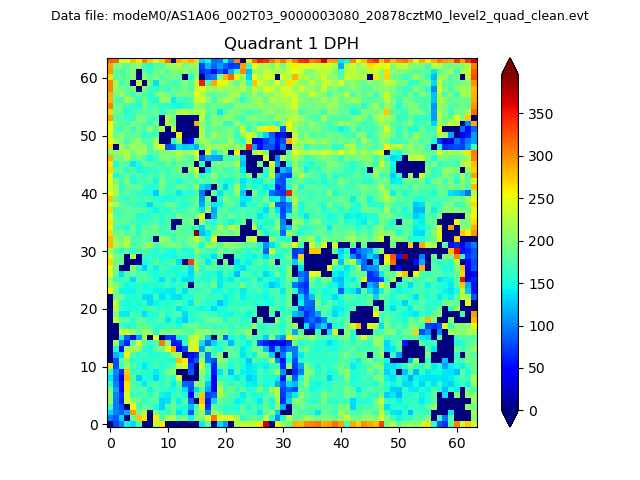
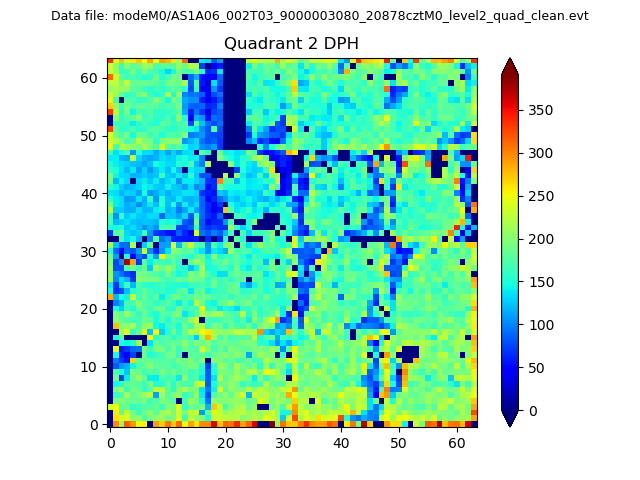
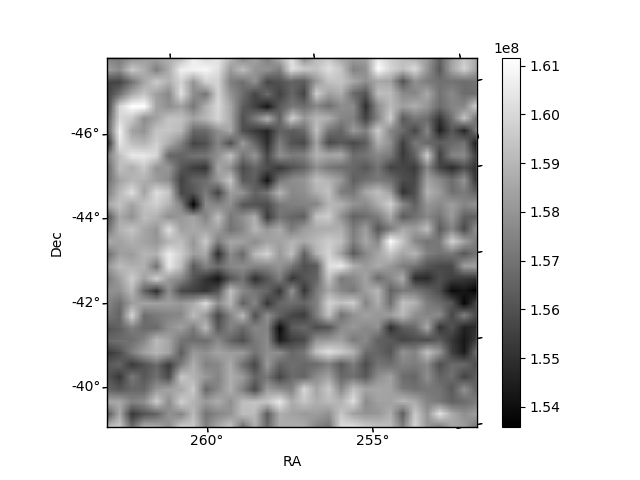
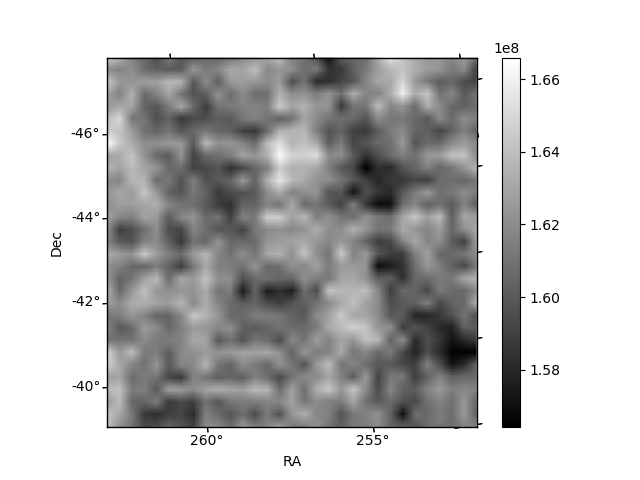
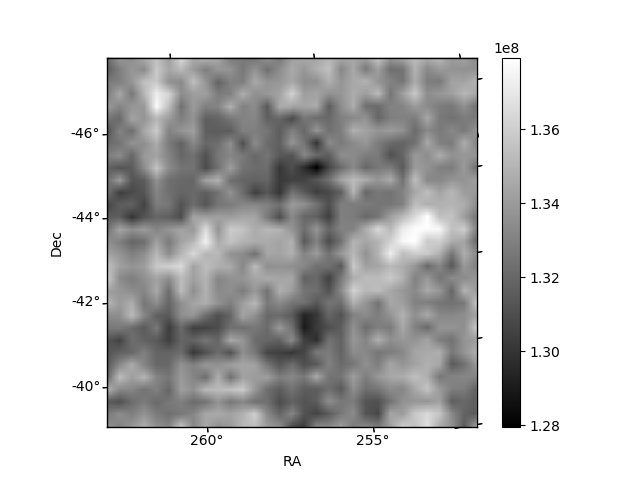
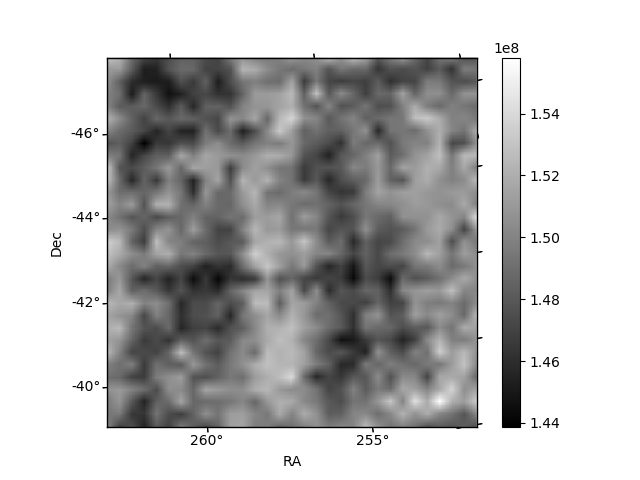
Histogram calculated using DETX and DETY for each event in the final _common_clean file
| Quadrant A |  |
 |
Quadrant B |
|---|---|---|---|
| Quadrant D |  |
 |
Quadrant C |
| Plot type | Count rate plots | Images |
|---|---|---|
| Comparison with Poisson distribution Blue bars denote a histogram of data divided into 1 sec bins. Red curve is a Poisson curve with rate = median count rate of data. |
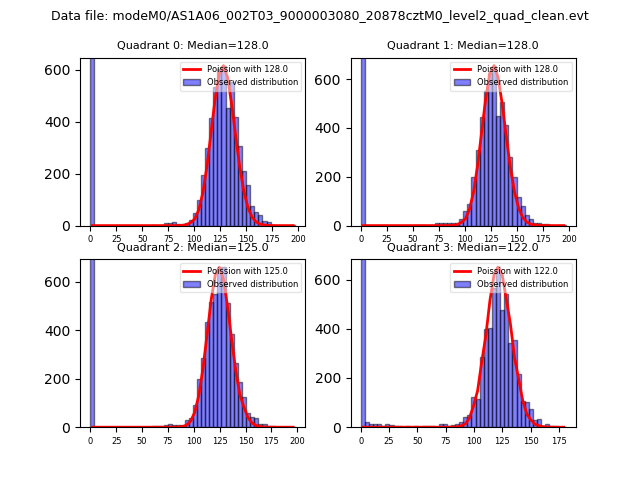 |
 |
| Quadrant-wise count rates Data is divided into 100 sec bins |
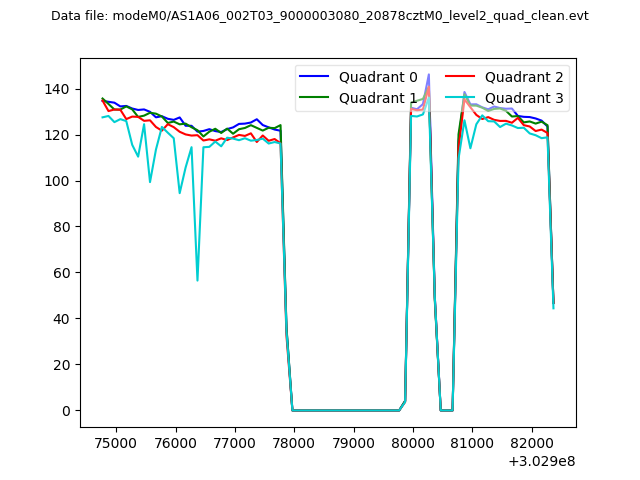 |
|
| Module-wise count rates for Quadrant A Data is divided into 100 sec bins |
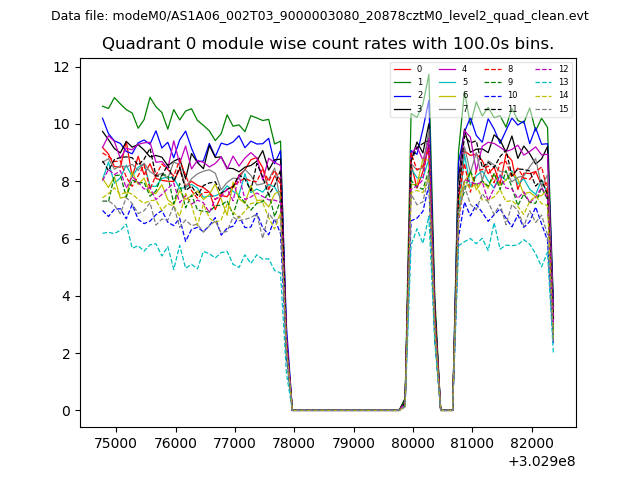 |
 |
| Module-wise count rates for Quadrant B Data is divided into 100 sec bins |
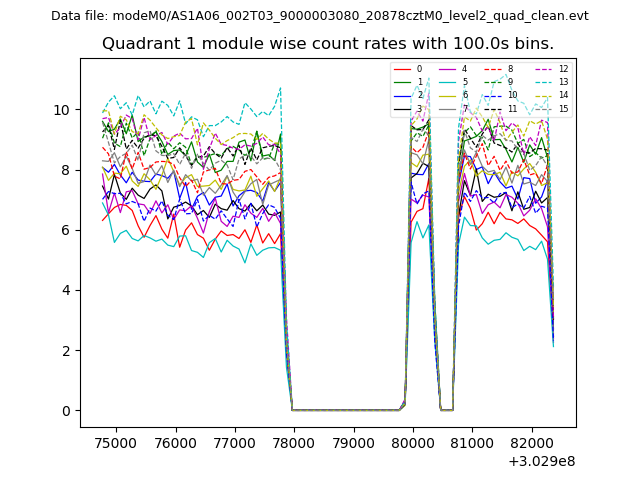 |
 |
| Module-wise count rates for Quadrant C Data is divided into 100 sec bins |
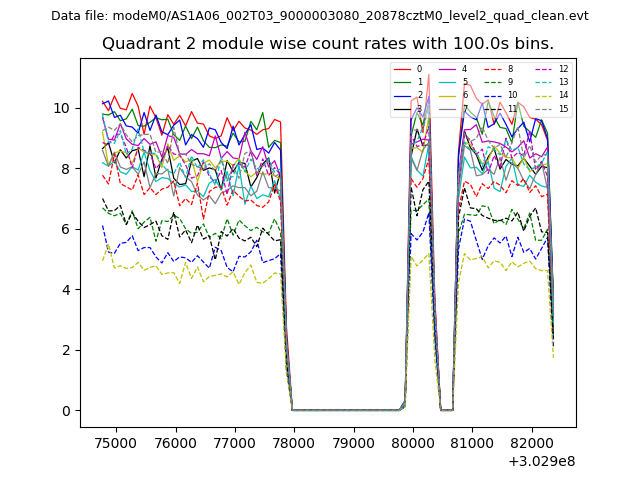 |
 |
| Module-wise count rates for Quadrant D Data is divided into 100 sec bins |
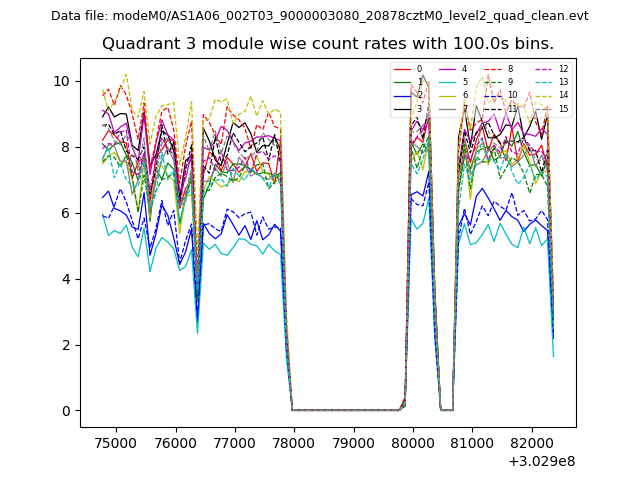 |
 |
| Parameter | Plot |
|---|---|
| CZT HV Monitor |  |
| D_VDD | 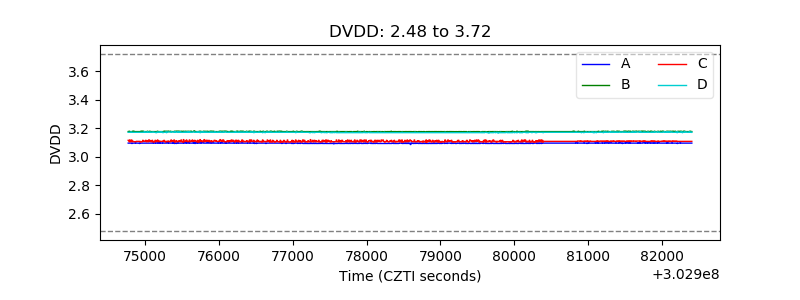 |
| Temperature 1 | 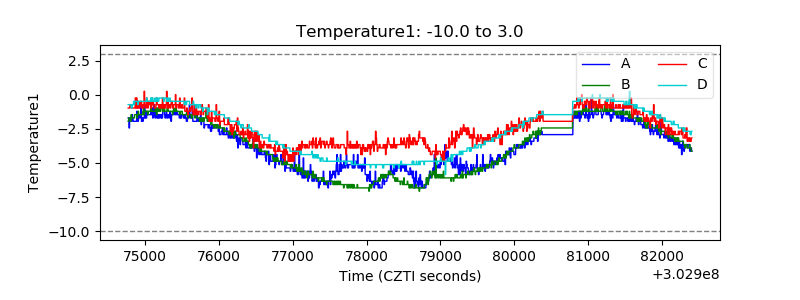 |
| Veto HV Monitor | 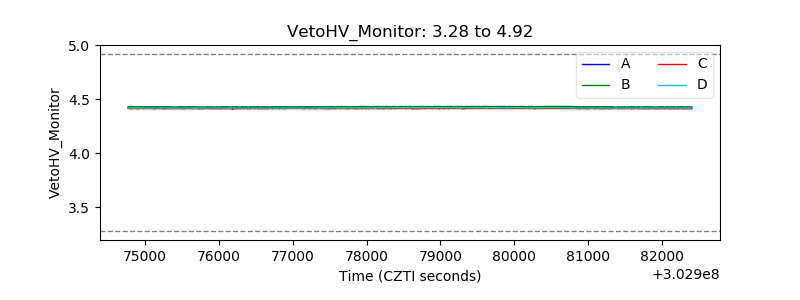 |
| Veto LLD | 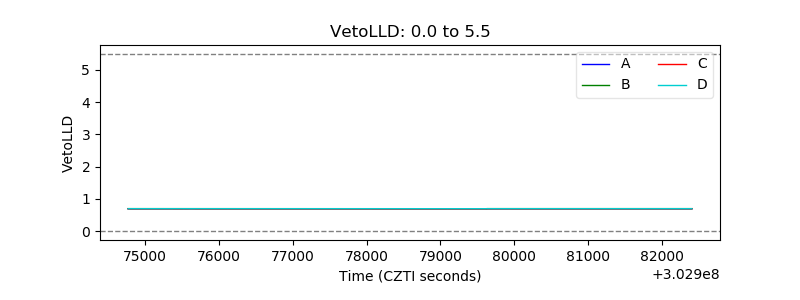 |
| Alpha Counter | 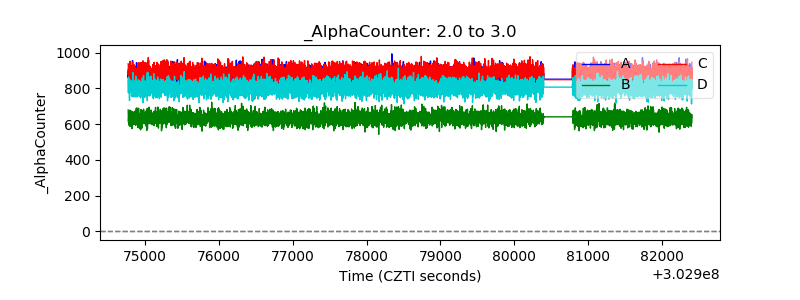 |
| _CPM_Rate | 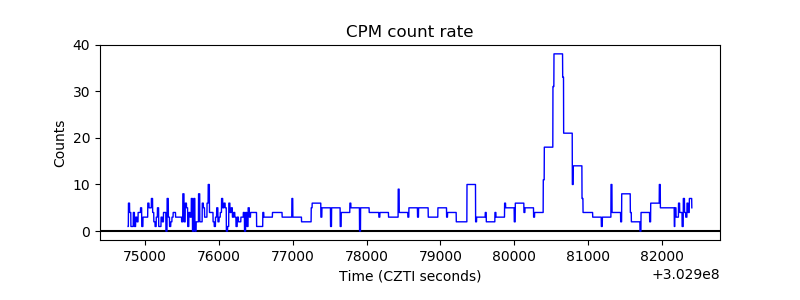 |
| CZT Counter | 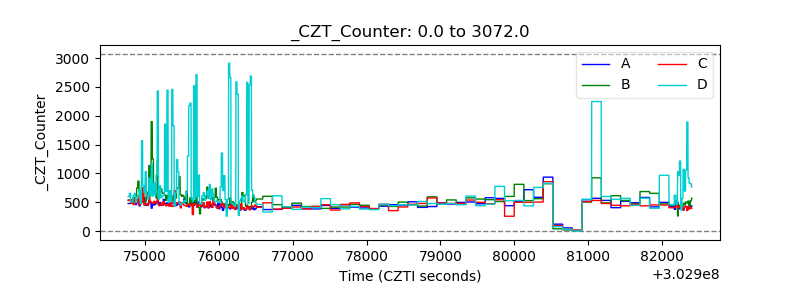 |
| +2.5 Volts monitor |  |
| +5 Volts monitor | 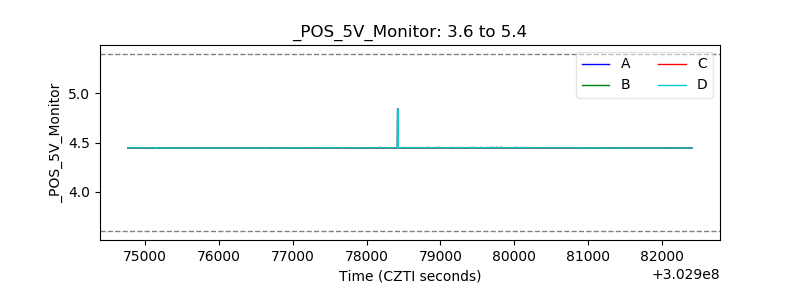 |
| _ROLL_ROT | 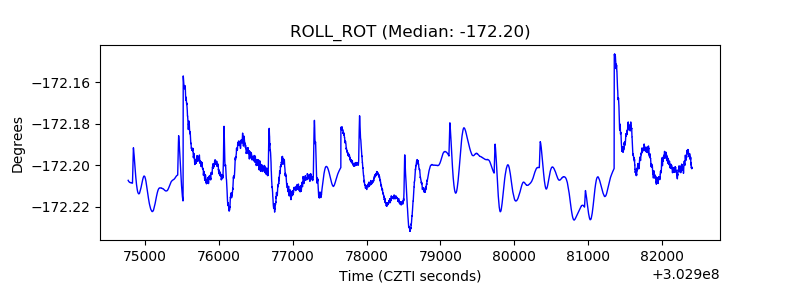 |
| _Roll_DEC | 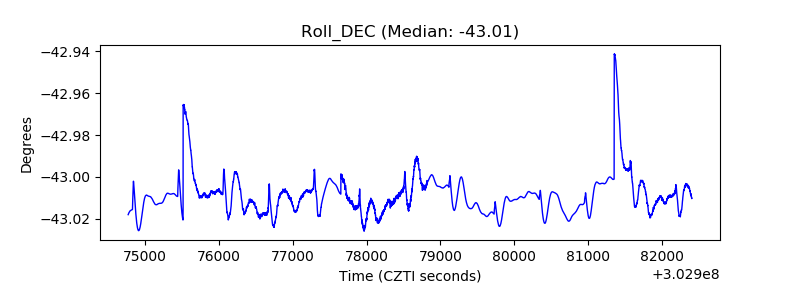 |
| _Roll_RA | 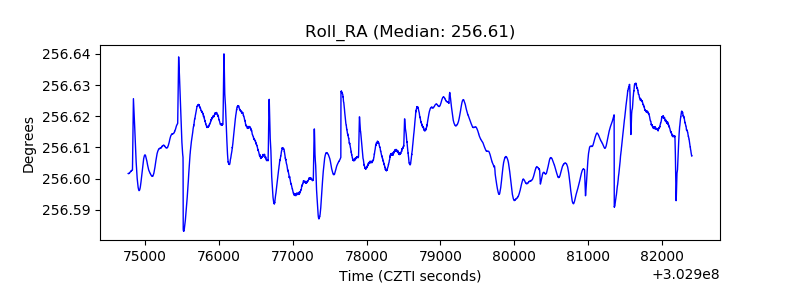 |
| Veto Counter | 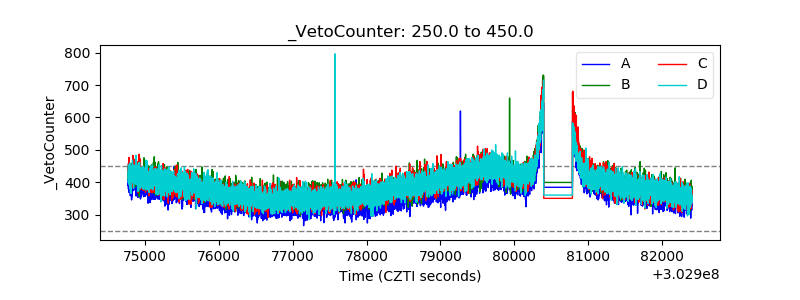 |