| Param | Original file | Final file |
|---|---|---|
| Filename | modeM0/AS1A06_002T03_9000003080_20880cztM0_level2.evt | modeM0/AS1A06_002T03_9000003080_20880cztM0_level2_quad_clean.evt |
| Size (bytes) | 878,256,000 | 173,989,440 |
| Size | 837.6 MB | 165.9 MB |
| Events in quadrant A | 5,940,435 | 1,122,666 |
| Events in quadrant B | 6,596,121 | 1,116,867 |
| Events in quadrant C | 6,072,215 | 1,084,846 |
| Events in quadrant D | 7,123,471 | 1,061,459 |
| Mode M9 | |||
|---|---|---|---|
| Quadrant | BADHDUFLAG | Total packets | Discarded packets |
| A | 0 | 14 | 0 |
| B | 0 | 14 | 0 |
| C | 0 | 14 | 0 |
| D | 0 | 14 | 0 |
| Mode M0 | |||
|---|---|---|---|
| Quadrant | BADHDUFLAG | Total packets | Discarded packets |
| A | 0 | 26181 | 2 |
| B | 0 | 27894 | 2 |
| C | 0 | 26484 | 2 |
| D | 0 | 29781 | 2 |
| Mode SS | |||
|---|---|---|---|
| Quadrant | BADHDUFLAG | Total packets | Discarded packets |
| A | 0 | 256 | 0 |
| B | 0 | 256 | 0 |
| C | 0 | 256 | 0 |
| D | 0 | 256 | 0 |
| Quadrant | Total seconds | Saturated seconds | Saturation percentage |
|---|---|---|---|
| A | 12801 | 60 | 0.468713% |
| B | 12802 | 92 | 0.718638% |
| C | 12802 | 131 | 1.023278% |
| D | 12802 | 106 | 0.827996% |
Noise dominated data is calculated using 1-second bins in cleaned event files. If a bin has >2000 counts, and if more than 50% of those come from <1% of pixels, then it is considered to be noise-dominated and hence unusable.
| Quadrant | # 1 sec bins | Bins with >0 counts | Bins with >2000 counts | High rate bins dominated by noise | Noise dominated (total time) | Noise dominated (detector-on time) | Marked lightcurve |
|---|---|---|---|---|---|---|---|
| A | 14061 | 12801 | 9 | 9 | 0.06% | 0.07% | 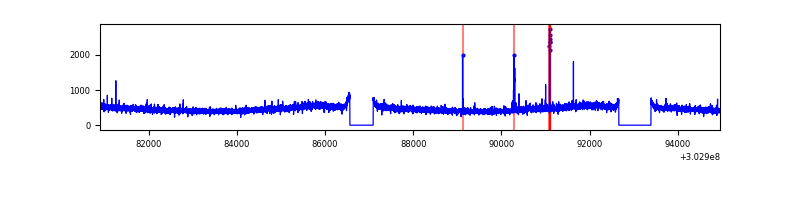 |
| B | 14062 | 12802 | 21 | 21 | 0.15% | 0.16% | 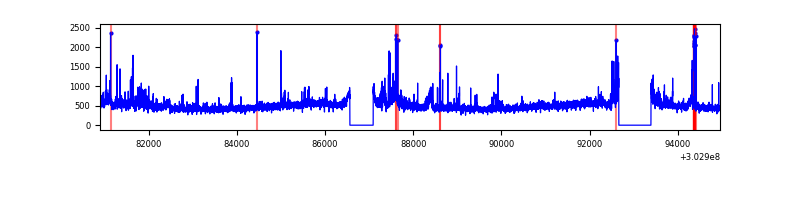 |
| C | 14062 | 12804 | 19 | 19 | 0.14% | 0.15% | 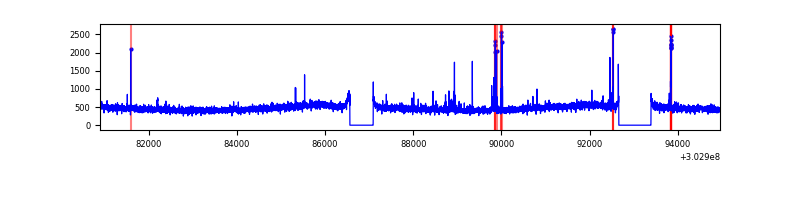 |
| D | 14062 | 12804 | 73 | 73 | 0.52% | 0.57% | 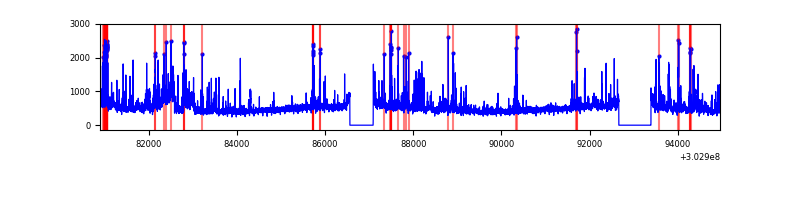 |
Top three noisy pixels from each quadrant. If the there are fewer than three noisy pixels in the level2.evt file, extra rows are filled as -1
| Pixel properties | Quadrant properties | ||||||
|---|---|---|---|---|---|---|---|
| Quadrant | DetID | PixID | Counts | Sigma | Mean | Median | Sigma |
| A | 12 | 96 | 51303 | 160.72 | 1529 | 1495 | 309.9 |
| A | 0 | 226 | 13133 | 37.55 | 1529 | 1495 | 309.9 |
| A | 3 | 137 | 12513 | 35.55 | 1529 | 1495 | 309.9 |
| B | 0 | 197 | 178890 | 612.58 | 1521 | 1482 | 289.6 |
| B | 0 | 189 | 177984 | 609.45 | 1521 | 1482 | 289.6 |
| B | 7 | 220 | 51324 | 172.1 | 1521 | 1482 | 289.6 |
| C | 14 | 238 | 228040 | 666.75 | 1453 | 1458 | 339.8 |
| C | 9 | 54 | 154741 | 451.05 | 1453 | 1458 | 339.8 |
| C | 10 | 91 | 12565 | 32.68 | 1453 | 1458 | 339.8 |
| D | 1 | 52 | 509914 | 1427.84 | 1472 | 1427 | 356.1 |
| D | 1 | 239 | 291889 | 815.62 | 1472 | 1427 | 356.1 |
| D | 1 | 20 | 274914 | 767.96 | 1472 | 1427 | 356.1 |
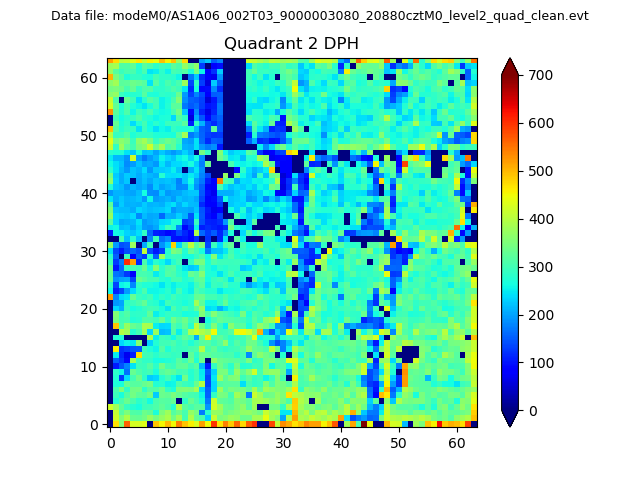
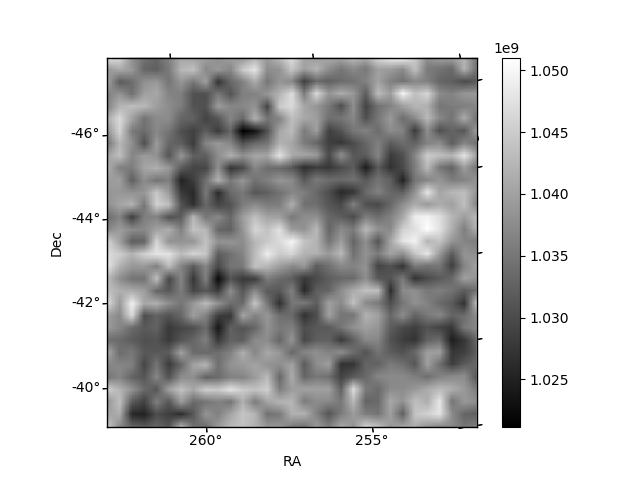
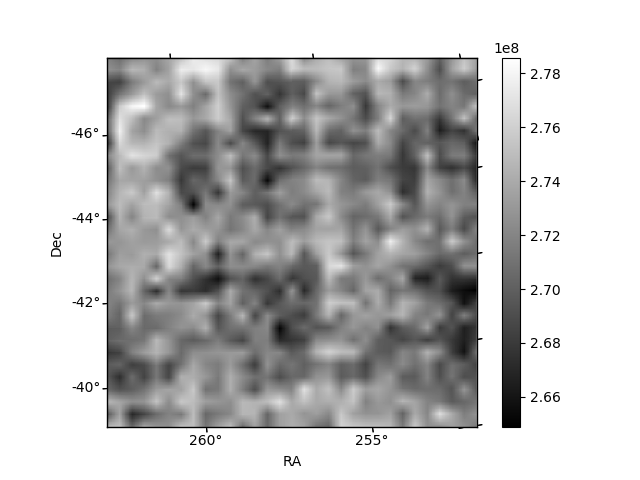
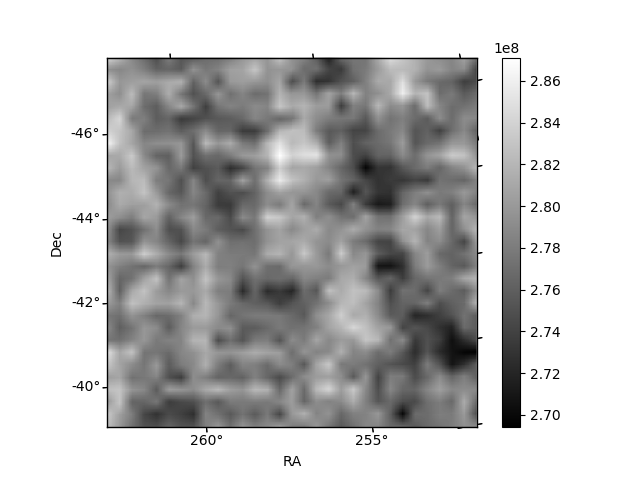
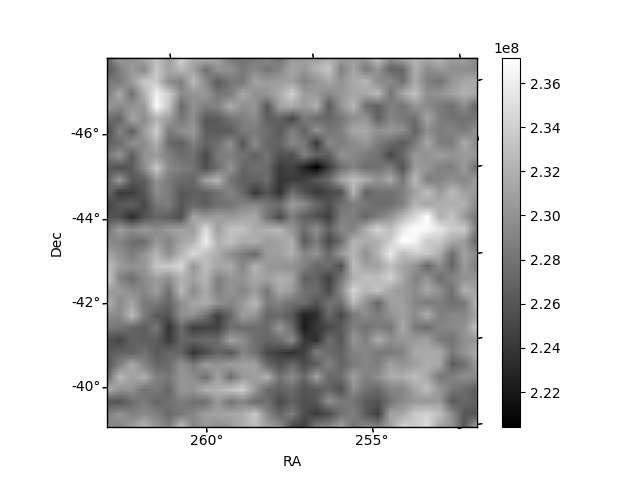
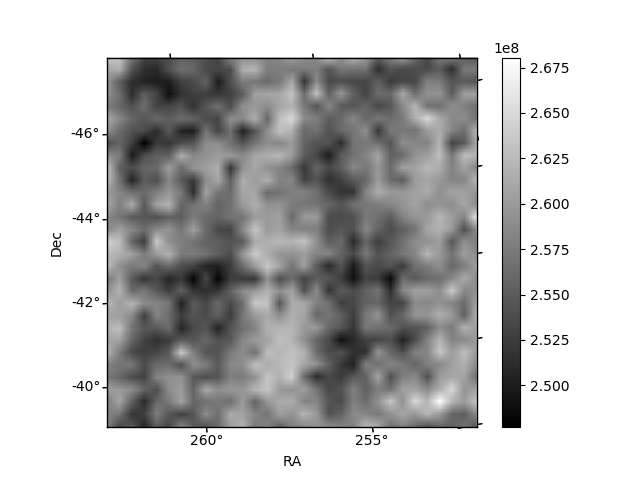
Histogram calculated using DETX and DETY for each event in the final _common_clean file
| Quadrant A | 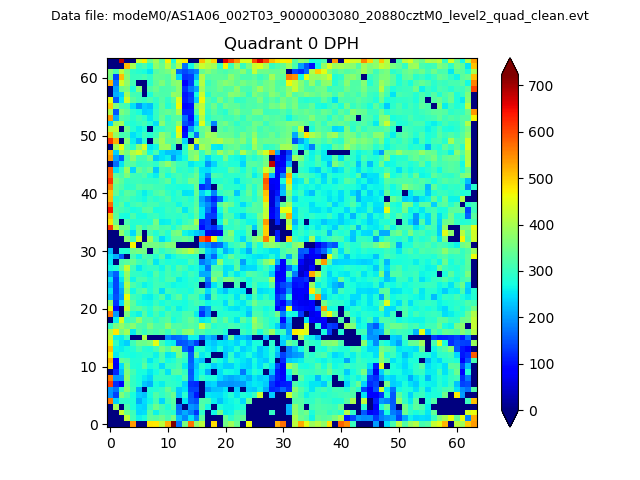 |
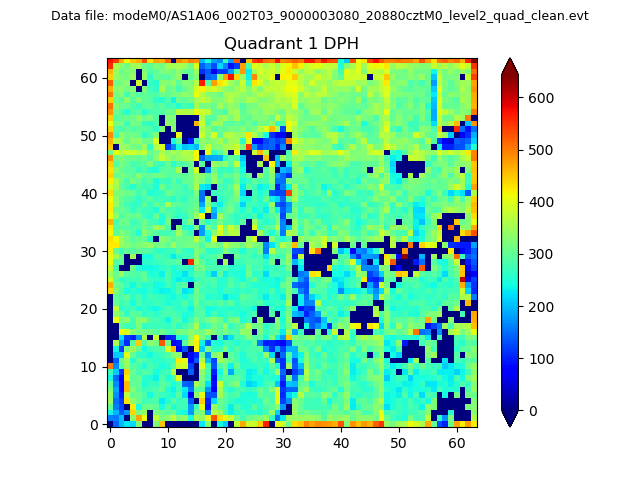 |
Quadrant B |
|---|---|---|---|
| Quadrant D | 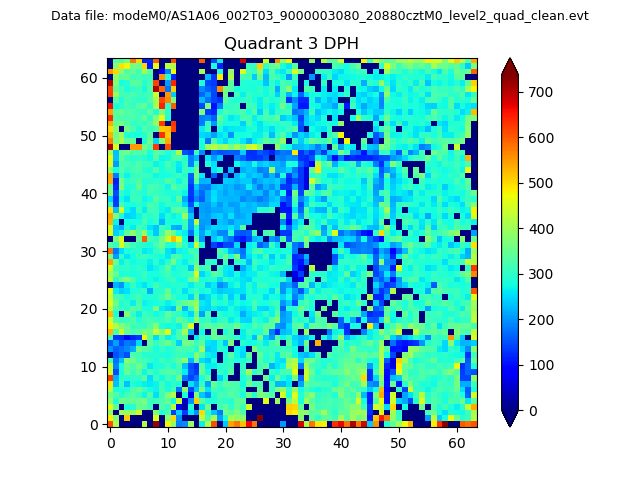 |
 |
Quadrant C |
| Plot type | Count rate plots | Images |
|---|---|---|
| Comparison with Poisson distribution Blue bars denote a histogram of data divided into 1 sec bins. Red curve is a Poisson curve with rate = median count rate of data. |
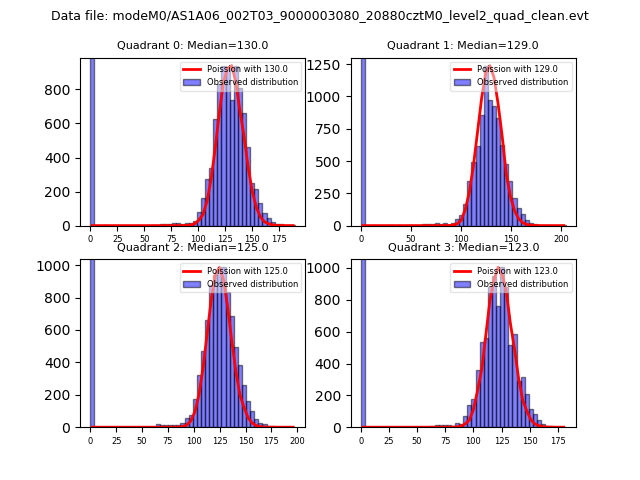 |
 |
| Quadrant-wise count rates Data is divided into 100 sec bins |
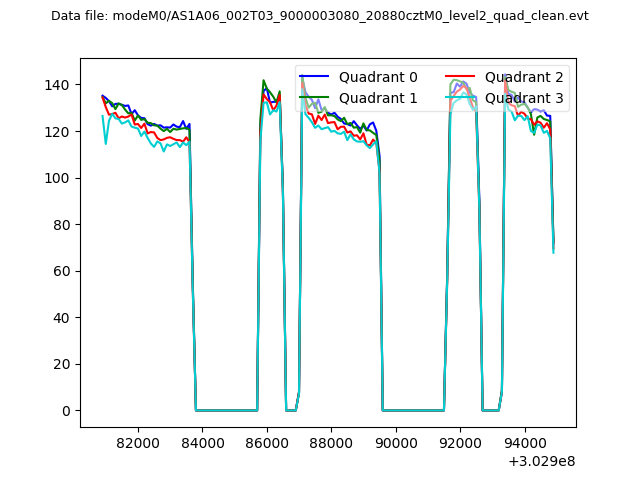 |
|
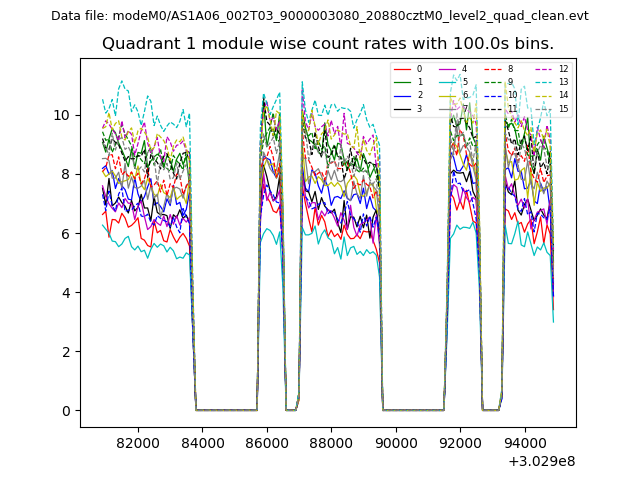
| Module-wise count rates for Quadrant A Data is divided into 100 sec bins |
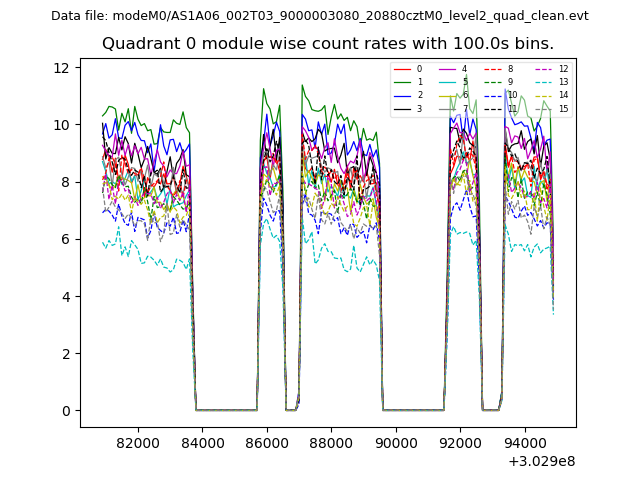 |
 |
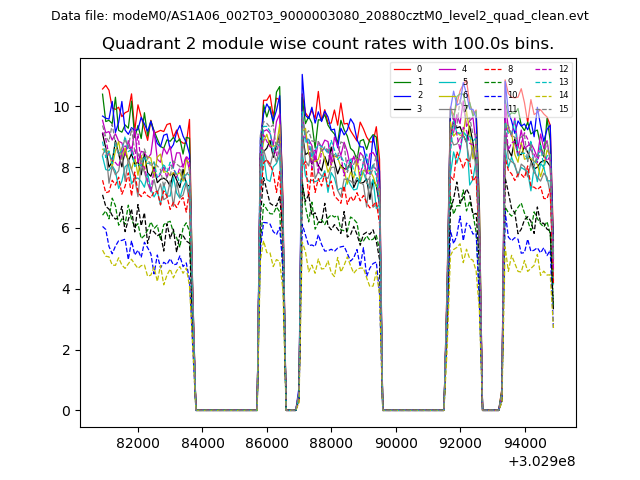
| Module-wise count rates for Quadrant B Data is divided into 100 sec bins |
 |
 |
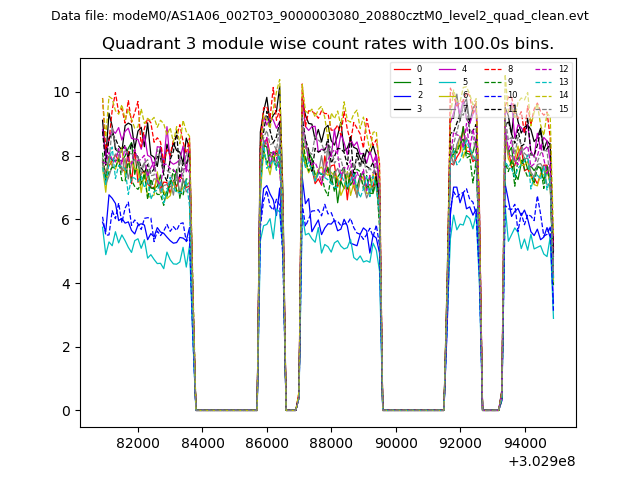
| Module-wise count rates for Quadrant C Data is divided into 100 sec bins |
 |
 |
| Module-wise count rates for Quadrant D Data is divided into 100 sec bins |
 |
 |
| Parameter | Plot |
|---|---|
| CZT HV Monitor | 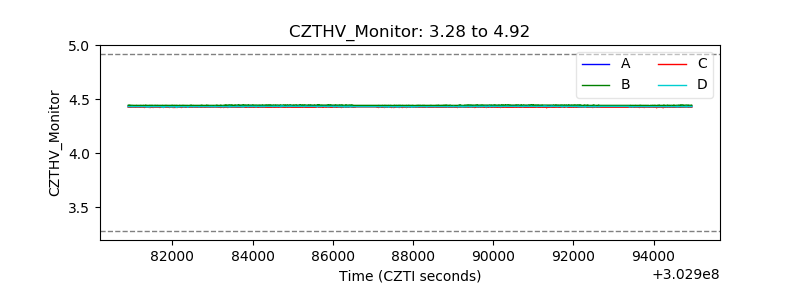 |
| D_VDD | 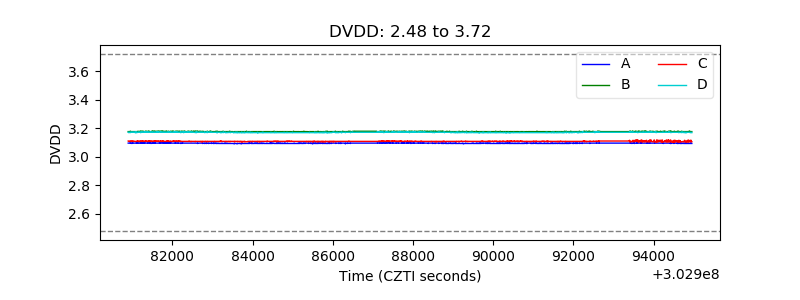 |
| Temperature 1 | 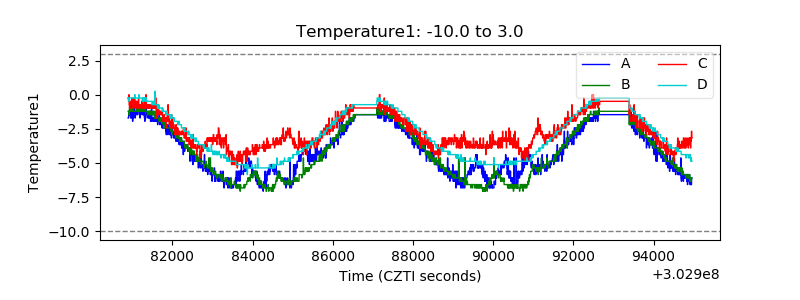 |
| Veto HV Monitor | 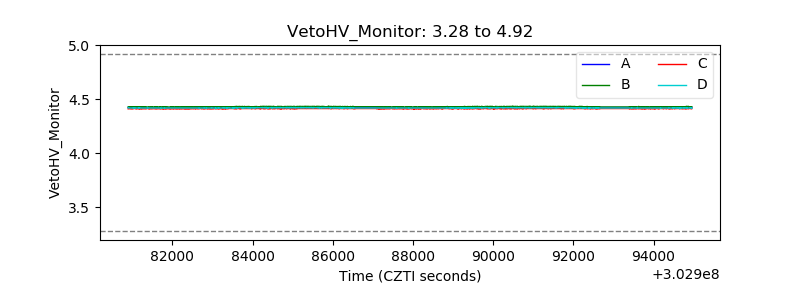 |
| Veto LLD |  |
| Alpha Counter | 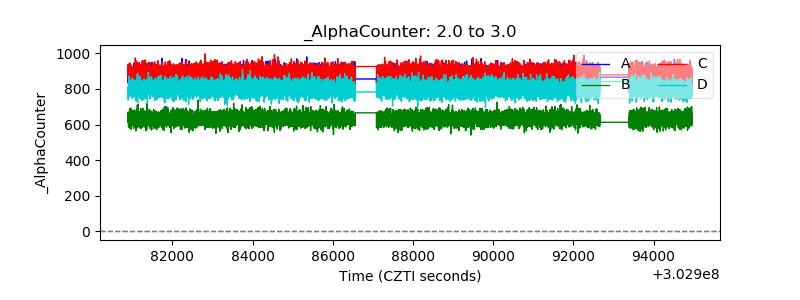 |
| _CPM_Rate | 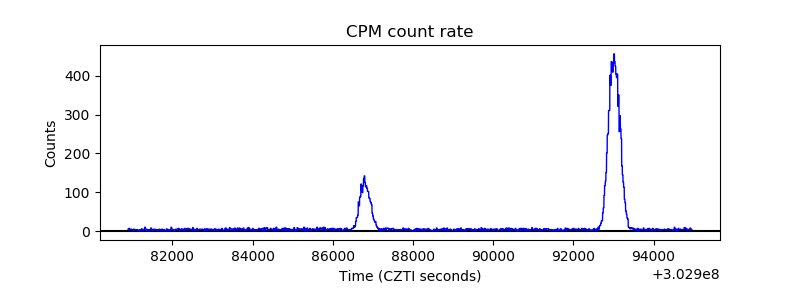 |
| CZT Counter | 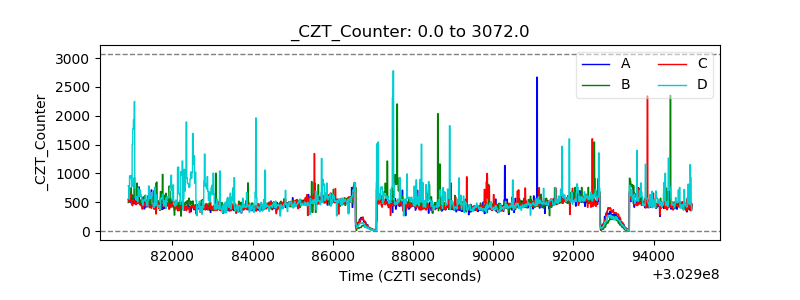 |
| +2.5 Volts monitor |  |
| +5 Volts monitor |  |
| _ROLL_ROT |  |
| _Roll_DEC | 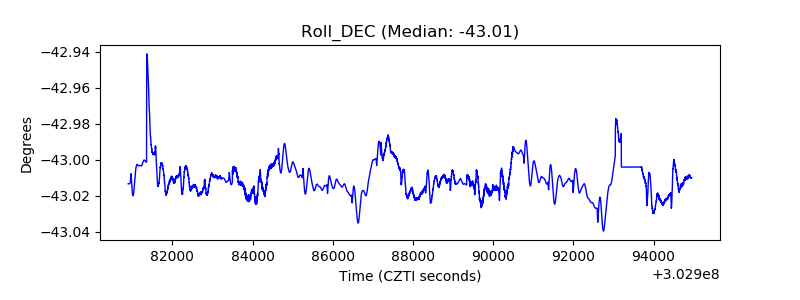 |
| _Roll_RA | 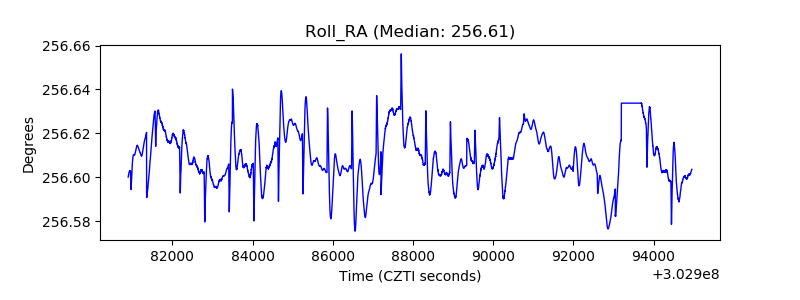 |
| Veto Counter | 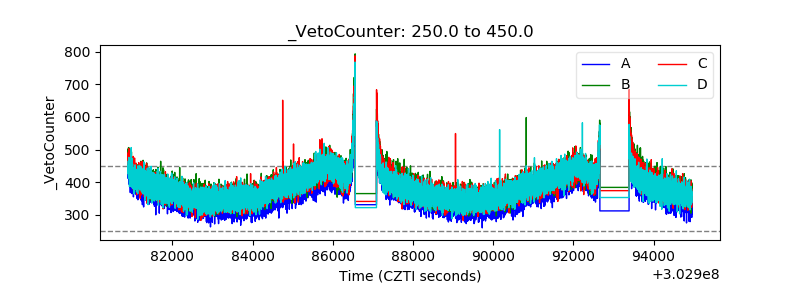 |