| Param | Original file | Final file |
|---|---|---|
| Filename | modeM0/AS1A06_002T03_9000003080_20882cztM0_level2.evt | modeM0/AS1A06_002T03_9000003080_20882cztM0_level2_quad_clean.evt |
| Size (bytes) | 447,287,040 | 88,456,320 |
| Size | 426.6 MB | 84.4 MB |
| Events in quadrant A | 2,974,812 | 573,816 |
| Events in quadrant B | 3,349,451 | 576,300 |
| Events in quadrant C | 3,027,423 | 560,330 |
| Events in quadrant D | 3,766,341 | 528,825 |
| Mode M9 | |||
|---|---|---|---|
| Quadrant | BADHDUFLAG | Total packets | Discarded packets |
| A | 0 | 20 | 0 |
| B | 0 | 20 | 0 |
| C | 0 | 20 | 0 |
| D | 0 | 20 | 0 |
| Mode M0 | |||
|---|---|---|---|
| Quadrant | BADHDUFLAG | Total packets | Discarded packets |
| A | 0 | 13524 | 594 |
| B | 0 | 14708 | 737 |
| C | 0 | 13549 | 606 |
| D | 0 | 16525 | 929 |
| Mode SS | |||
|---|---|---|---|
| Quadrant | BADHDUFLAG | Total packets | Discarded packets |
| A | 0 | 136 | 6 |
| B | 0 | 136 | 6 |
| C | 0 | 136 | 8 |
| D | 0 | 136 | 6 |
| Quadrant | Total seconds | Saturated seconds | Saturation percentage |
|---|---|---|---|
| A | 6302 | 28 | 0.444303% |
| B | 6302 | 99 | 1.570930% |
| C | 6298 | 65 | 1.032074% |
| D | 6279 | 288 | 4.586718% |
Noise dominated data is calculated using 1-second bins in cleaned event files. If a bin has >2000 counts, and if more than 50% of those come from <1% of pixels, then it is considered to be noise-dominated and hence unusable.
| Quadrant | # 1 sec bins | Bins with >0 counts | Bins with >2000 counts | High rate bins dominated by noise | Noise dominated (total time) | Noise dominated (detector-on time) | Marked lightcurve |
|---|---|---|---|---|---|---|---|
| A | 8484 | 6358 | 0 | 0 | 0.00% | 0.00% | 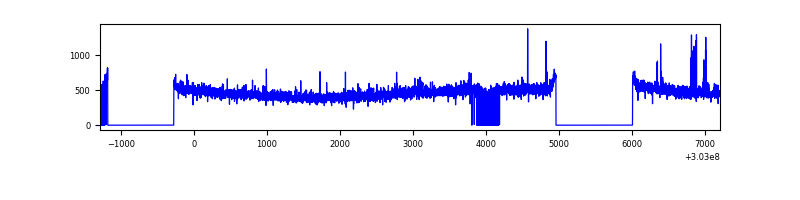 |
| B | 8483 | 6357 | 17 | 17 | 0.20% | 0.27% | 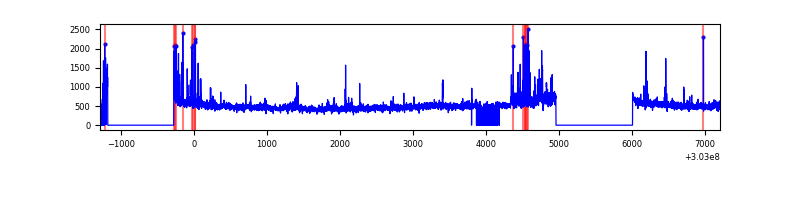 |
| C | 8500 | 6360 | 2 | 2 | 0.02% | 0.03% | 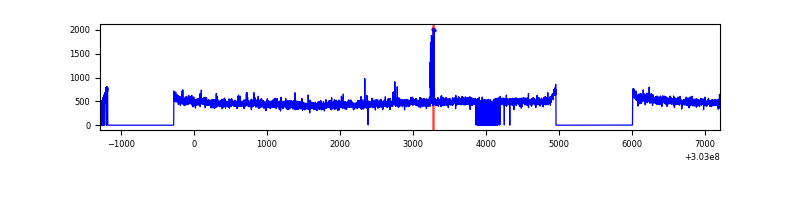 |
| D | 8493 | 6333 | 237 | 237 | 2.79% | 3.74% | 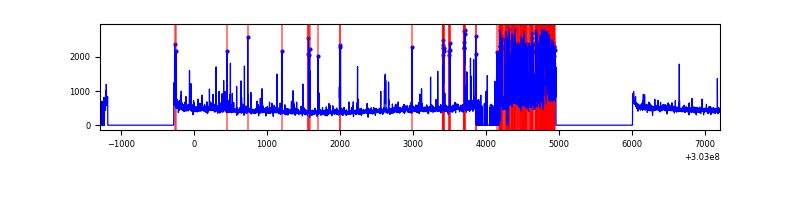 |
Top three noisy pixels from each quadrant. If the there are fewer than three noisy pixels in the level2.evt file, extra rows are filled as -1
| Pixel properties | Quadrant properties | ||||||
|---|---|---|---|---|---|---|---|
| Quadrant | DetID | PixID | Counts | Sigma | Mean | Median | Sigma |
| A | 6 | 16 | 22886 | 143.1 | 762 | 747 | 154.7 |
| A | 12 | 96 | 20766 | 129.4 | 762 | 747 | 154.7 |
| A | 0 | 226 | 6432 | 36.75 | 762 | 747 | 154.7 |
| B | 7 | 220 | 139250 | 954.05 | 763 | 745 | 145.2 |
| B | 0 | 189 | 75124 | 512.34 | 763 | 745 | 145.2 |
| B | 0 | 197 | 49250 | 334.11 | 763 | 745 | 145.2 |
| C | 14 | 238 | 116995 | 674.54 | 731 | 736 | 172.4 |
| C | 9 | 54 | 34362 | 195.1 | 731 | 736 | 172.4 |
| C | 10 | 91 | 19055 | 106.29 | 731 | 736 | 172.4 |
| D | 1 | 239 | 723436 | 4141.3 | 722 | 703 | 174.5 |
| D | 1 | 52 | 209520 | 1196.53 | 722 | 703 | 174.5 |
| D | 9 | 1 | 31557 | 176.8 | 722 | 703 | 174.5 |
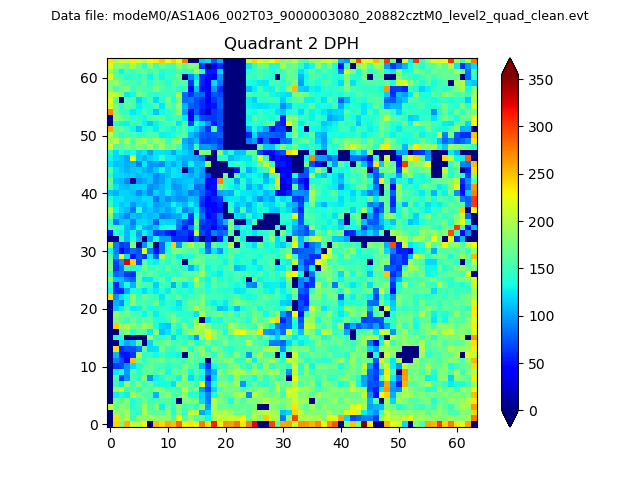
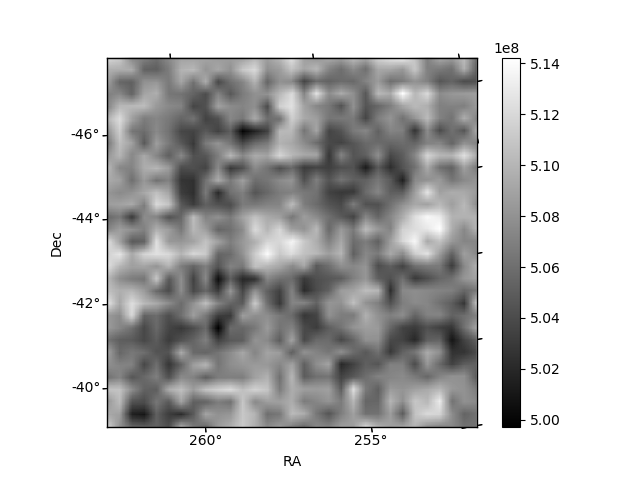
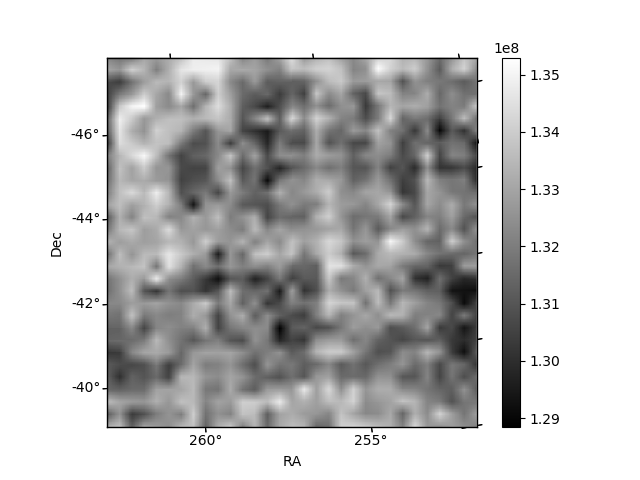
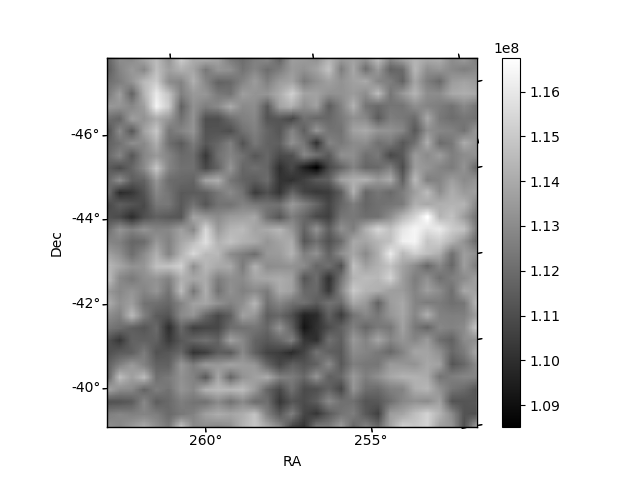
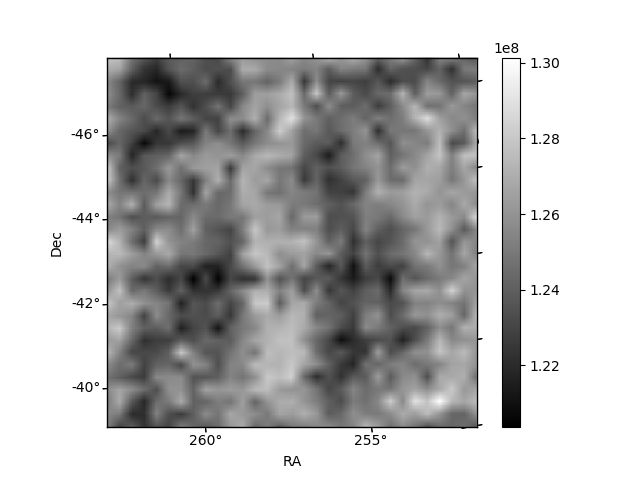
Histogram calculated using DETX and DETY for each event in the final _common_clean file
| Quadrant A | 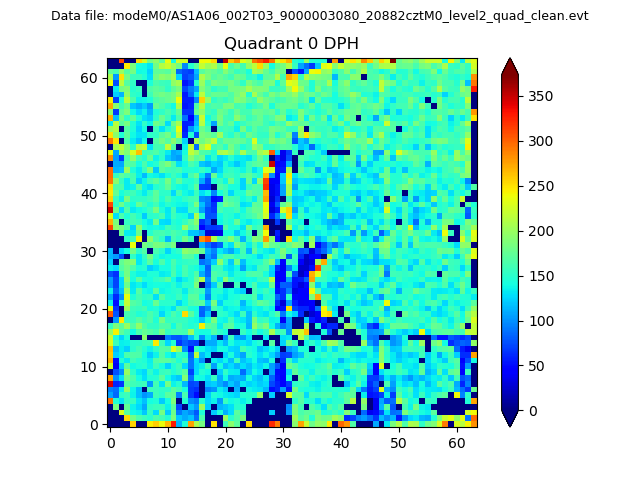 |
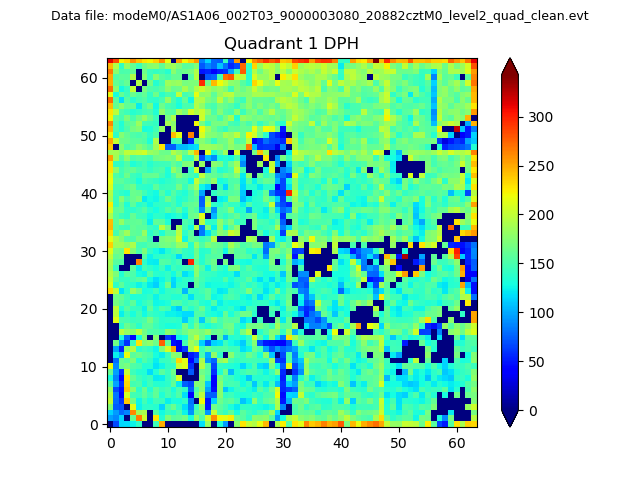 |
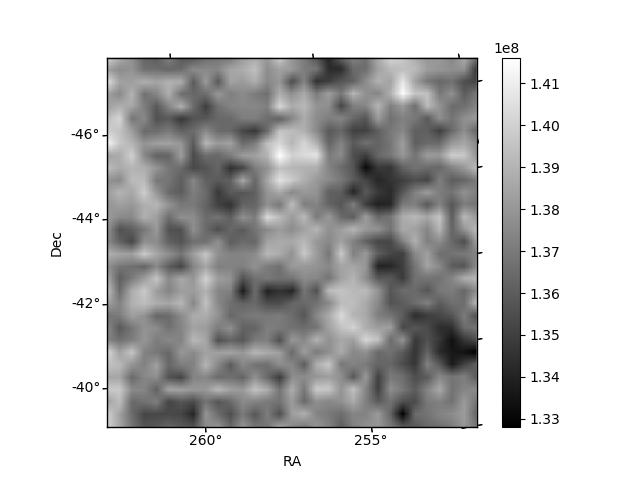
Quadrant B |
|---|---|---|---|
| Quadrant D | 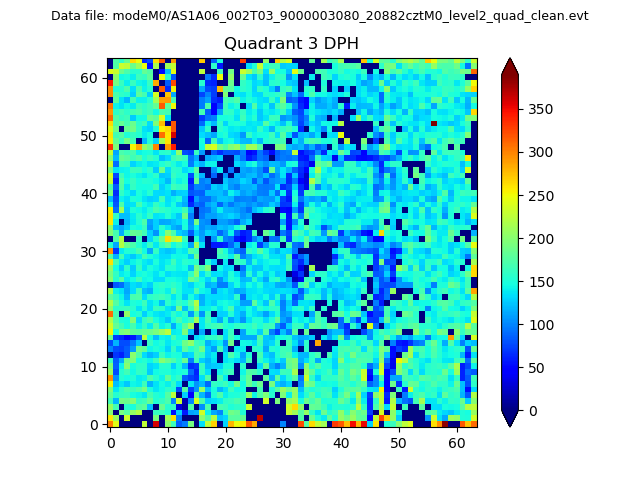 |
 |
Quadrant C |
| Plot type | Count rate plots | Images |
|---|---|---|
| Comparison with Poisson distribution Blue bars denote a histogram of data divided into 1 sec bins. Red curve is a Poisson curve with rate = median count rate of data. |
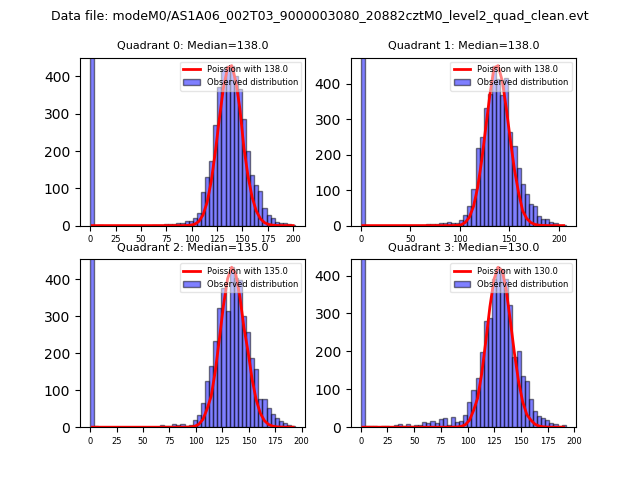 |
 |
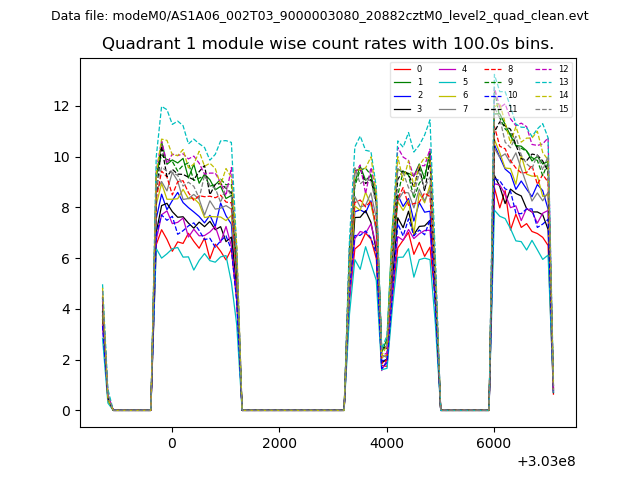
| Quadrant-wise count rates Data is divided into 100 sec bins |
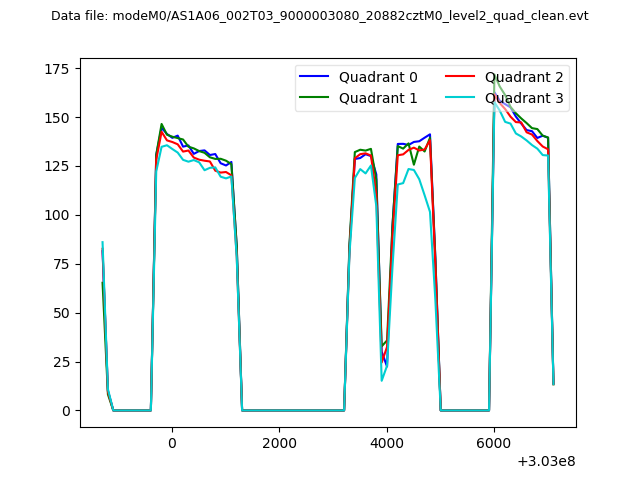 |
|
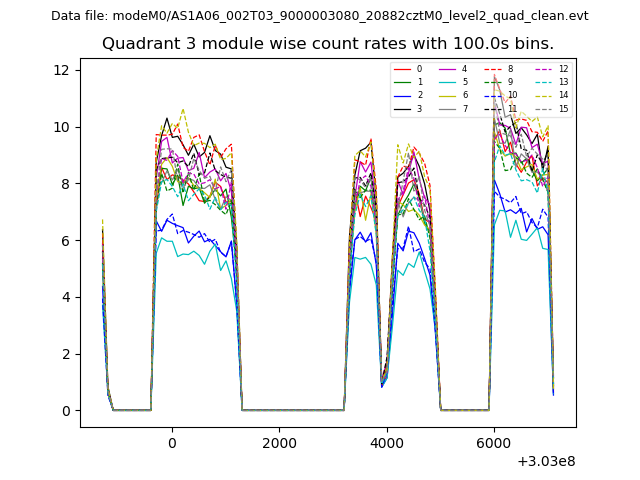
| Module-wise count rates for Quadrant A Data is divided into 100 sec bins |
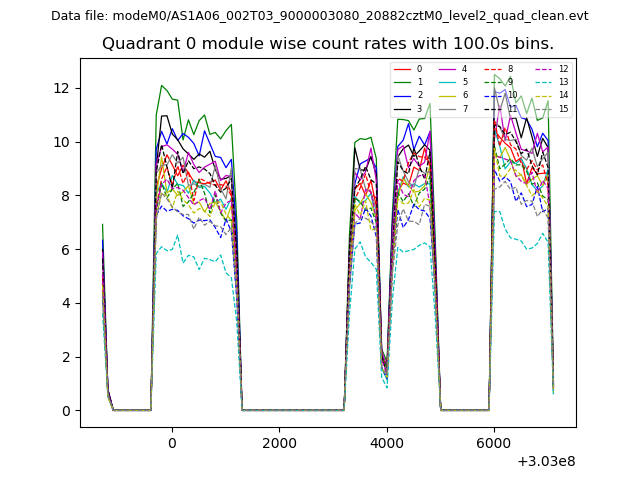 |
 |
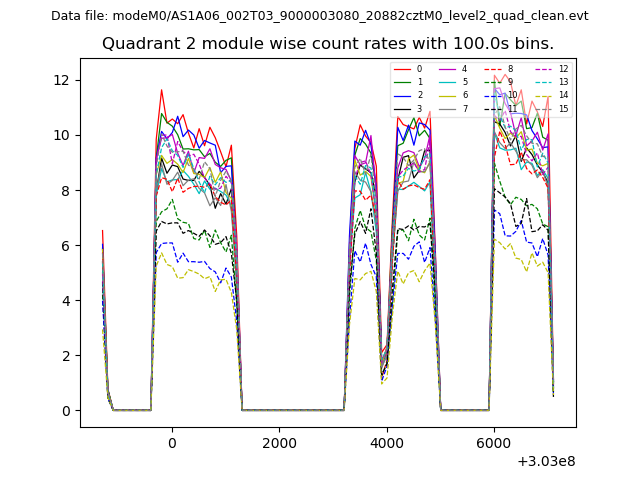
| Module-wise count rates for Quadrant B Data is divided into 100 sec bins |
 |
 |
| Module-wise count rates for Quadrant C Data is divided into 100 sec bins |
 |
 |
| Module-wise count rates for Quadrant D Data is divided into 100 sec bins |
 |
 |
| Parameter | Plot |
|---|---|
| CZT HV Monitor | 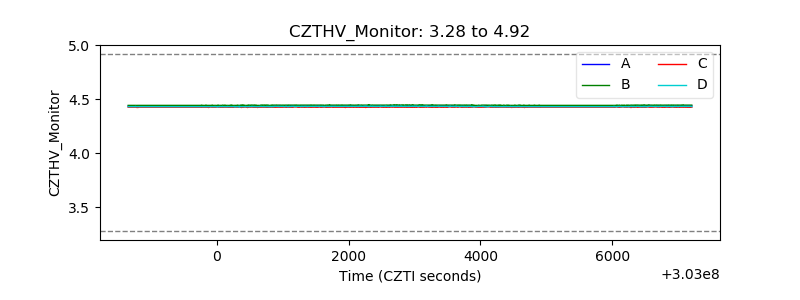 |
| D_VDD | 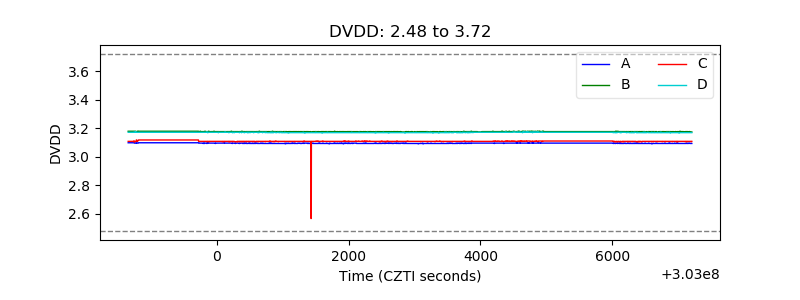 |
| Temperature 1 | 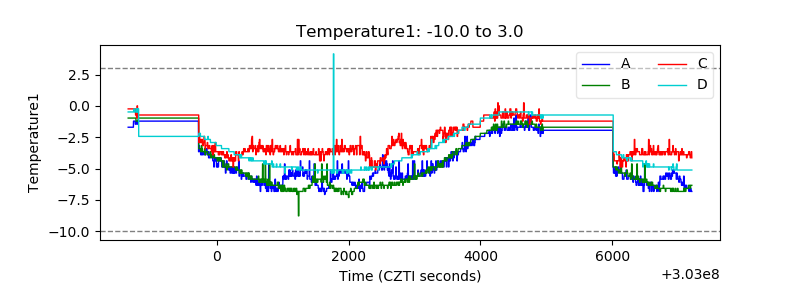 |
| Veto HV Monitor | 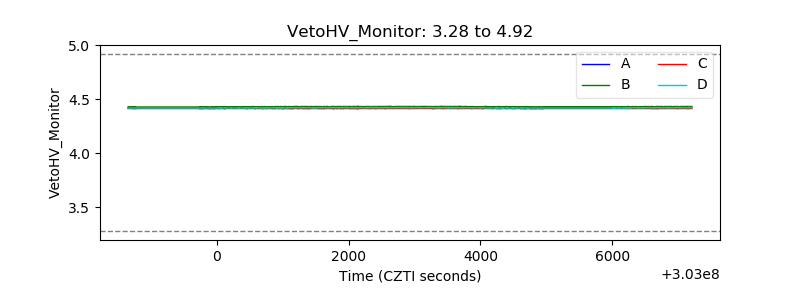 |
| Veto LLD |  |
| Alpha Counter | 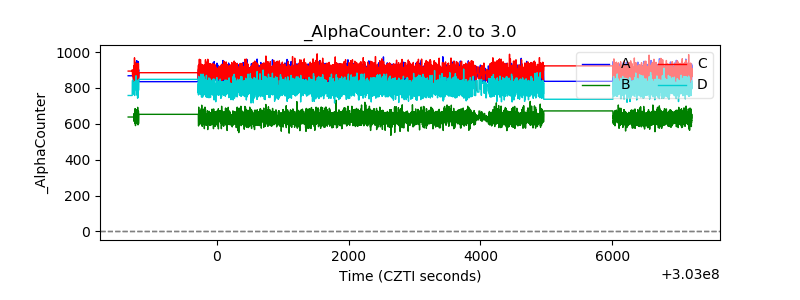 |
| _CPM_Rate | 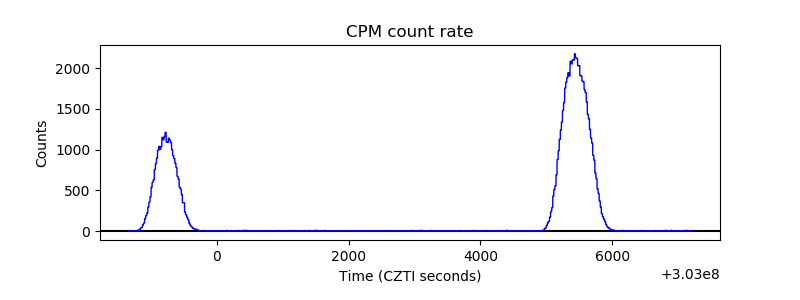 |
| CZT Counter | 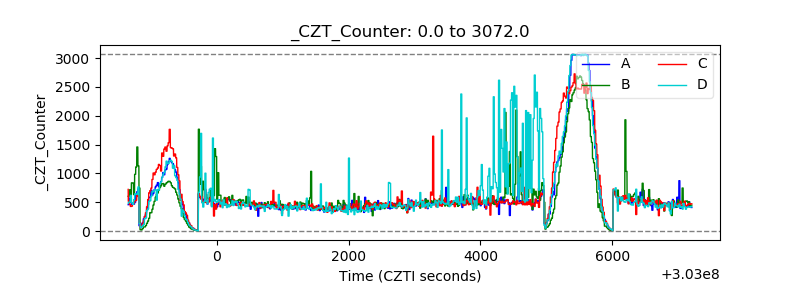 |
| +2.5 Volts monitor |  |
| +5 Volts monitor |  |
| _ROLL_ROT | 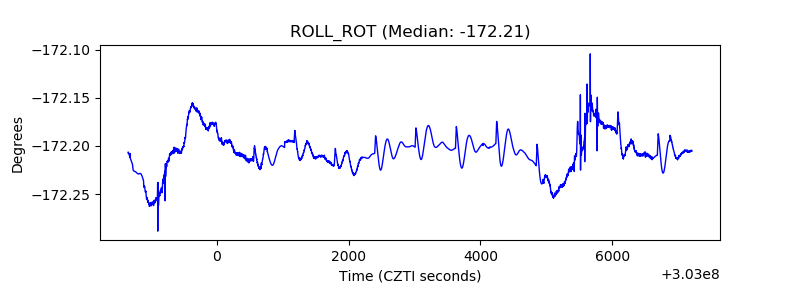 |
| _Roll_DEC | 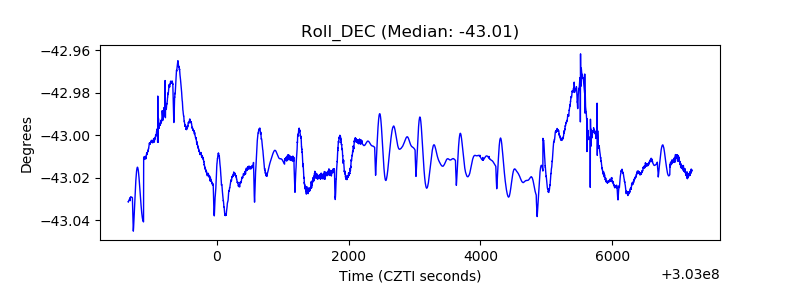 |
| _Roll_RA | 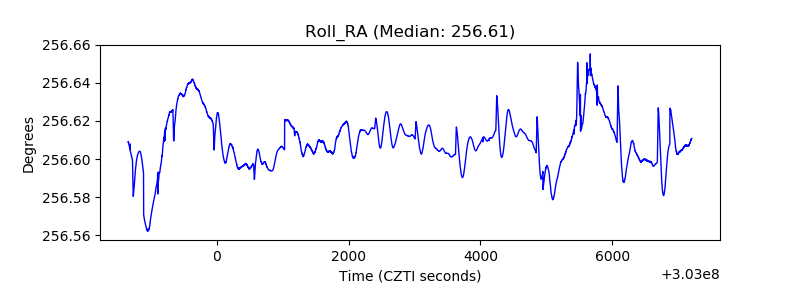 |
| Veto Counter | 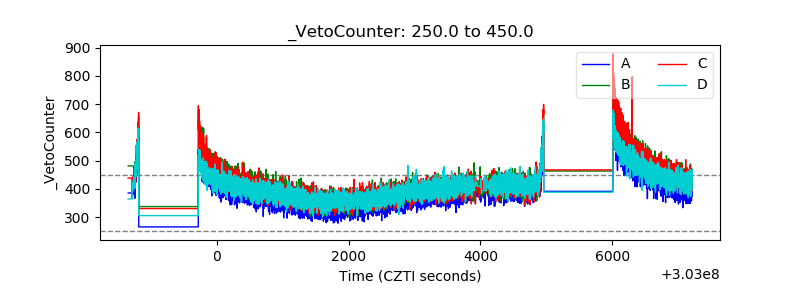 |