| Param | Original file | Final file |
|---|---|---|
| Filename | modeM0/AS1A06_002T03_9000003080_20884cztM0_level2.evt | modeM0/AS1A06_002T03_9000003080_20884cztM0_level2_quad_clean.evt |
| Size (bytes) | 1,182,024,000 | 214,248,960 |
| Size | 1.1 GB | 204.3 MB |
| Events in quadrant A | 7,919,276 | 1,359,296 |
| Events in quadrant B | 9,023,063 | 1,361,346 |
| Events in quadrant C | 8,149,947 | 1,327,249 |
| Events in quadrant D | 9,562,480 | 1,275,526 |
| Mode M9 | |||
|---|---|---|---|
| Quadrant | BADHDUFLAG | Total packets | Discarded packets |
| A | 0 | 31 | 0 |
| B | 0 | 31 | 0 |
| C | 0 | 31 | 0 |
| D | 0 | 31 | 0 |
| Mode M0 | |||
|---|---|---|---|
| Quadrant | BADHDUFLAG | Total packets | Discarded packets |
| A | 0 | 34555 | 39 |
| B | 0 | 37800 | 41 |
| C | 0 | 34844 | 59 |
| D | 0 | 39930 | 48 |
| Mode SS | |||
|---|---|---|---|
| Quadrant | BADHDUFLAG | Total packets | Discarded packets |
| A | 0 | 346 | 0 |
| B | 0 | 346 | 2 |
| C | 0 | 346 | 0 |
| D | 0 | 346 | 0 |
| Quadrant | Total seconds | Saturated seconds | Saturation percentage |
|---|---|---|---|
| A | 16900 | 46 | 0.272189% |
| B | 16900 | 190 | 1.124260% |
| C | 16892 | 145 | 0.858395% |
| D | 16900 | 373 | 2.207101% |
Noise dominated data is calculated using 1-second bins in cleaned event files. If a bin has >2000 counts, and if more than 50% of those come from <1% of pixels, then it is considered to be noise-dominated and hence unusable.
| Quadrant | # 1 sec bins | Bins with >0 counts | Bins with >2000 counts | High rate bins dominated by noise | Noise dominated (total time) | Noise dominated (detector-on time) | Marked lightcurve |
|---|---|---|---|---|---|---|---|
| A | 20063 | 16919 | 0 | 0 | 0.00% | 0.00% | 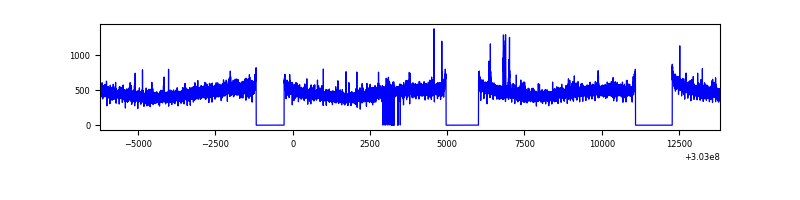 |
| B | 20064 | 16916 | 57 | 57 | 0.28% | 0.34% | 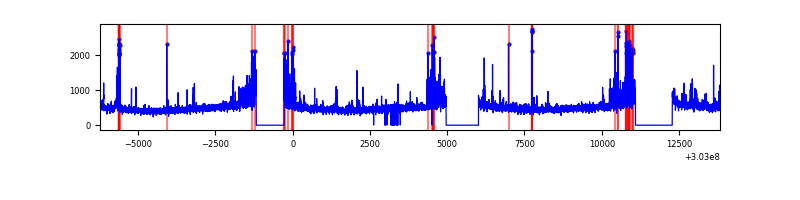 |
| C | 20064 | 16913 | 23 | 23 | 0.11% | 0.14% | 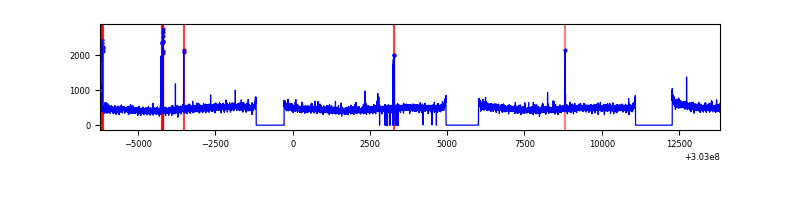 |
| D | 20063 | 16914 | 301 | 301 | 1.50% | 1.78% | 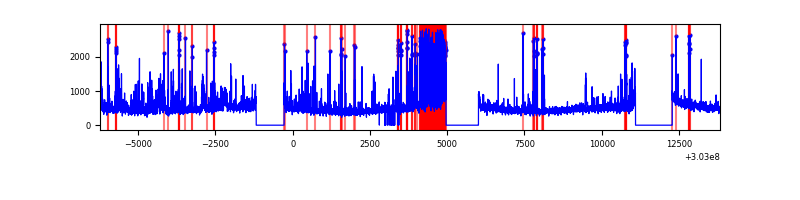 |
Top three noisy pixels from each quadrant. If the there are fewer than three noisy pixels in the level2.evt file, extra rows are filled as -1
| Pixel properties | Quadrant properties | ||||||
|---|---|---|---|---|---|---|---|
| Quadrant | DetID | PixID | Counts | Sigma | Mean | Median | Sigma |
| A | 12 | 96 | 36748 | 85.31 | 2043 | 2003 | 407.3 |
| A | 6 | 16 | 28025 | 63.9 | 2043 | 2003 | 407.3 |
| A | 0 | 226 | 17221 | 37.37 | 2043 | 2003 | 407.3 |
| B | 7 | 220 | 366696 | 946.81 | 2044 | 1995 | 385.2 |
| B | 0 | 189 | 250051 | 643.98 | 2044 | 1995 | 385.2 |
| B | 0 | 197 | 97328 | 247.5 | 2044 | 1995 | 385.2 |
| C | 14 | 238 | 314237 | 685.76 | 1964 | 1981 | 455.3 |
| C | 9 | 54 | 99728 | 214.67 | 1964 | 1981 | 455.3 |
| C | 10 | 91 | 46295 | 97.32 | 1964 | 1981 | 455.3 |
| D | 1 | 239 | 924124 | 1954.95 | 1969 | 1915 | 471.7 |
| D | 1 | 52 | 775728 | 1640.38 | 1969 | 1915 | 471.7 |
| D | 14 | 35 | 103059 | 214.41 | 1969 | 1915 | 471.7 |
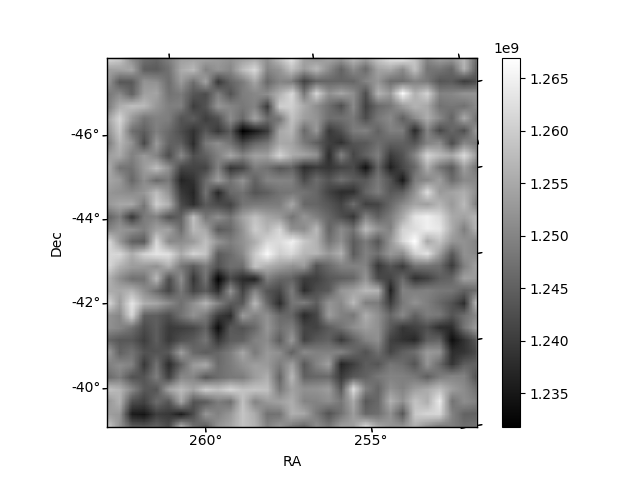
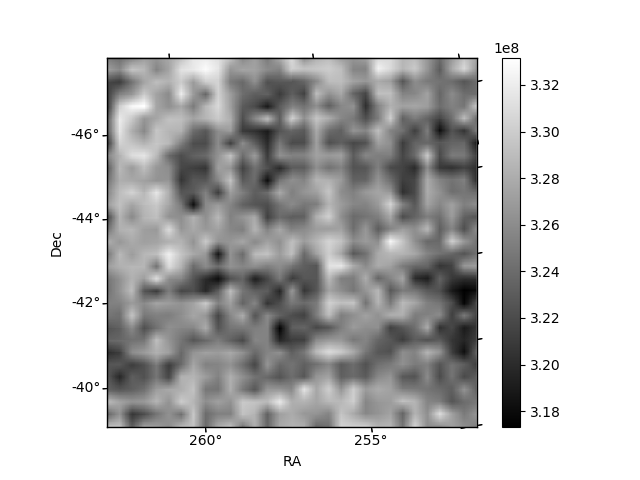
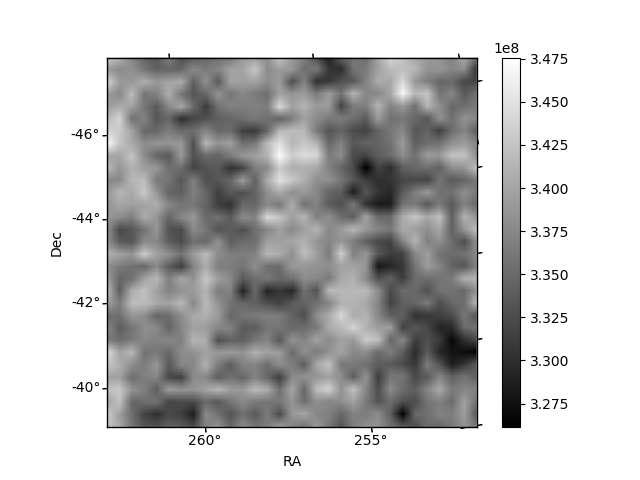
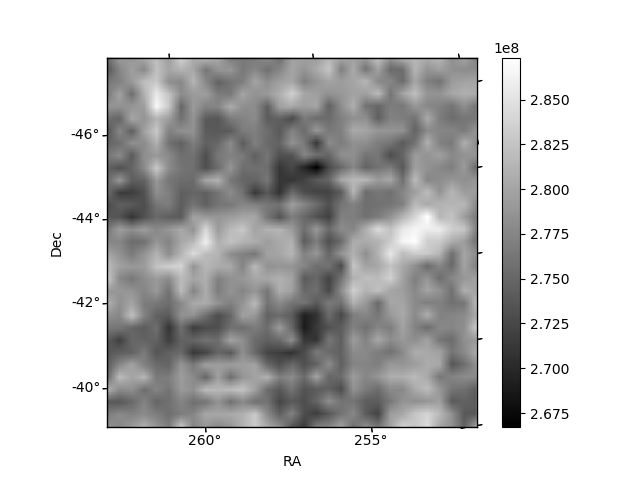
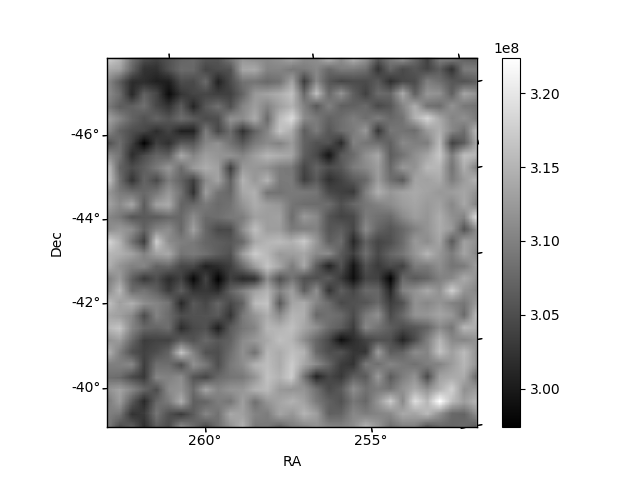
Histogram calculated using DETX and DETY for each event in the final _common_clean file
| Quadrant A | 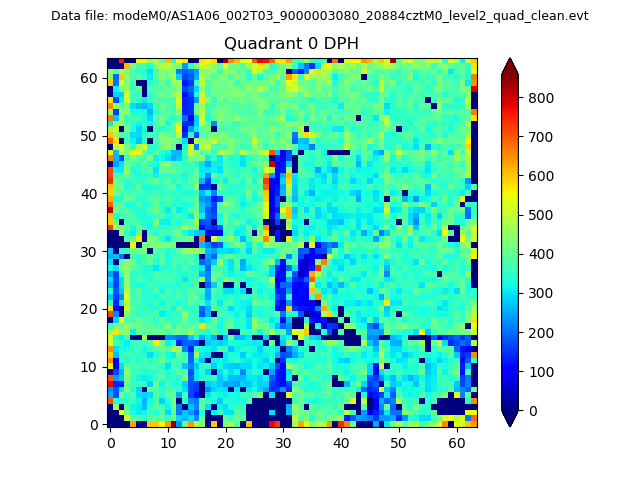 |
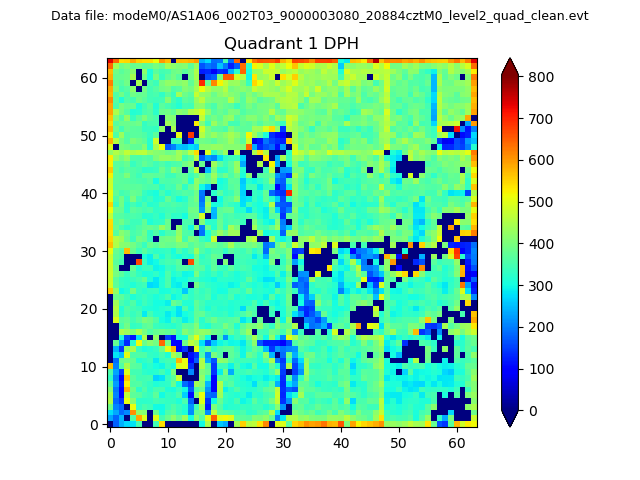 |
Quadrant B |
|---|---|---|---|
| Quadrant D |  |
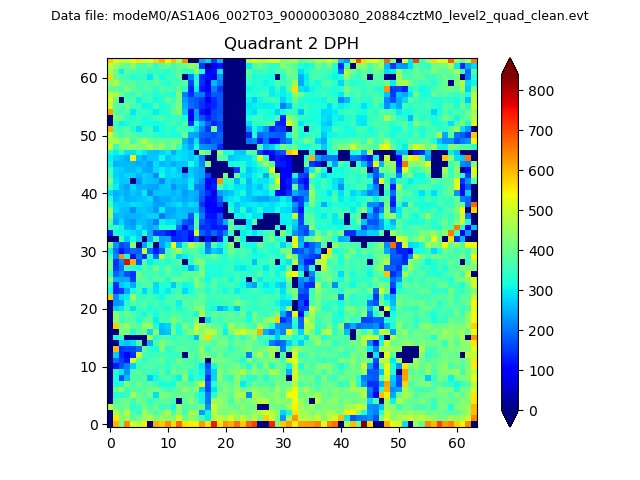 |
Quadrant C |
| Plot type | Count rate plots | Images |
|---|---|---|
| Comparison with Poisson distribution Blue bars denote a histogram of data divided into 1 sec bins. Red curve is a Poisson curve with rate = median count rate of data. |
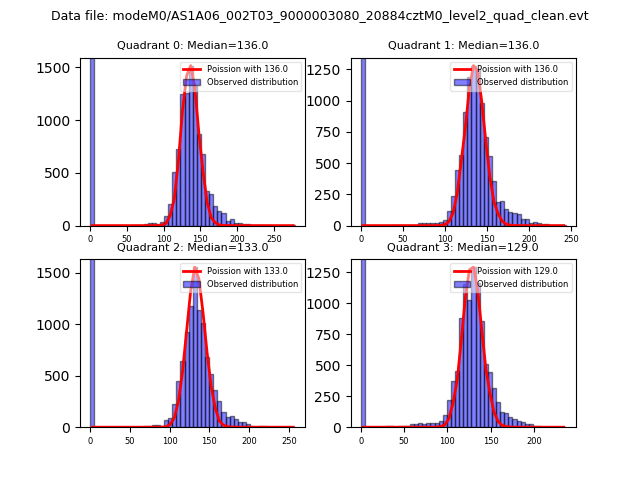 |
 |
| Quadrant-wise count rates Data is divided into 100 sec bins |
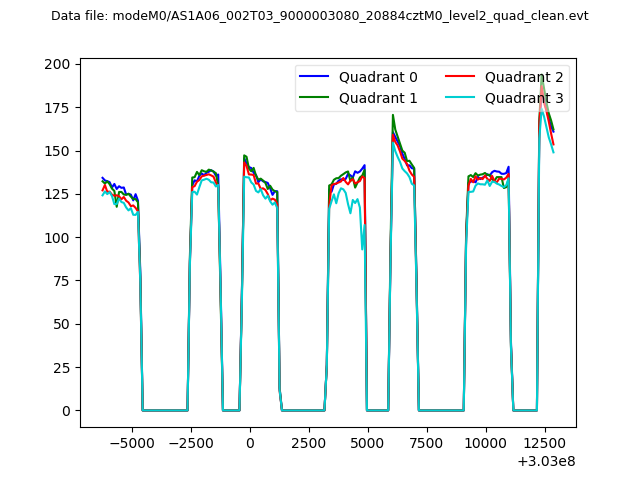 |
|
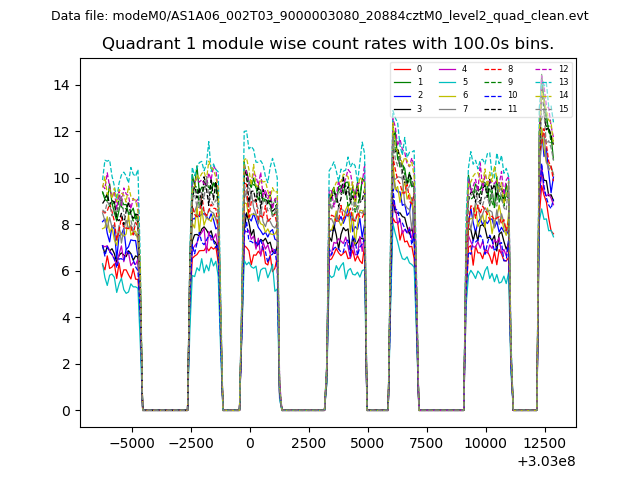
| Module-wise count rates for Quadrant A Data is divided into 100 sec bins |
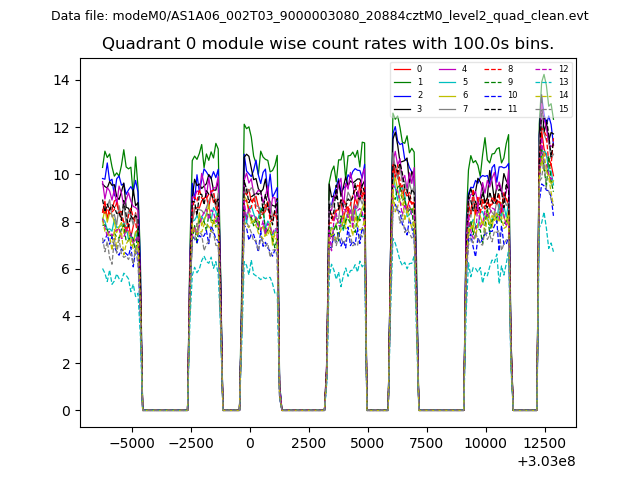 |
 |
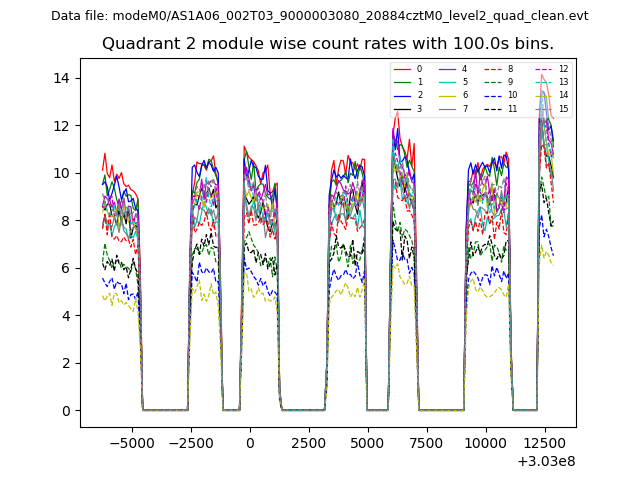
| Module-wise count rates for Quadrant B Data is divided into 100 sec bins |
 |
 |
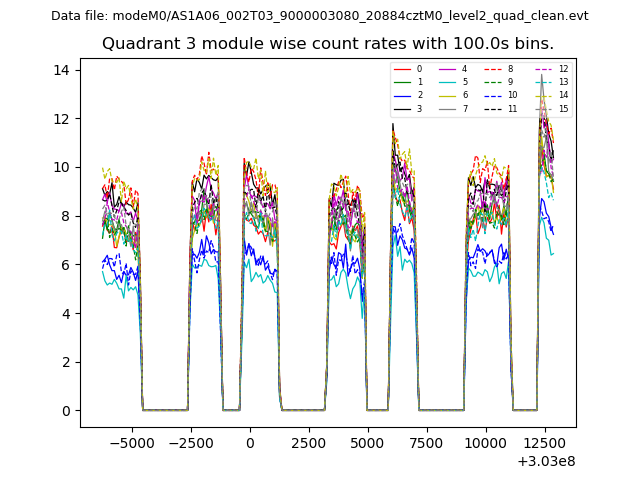
| Module-wise count rates for Quadrant C Data is divided into 100 sec bins |
 |
 |
| Module-wise count rates for Quadrant D Data is divided into 100 sec bins |
 |
 |
| Parameter | Plot |
|---|---|
| CZT HV Monitor | 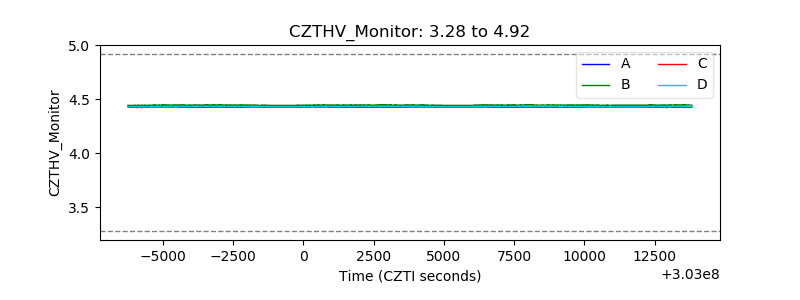 |
| D_VDD | 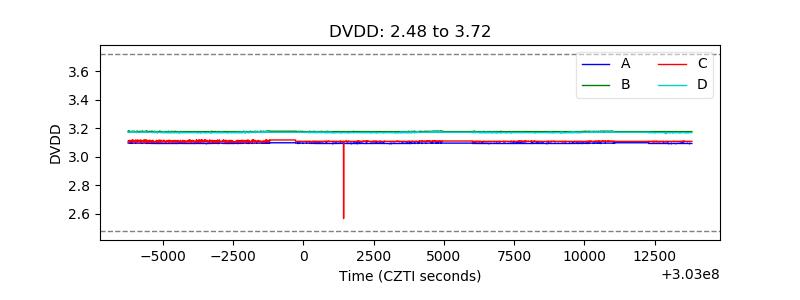 |
| Temperature 1 | 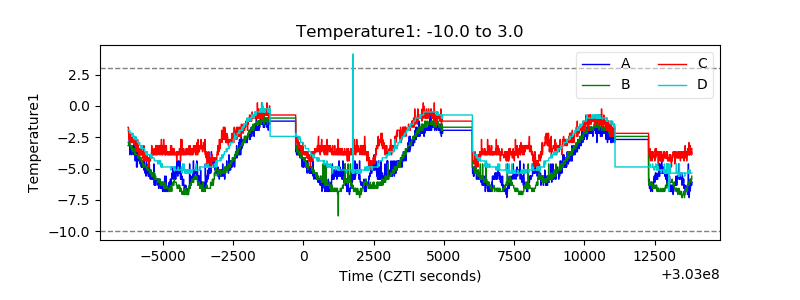 |
| Veto HV Monitor |  |
| Veto LLD | 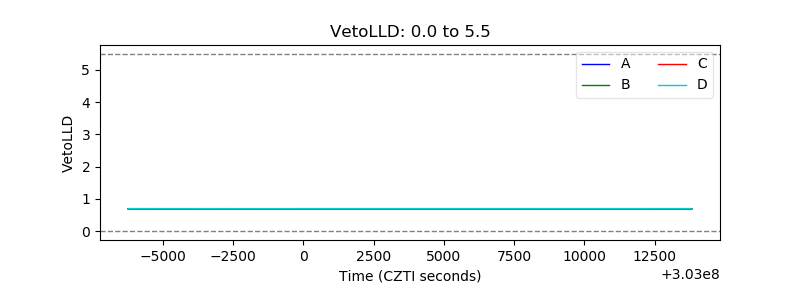 |
| Alpha Counter | 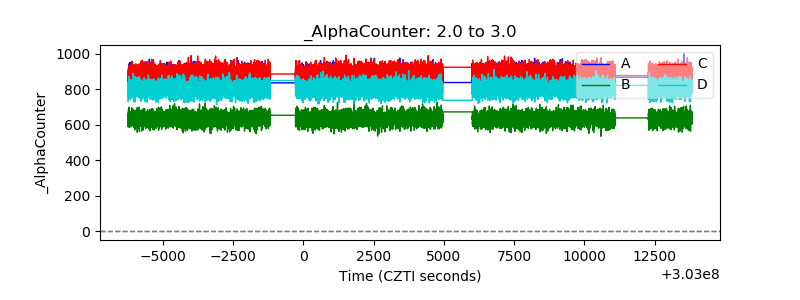 |
| _CPM_Rate | 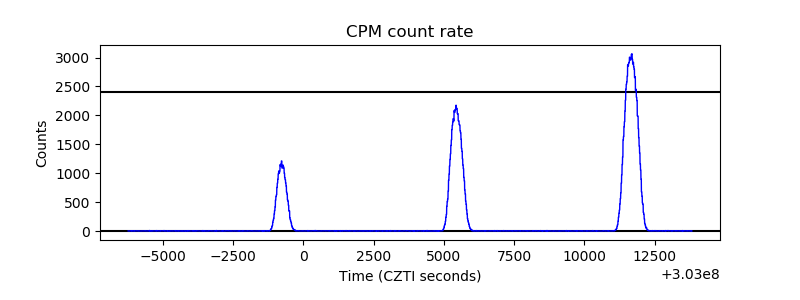 |
| CZT Counter | 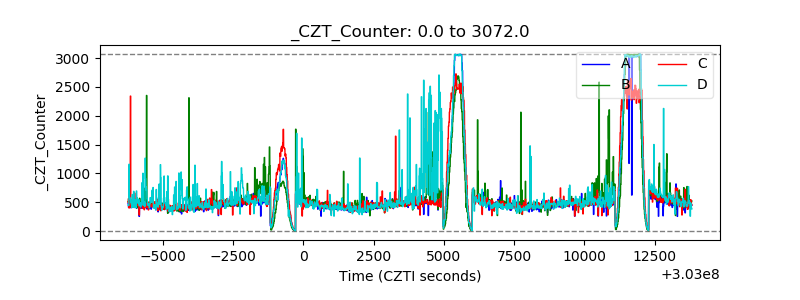 |
| +2.5 Volts monitor |  |
| +5 Volts monitor |  |
| _ROLL_ROT | 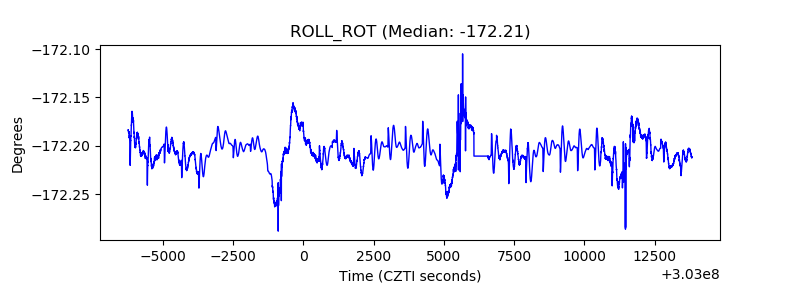 |
| _Roll_DEC | 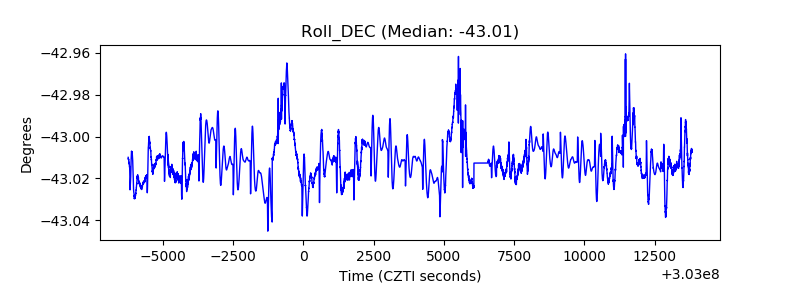 |
| _Roll_RA | 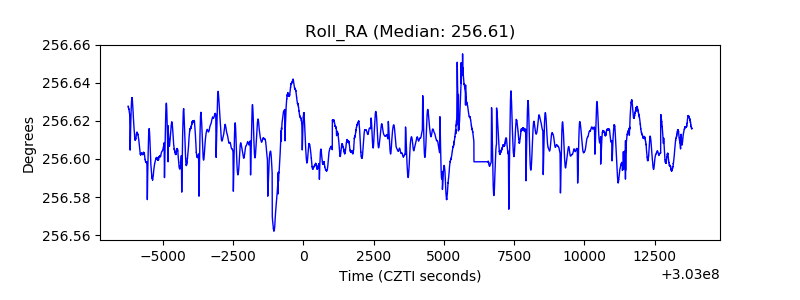 |
| Veto Counter | 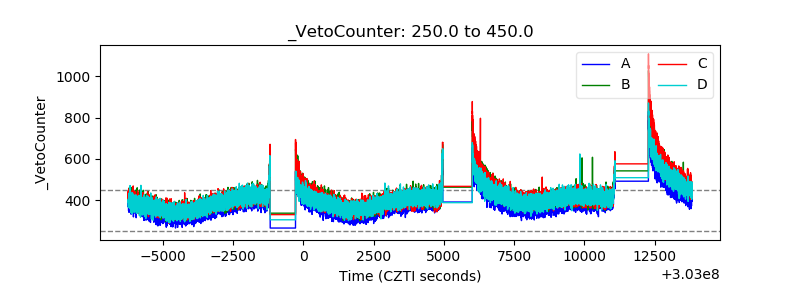 |