| Param | Original file | Final file |
|---|---|---|
| Filename | modeM0/AS1A06_002T03_9000003080_20888cztM0_level2.evt | modeM0/AS1A06_002T03_9000003080_20888cztM0_level2_quad_clean.evt |
| Size (bytes) | 492,341,760 | 83,885,760 |
| Size | 469.5 MB | 80.0 MB |
| Events in quadrant A | 3,325,212 | 532,322 |
| Events in quadrant B | 3,598,498 | 534,465 |
| Events in quadrant C | 3,415,783 | 526,388 |
| Events in quadrant D | 4,141,985 | 505,781 |
| Mode M9 | |||
|---|---|---|---|
| Quadrant | BADHDUFLAG | Total packets | Discarded packets |
| A | 0 | 18 | 0 |
| B | 0 | 19 | 0 |
| C | 0 | 19 | 0 |
| D | 0 | 19 | 0 |
| Mode M0 | |||
|---|---|---|---|
| Quadrant | BADHDUFLAG | Total packets | Discarded packets |
| A | 0 | 13469 | 2 |
| B | 0 | 14342 | 2 |
| C | 0 | 13861 | 2 |
| D | 0 | 16016 | 2 |
| Mode SS | |||
|---|---|---|---|
| Quadrant | BADHDUFLAG | Total packets | Discarded packets |
| A | 0 | 128 | 0 |
| B | 0 | 128 | 0 |
| C | 0 | 128 | 0 |
| D | 0 | 128 | 0 |
| Quadrant | Total seconds | Saturated seconds | Saturation percentage |
|---|---|---|---|
| A | 6323 | 86 | 1.360114% |
| B | 6323 | 159 | 2.514629% |
| C | 6323 | 182 | 2.878381% |
| D | 6322 | 213 | 3.369187% |
Noise dominated data is calculated using 1-second bins in cleaned event files. If a bin has >2000 counts, and if more than 50% of those come from <1% of pixels, then it is considered to be noise-dominated and hence unusable.
| Quadrant | # 1 sec bins | Bins with >0 counts | Bins with >2000 counts | High rate bins dominated by noise | Noise dominated (total time) | Noise dominated (detector-on time) | Marked lightcurve |
|---|---|---|---|---|---|---|---|
| A | 7613 | 6324 | 0 | 0 | 0.00% | 0.00% | 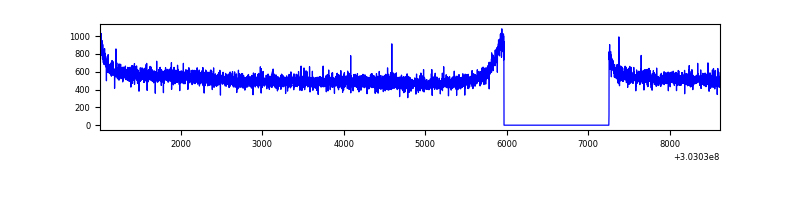 |
| B | 7613 | 6324 | 16 | 16 | 0.21% | 0.25% | 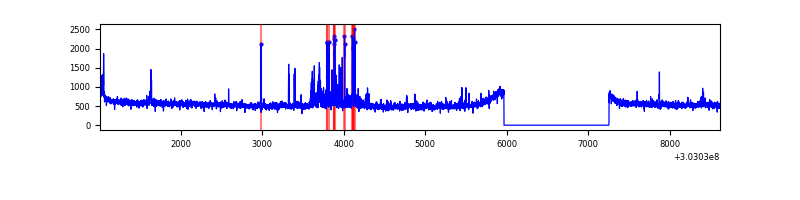 |
| C | 7613 | 6324 | 0 | 0 | 0.00% | 0.00% | 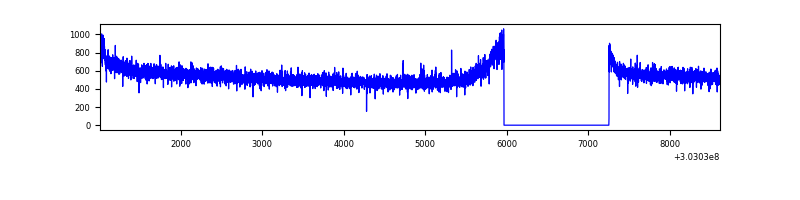 |
| D | 7612 | 6323 | 159 | 159 | 2.09% | 2.51% | 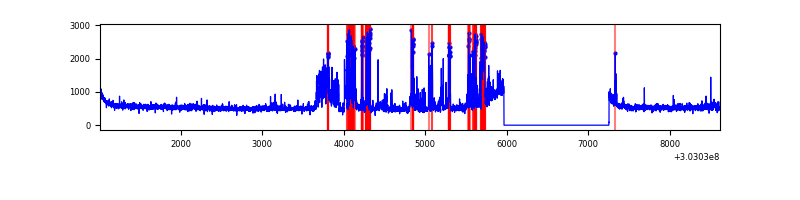 |
Top three noisy pixels from each quadrant. If the there are fewer than three noisy pixels in the level2.evt file, extra rows are filled as -1
| Pixel properties | Quadrant properties | ||||||
|---|---|---|---|---|---|---|---|
| Quadrant | DetID | PixID | Counts | Sigma | Mean | Median | Sigma |
| A | 0 | 226 | 7522 | 38.9 | 865 | 849 | 171.5 |
| A | 3 | 137 | 6596 | 33.5 | 865 | 849 | 171.5 |
| A | 12 | 194 | 6153 | 30.92 | 865 | 849 | 171.5 |
| B | 7 | 220 | 152488 | 960.1 | 855 | 837 | 158.0 |
| B | 0 | 219 | 31681 | 195.27 | 855 | 837 | 158.0 |
| B | 0 | 189 | 22251 | 135.57 | 855 | 837 | 158.0 |
| C | 14 | 238 | 133722 | 696.96 | 835 | 842 | 190.7 |
| C | 10 | 91 | 18618 | 93.24 | 835 | 842 | 190.7 |
| C | 13 | 61 | 6004 | 27.07 | 835 | 842 | 190.7 |
| D | 1 | 52 | 708875 | 3506.25 | 845 | 824 | 201.9 |
| D | 1 | 20 | 142259 | 700.38 | 845 | 824 | 201.9 |
| D | 5 | 222 | 69256 | 338.87 | 845 | 824 | 201.9 |
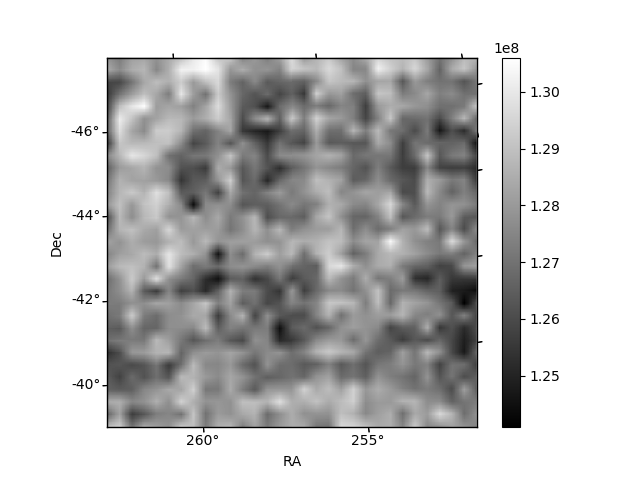
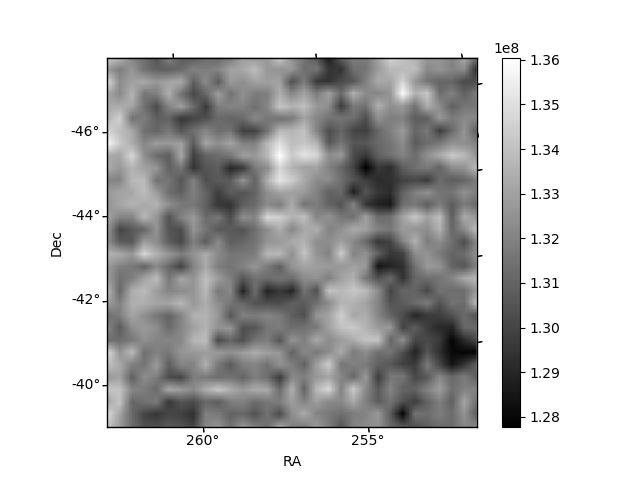
Histogram calculated using DETX and DETY for each event in the final _common_clean file
| Quadrant A | 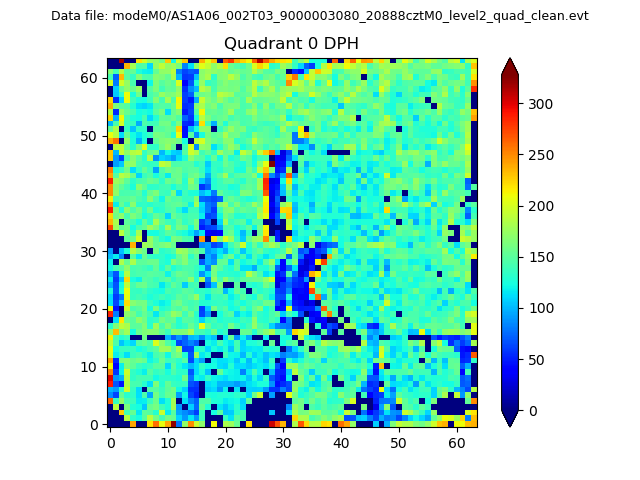 |
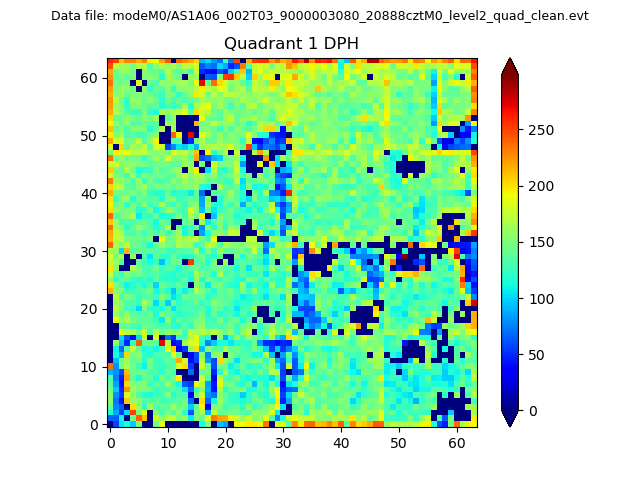 |
Quadrant B |
|---|---|---|---|
| Quadrant D |  |
 |
Quadrant C |
| Plot type | Count rate plots | Images |
|---|---|---|
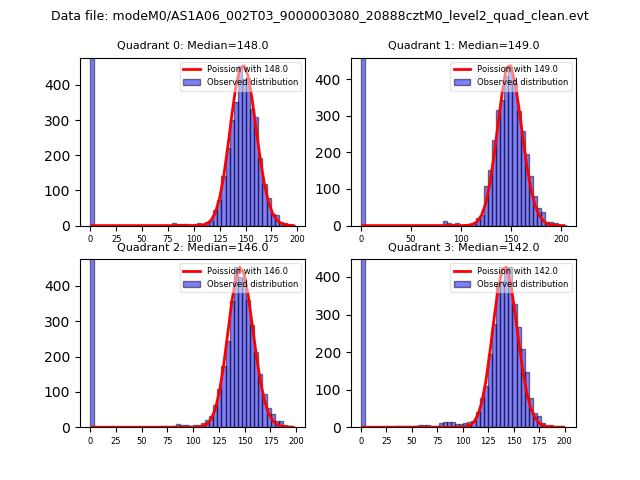
| Comparison with Poisson distribution Blue bars denote a histogram of data divided into 1 sec bins. Red curve is a Poisson curve with rate = median count rate of data. |
 |
 |
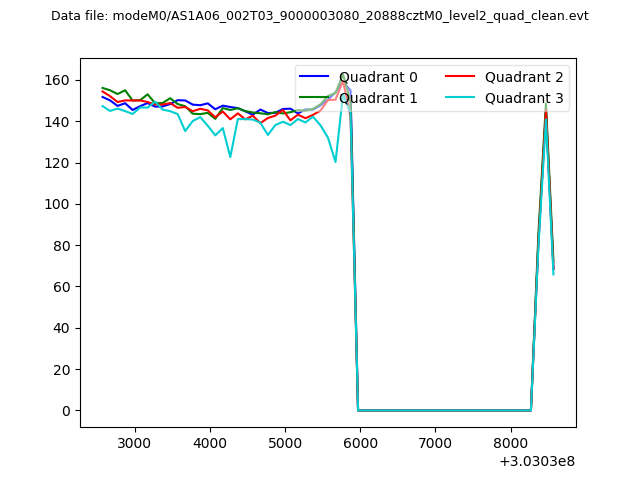
| Quadrant-wise count rates Data is divided into 100 sec bins |
 |
|
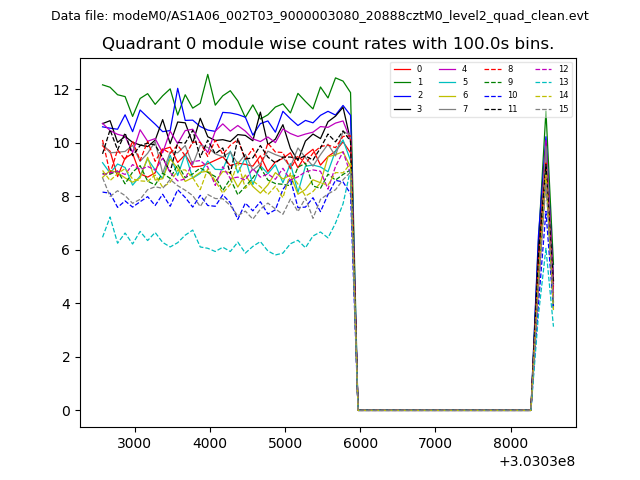
| Module-wise count rates for Quadrant A Data is divided into 100 sec bins |
 |
 |
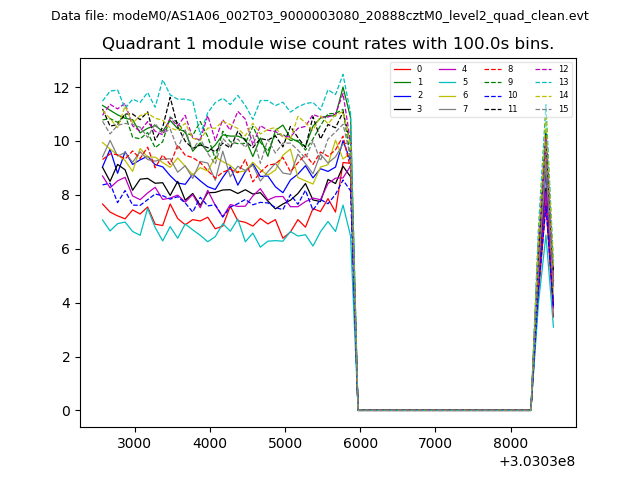
| Module-wise count rates for Quadrant B Data is divided into 100 sec bins |
 |
 |
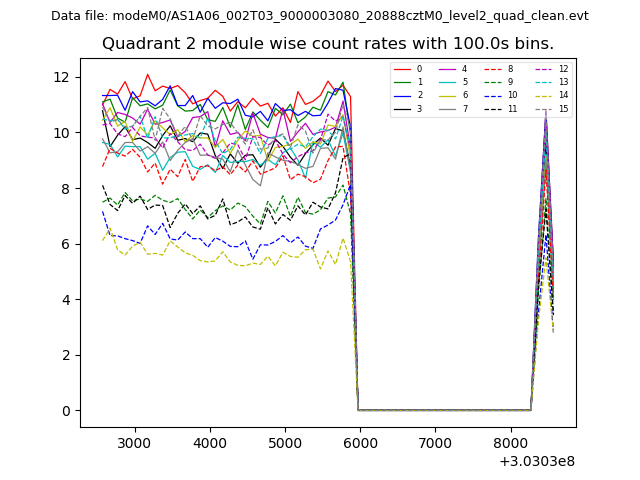
| Module-wise count rates for Quadrant C Data is divided into 100 sec bins |
 |
 |
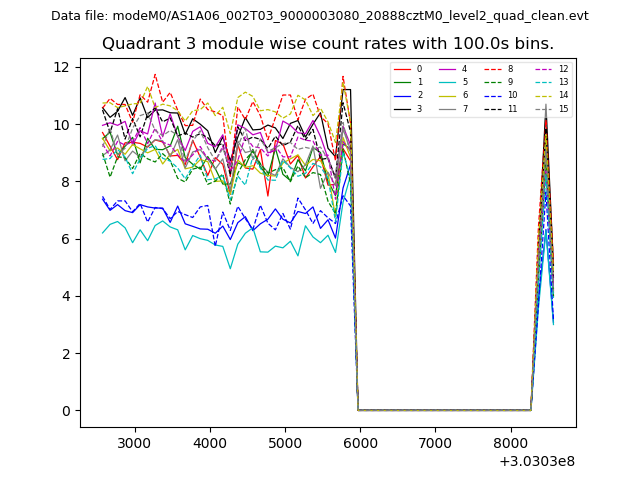
| Module-wise count rates for Quadrant D Data is divided into 100 sec bins |
 |
 |
| Parameter | Plot |
|---|---|
| CZT HV Monitor | 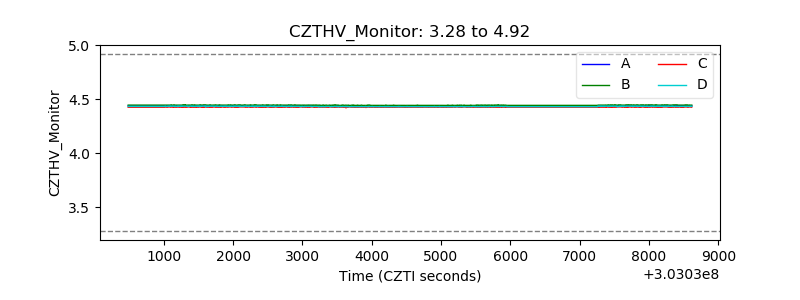 |
| D_VDD | 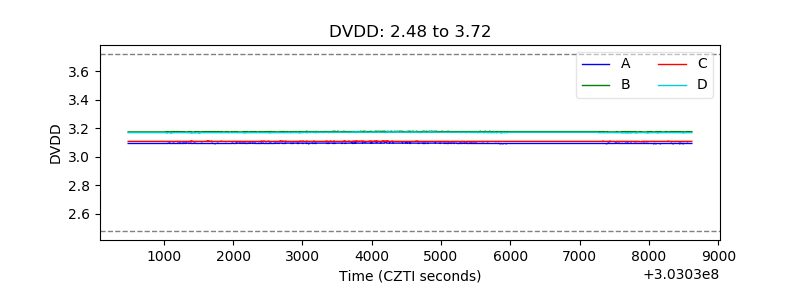 |
| Temperature 1 | 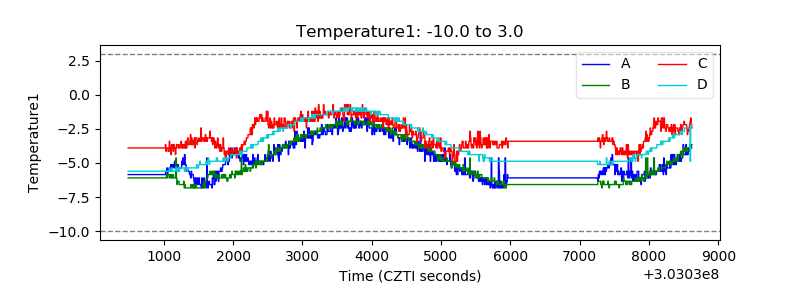 |
| Veto HV Monitor | 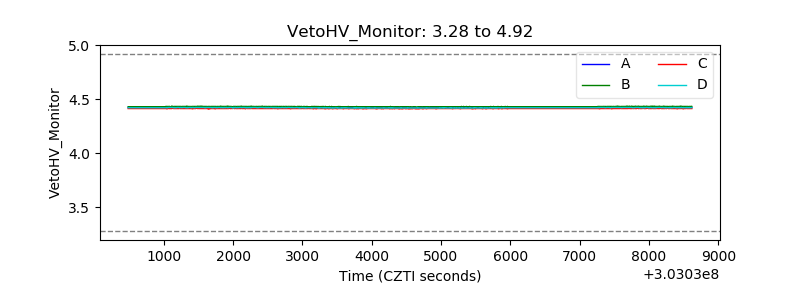 |
| Veto LLD | 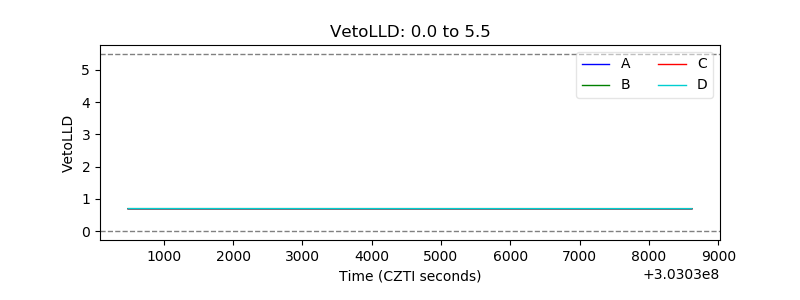 |
| Alpha Counter |  |
| _CPM_Rate | 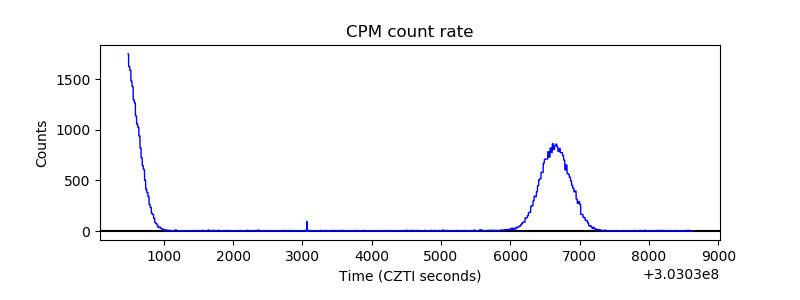 |
| CZT Counter | 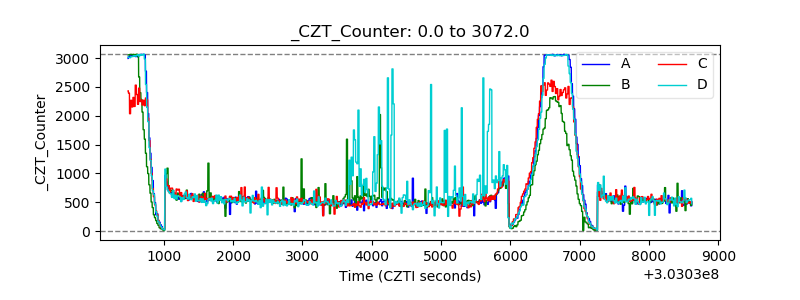 |
| +2.5 Volts monitor |  |
| +5 Volts monitor |  |
| _ROLL_ROT | 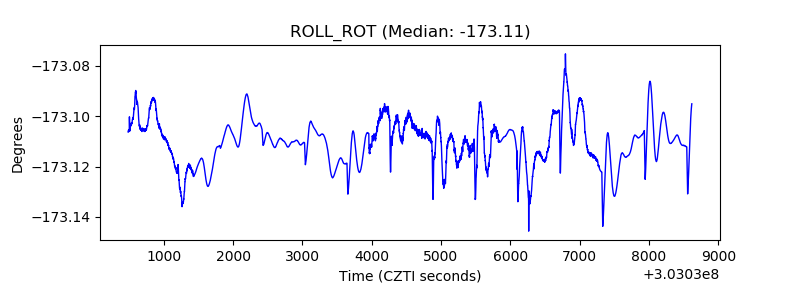 |
| _Roll_DEC | 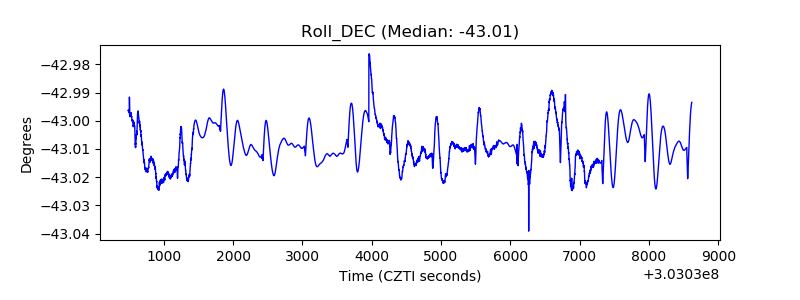 |
| _Roll_RA |  |
| Veto Counter | 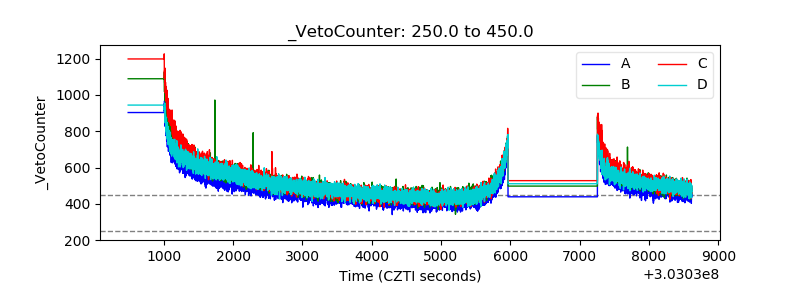 |