| Param | Original file | Final file |
|---|---|---|
| Filename | modeM0/AS1A06_002T03_9000003080_20890cztM0_level2.evt | modeM0/AS1A06_002T03_9000003080_20890cztM0_level2_quad_clean.evt |
| Size (bytes) | 534,697,920 | 99,823,680 |
| Size | 509.9 MB | 95.2 MB |
| Events in quadrant A | 3,507,248 | 641,772 |
| Events in quadrant B | 3,787,561 | 644,678 |
| Events in quadrant C | 3,513,341 | 632,314 |
| Events in quadrant D | 4,902,366 | 608,984 |
| Mode M9 | |||
|---|---|---|---|
| Quadrant | BADHDUFLAG | Total packets | Discarded packets |
| A | 0 | 5 | 0 |
| B | 0 | 6 | 0 |
| C | 0 | 6 | 0 |
| D | 0 | 6 | 0 |
| Mode M0 | |||
|---|---|---|---|
| Quadrant | BADHDUFLAG | Total packets | Discarded packets |
| A | 0 | 14839 | 2 |
| B | 0 | 15604 | 2 |
| C | 0 | 14805 | 2 |
| D | 0 | 19623 | 3 |
| Mode SS | |||
|---|---|---|---|
| Quadrant | BADHDUFLAG | Total packets | Discarded packets |
| A | 0 | 144 | 0 |
| B | 0 | 144 | 0 |
| C | 0 | 144 | 0 |
| D | 0 | 144 | 0 |
| Quadrant | Total seconds | Saturated seconds | Saturation percentage |
|---|---|---|---|
| A | 7116 | 145 | 2.037662% |
| B | 7116 | 190 | 2.670039% |
| C | 7116 | 187 | 2.627881% |
| D | 7115 | 174 | 2.445538% |
Noise dominated data is calculated using 1-second bins in cleaned event files. If a bin has >2000 counts, and if more than 50% of those come from <1% of pixels, then it is considered to be noise-dominated and hence unusable.
| Quadrant | # 1 sec bins | Bins with >0 counts | Bins with >2000 counts | High rate bins dominated by noise | Noise dominated (total time) | Noise dominated (detector-on time) | Marked lightcurve |
|---|---|---|---|---|---|---|---|
| A | 7661 | 7117 | 7 | 7 | 0.09% | 0.10% | 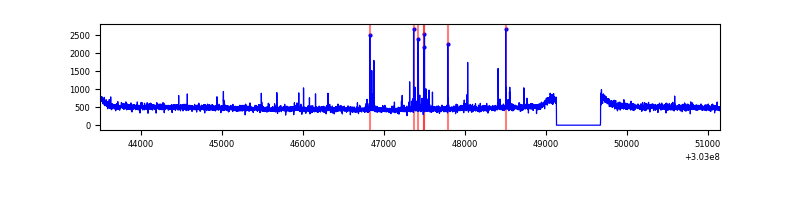 |
| B | 7661 | 7117 | 17 | 17 | 0.22% | 0.24% | 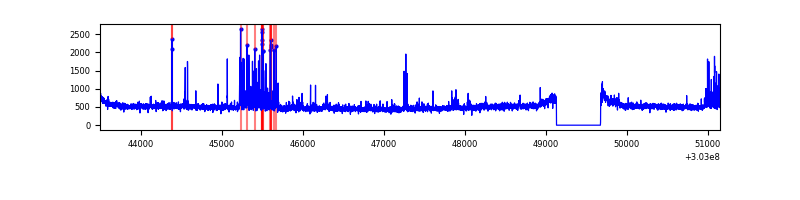 |
| C | 7661 | 7117 | 0 | 0 | 0.00% | 0.00% | 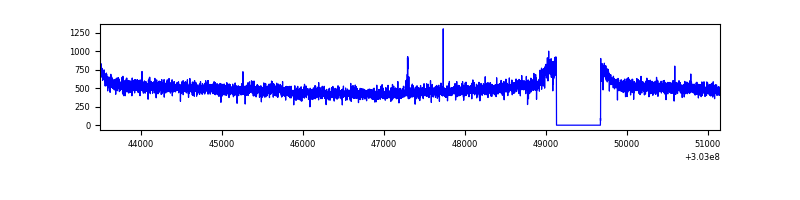 |
| D | 7660 | 7116 | 74 | 74 | 0.97% | 1.04% | 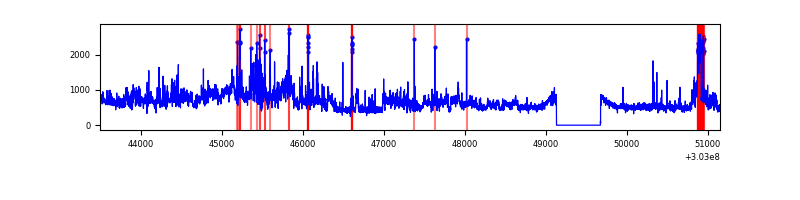 |
Top three noisy pixels from each quadrant. If the there are fewer than three noisy pixels in the level2.evt file, extra rows are filled as -1
| Pixel properties | Quadrant properties | ||||||
|---|---|---|---|---|---|---|---|
| Quadrant | DetID | PixID | Counts | Sigma | Mean | Median | Sigma |
| A | 5 | 16 | 79877 | 440.66 | 892 | 873 | 179.3 |
| A | 0 | 226 | 7777 | 38.51 | 892 | 873 | 179.3 |
| A | 3 | 137 | 7421 | 36.52 | 892 | 873 | 179.3 |
| B | 7 | 220 | 195361 | 1155.36 | 884 | 862 | 168.3 |
| B | 0 | 189 | 33926 | 196.41 | 884 | 862 | 168.3 |
| B | 0 | 230 | 27744 | 159.68 | 884 | 862 | 168.3 |
| C | 14 | 238 | 135648 | 684.3 | 854 | 859 | 197.0 |
| C | 10 | 91 | 39196 | 194.63 | 854 | 859 | 197.0 |
| C | 9 | 54 | 8404 | 38.3 | 854 | 859 | 197.0 |
| D | 1 | 20 | 1265878 | 6011.38 | 869 | 843 | 210.4 |
| D | 9 | 1 | 139045 | 656.73 | 869 | 843 | 210.4 |
| D | 5 | 222 | 116948 | 551.72 | 869 | 843 | 210.4 |
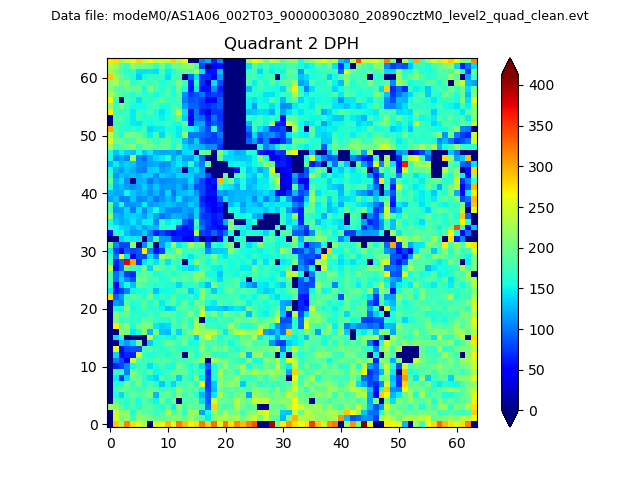
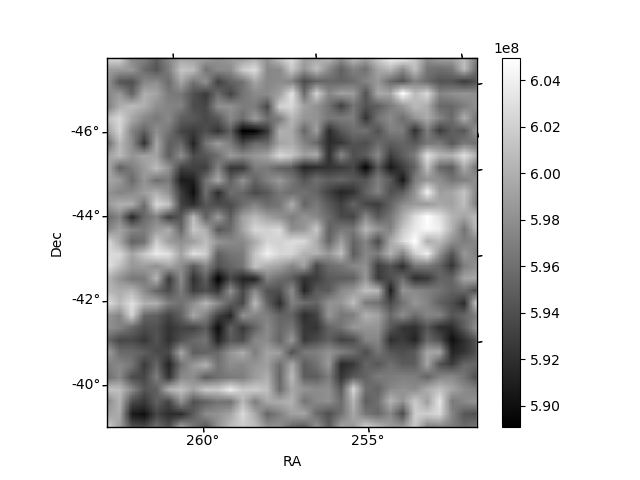
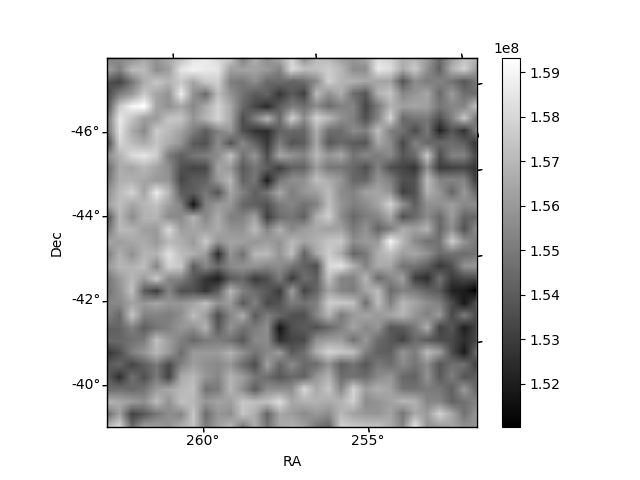
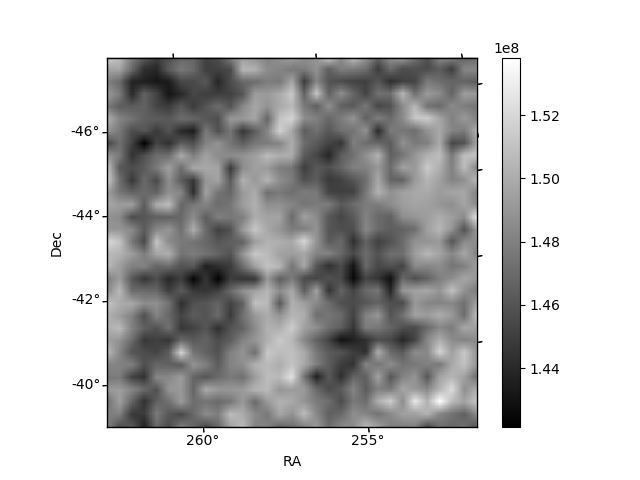
Histogram calculated using DETX and DETY for each event in the final _common_clean file
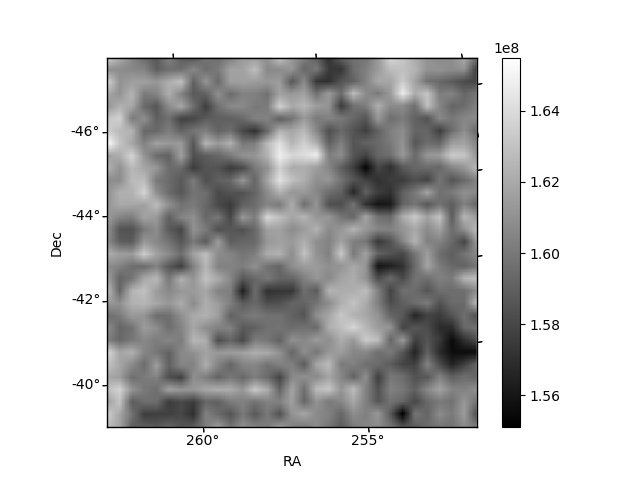
| Quadrant A | 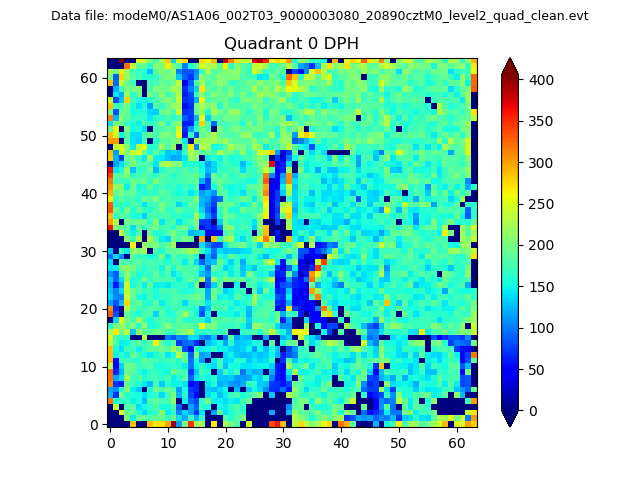 |
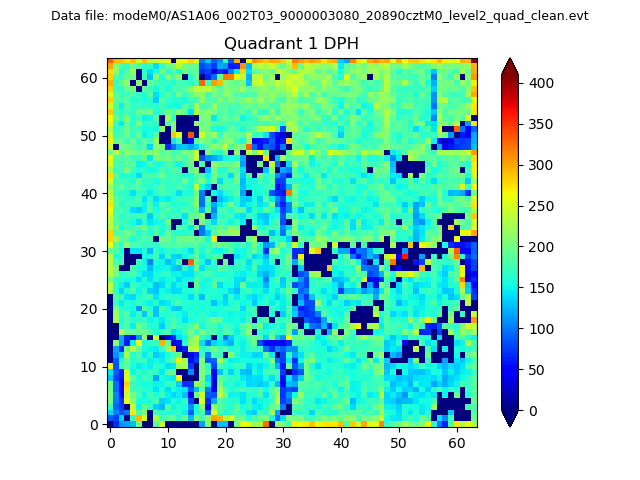 |
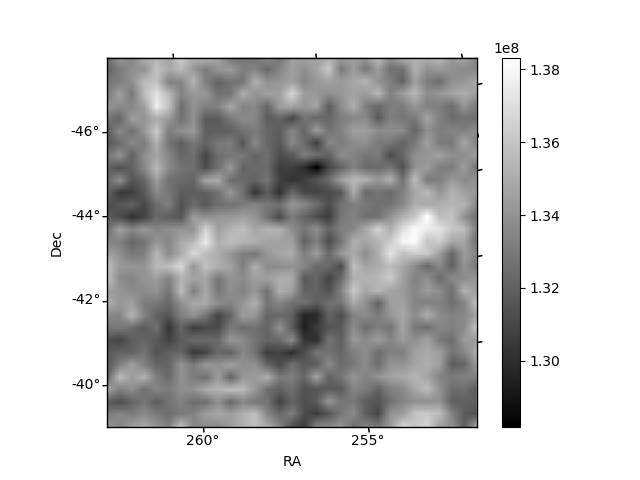
Quadrant B |
|---|---|---|---|
| Quadrant D | 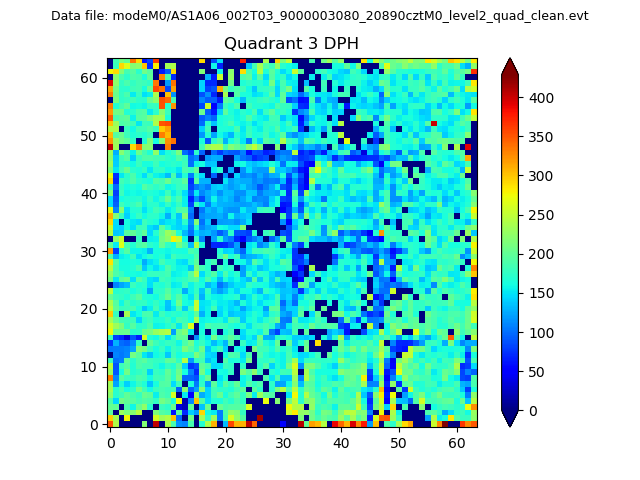 |
 |
Quadrant C |
| Plot type | Count rate plots | Images |
|---|---|---|
| Comparison with Poisson distribution Blue bars denote a histogram of data divided into 1 sec bins. Red curve is a Poisson curve with rate = median count rate of data. |
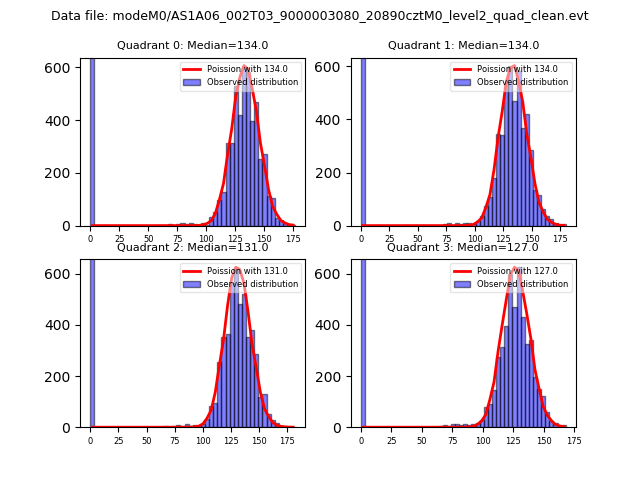 |
 |
| Quadrant-wise count rates Data is divided into 100 sec bins |
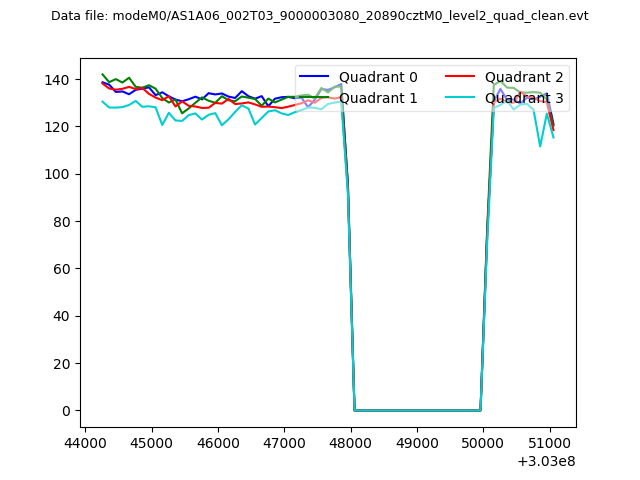 |
|
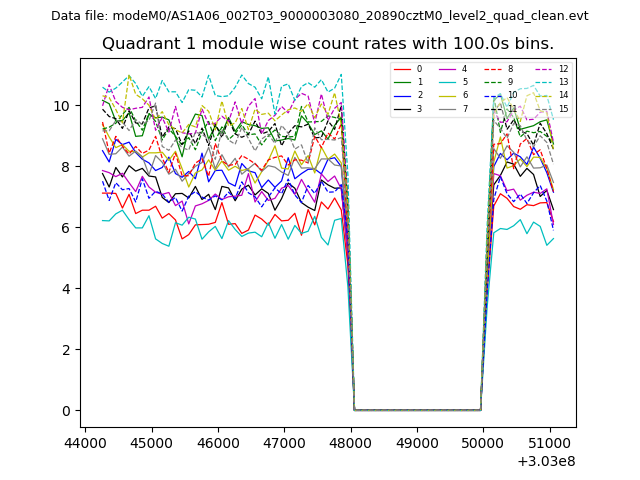
| Module-wise count rates for Quadrant A Data is divided into 100 sec bins |
 |
 |
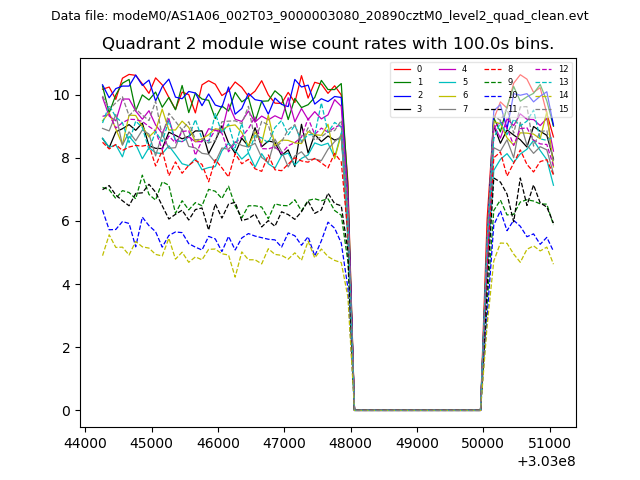
| Module-wise count rates for Quadrant B Data is divided into 100 sec bins |
 |
 |
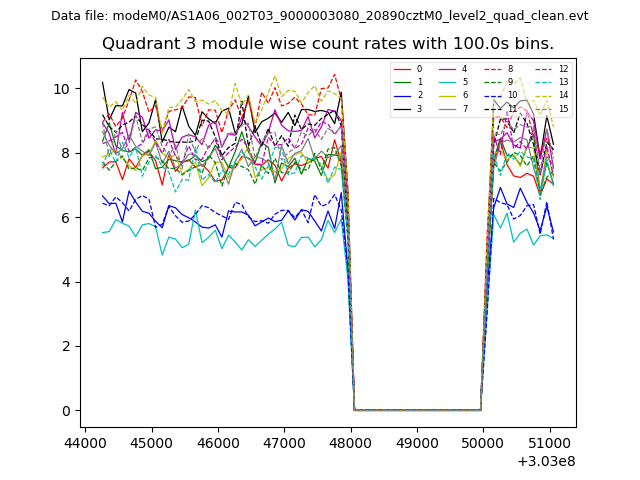
| Module-wise count rates for Quadrant C Data is divided into 100 sec bins |
 |
 |
| Module-wise count rates for Quadrant D Data is divided into 100 sec bins |
 |
 |
| Parameter | Plot |
|---|---|
| CZT HV Monitor | 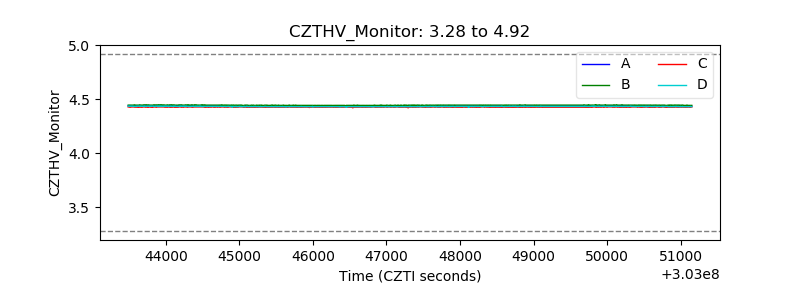 |
| D_VDD | 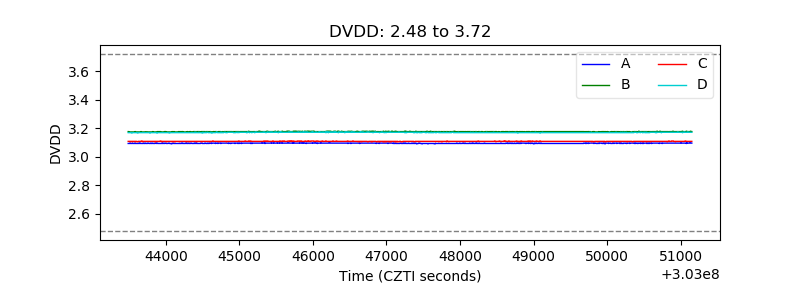 |
| Temperature 1 | 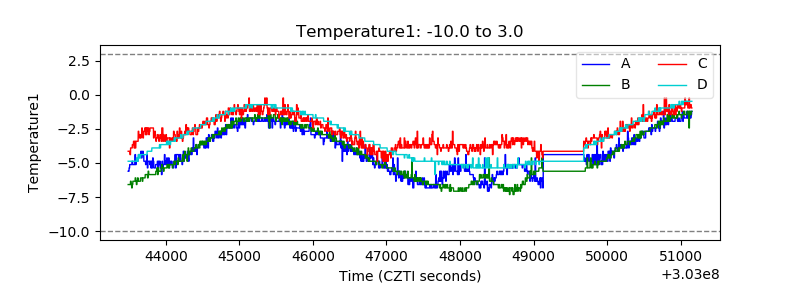 |
| Veto HV Monitor | 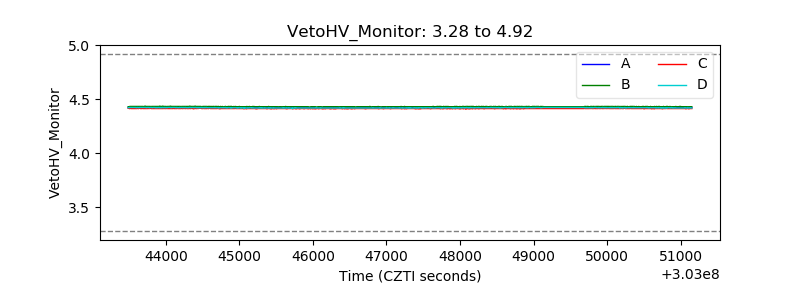 |
| Veto LLD |  |
| Alpha Counter | 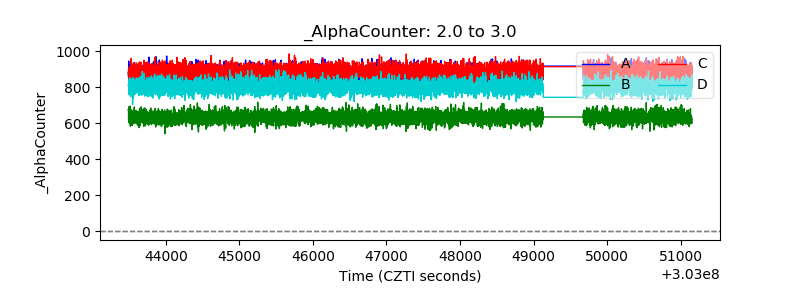 |
| _CPM_Rate | 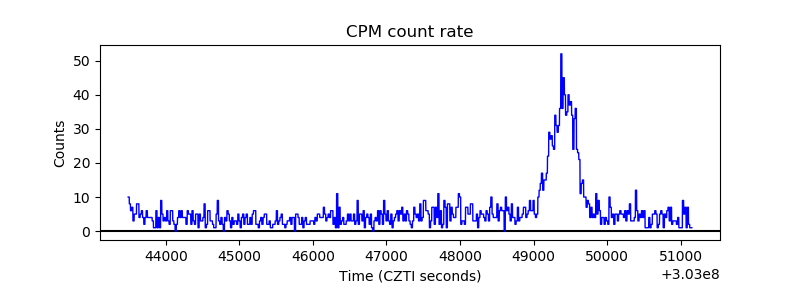 |
| CZT Counter | 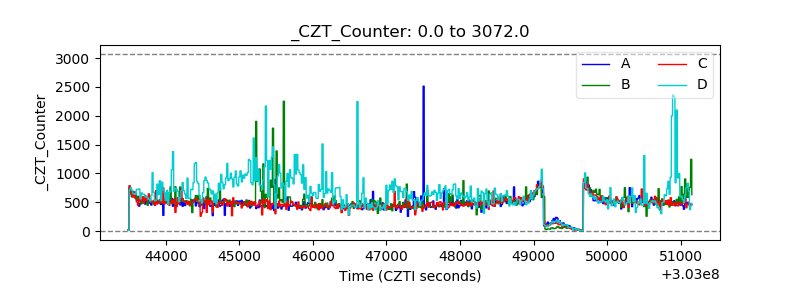 |
| +2.5 Volts monitor |  |
| +5 Volts monitor |  |
| _ROLL_ROT | 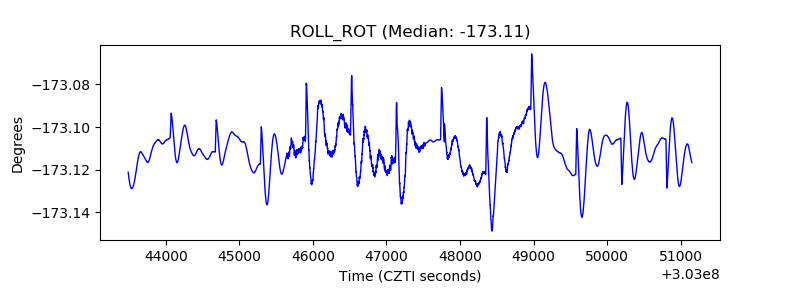 |
| _Roll_DEC | 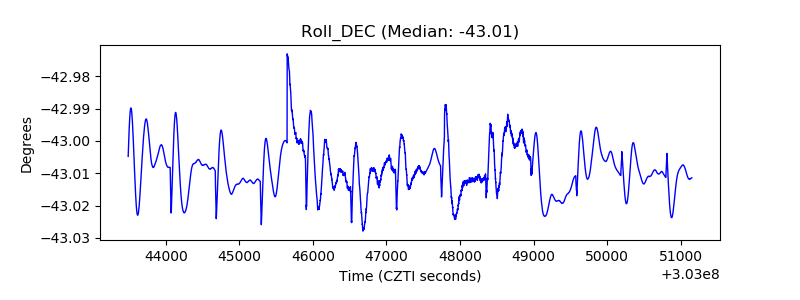 |
| _Roll_RA | 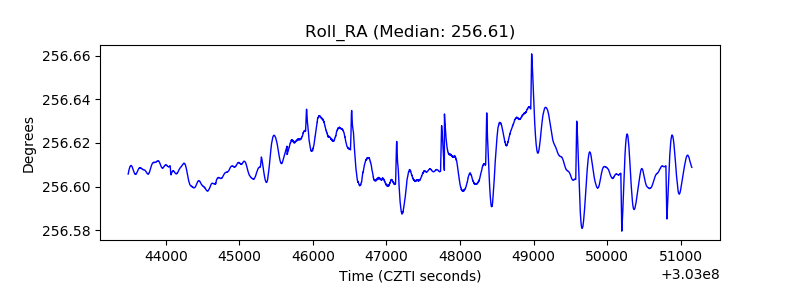 |
| Veto Counter | 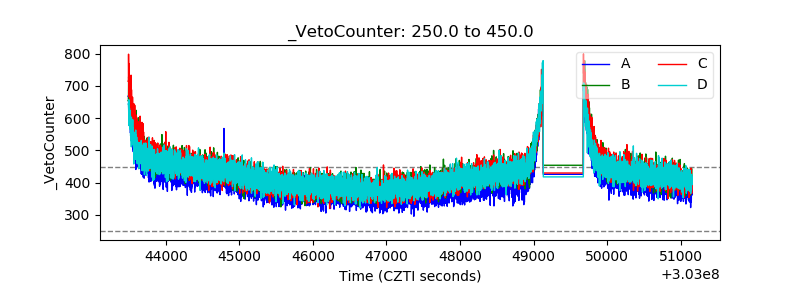 |