| Param | Original file | Final file |
|---|---|---|
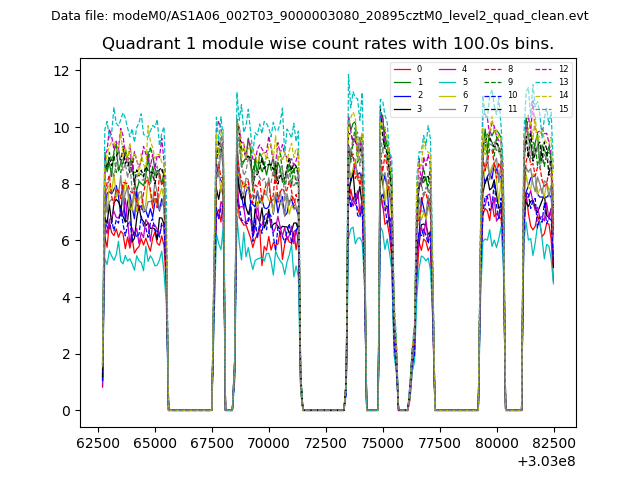
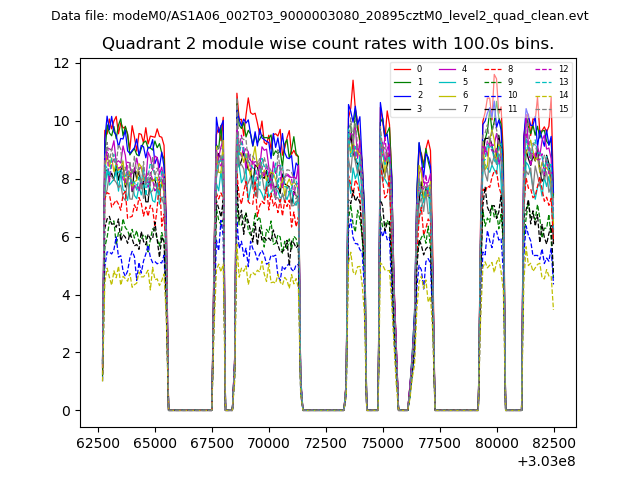
| Filename | modeM0/AS1A06_002T03_9000003080_20895cztM0_level2.evt | modeM0/AS1A06_002T03_9000003080_20895cztM0_level2_quad_clean.evt |
| Size (bytes) | 1,379,134,080 | 212,921,280 |
| Size | 1.3 GB | 203.1 MB |
| Events in quadrant A | 8,181,686 | 1,372,495 |
| Events in quadrant B | 9,039,027 | 1,372,487 |
| Events in quadrant C | 7,929,923 | 1,340,322 |
| Events in quadrant D | 15,475,687 | 1,197,137 |
| Mode M9 | |||
|---|---|---|---|
| Quadrant | BADHDUFLAG | Total packets | Discarded packets |
| A | 0 | 21 | 0 |
| B | 0 | 21 | 0 |
| C | 0 | 21 | 0 |
| D | 0 | 21 | 0 |
| Mode M0 | |||
|---|---|---|---|
| Quadrant | BADHDUFLAG | Total packets | Discarded packets |
| A | 0 | 37488 | 1935 |
| B | 0 | 40076 | 2121 |
| C | 0 | 36658 | 1886 |
| D | 0 | 60313 | 2861 |
| Mode SS | |||
|---|---|---|---|
| Quadrant | BADHDUFLAG | Total packets | Discarded packets |
| A | 0 | 360 | 16 |
| B | 0 | 361 | 19 |
| C | 0 | 359 | 19 |
| D | 0 | 360 | 20 |
| Quadrant | Total seconds | Saturated seconds | Saturation percentage |
|---|---|---|---|
| A | 16925 | 149 | 0.880355% |
| B | 16910 | 166 | 0.981668% |
| C | 16927 | 141 | 0.832989% |
| D | 16891 | 1563 | 9.253449% |
Noise dominated data is calculated using 1-second bins in cleaned event files. If a bin has >2000 counts, and if more than 50% of those come from <1% of pixels, then it is considered to be noise-dominated and hence unusable.
| Quadrant | # 1 sec bins | Bins with >0 counts | Bins with >2000 counts | High rate bins dominated by noise | Noise dominated (total time) | Noise dominated (detector-on time) | Marked lightcurve |
|---|---|---|---|---|---|---|---|
| A | 19880 | 17063 | 107 | 107 | 0.54% | 0.63% | 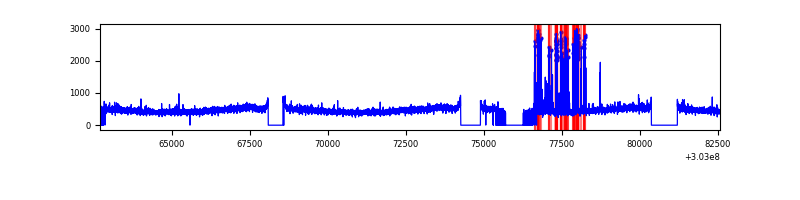 |
| B | 19851 | 17039 | 46 | 46 | 0.23% | 0.27% | 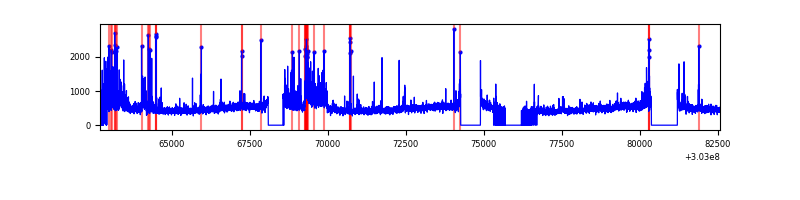 |
| C | 19861 | 17047 | 24 | 24 | 0.12% | 0.14% | 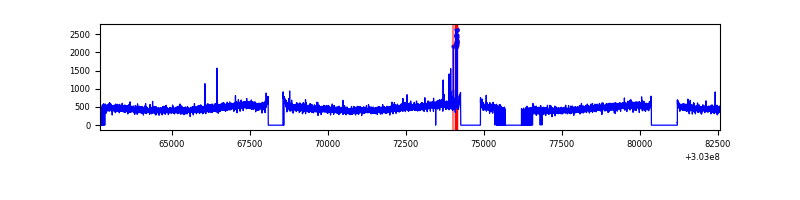 |
| D | 19818 | 17017 | 1657 | 1657 | 8.36% | 9.74% | 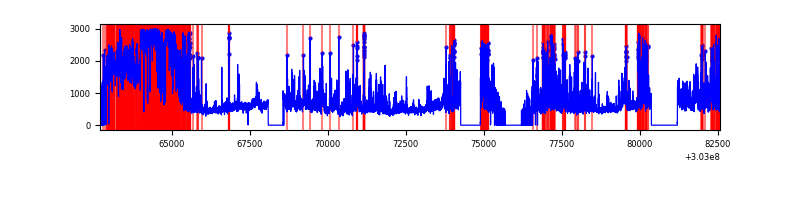 |
Top three noisy pixels from each quadrant. If the there are fewer than three noisy pixels in the level2.evt file, extra rows are filled as -1
| Pixel properties | Quadrant properties | ||||||
|---|---|---|---|---|---|---|---|
| Quadrant | DetID | PixID | Counts | Sigma | Mean | Median | Sigma |
| A | 6 | 16 | 395620 | 967.96 | 2015 | 1970 | 406.7 |
| A | 5 | 16 | 31446 | 72.48 | 2015 | 1970 | 406.7 |
| A | 0 | 226 | 17638 | 38.53 | 2015 | 1970 | 406.7 |
| B | 0 | 197 | 397902 | 1032.19 | 2008 | 1959 | 383.6 |
| B | 7 | 220 | 355743 | 922.28 | 2008 | 1959 | 383.6 |
| B | 0 | 182 | 79420 | 201.93 | 2008 | 1959 | 383.6 |
| C | 14 | 238 | 301174 | 666.44 | 1927 | 1938 | 449.0 |
| C | 9 | 54 | 91874 | 200.3 | 1927 | 1938 | 449.0 |
| C | 13 | 61 | 13427 | 25.59 | 1927 | 1938 | 449.0 |
| D | 1 | 20 | 3831610 | 8397.83 | 1877 | 1823 | 456.0 |
| D | 1 | 52 | 1757475 | 3849.73 | 1877 | 1823 | 456.0 |
| D | 12 | 235 | 1191469 | 2608.62 | 1877 | 1823 | 456.0 |
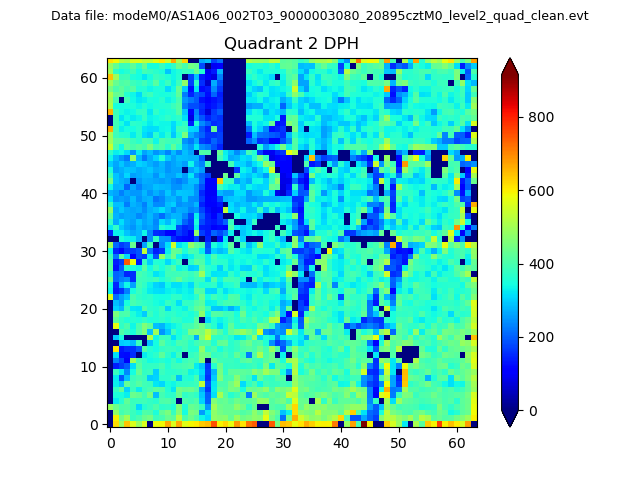
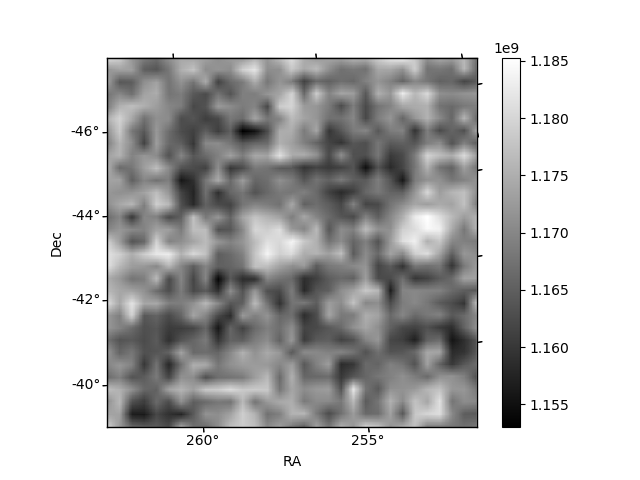
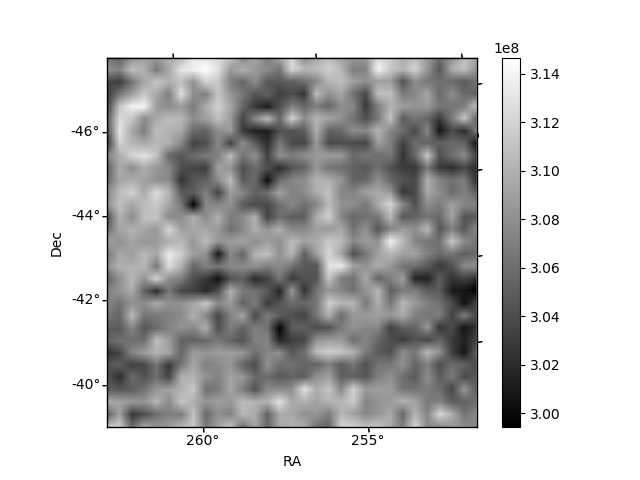
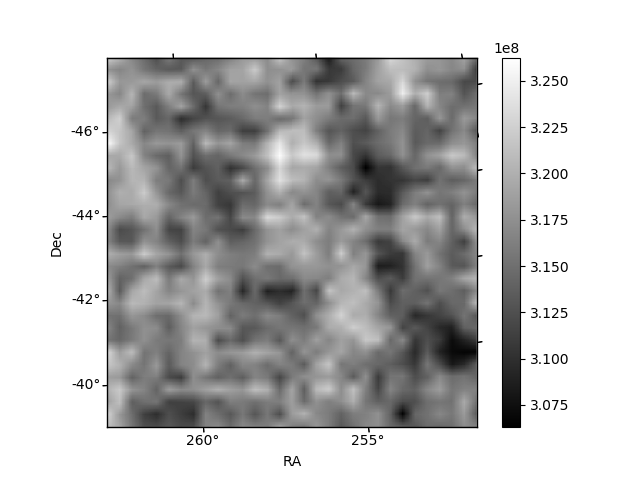
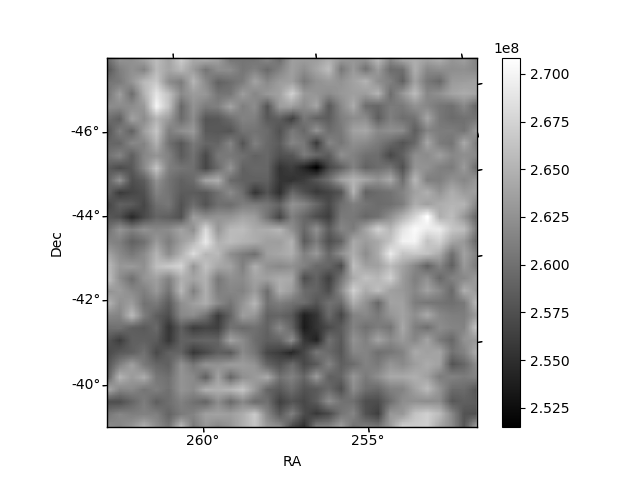
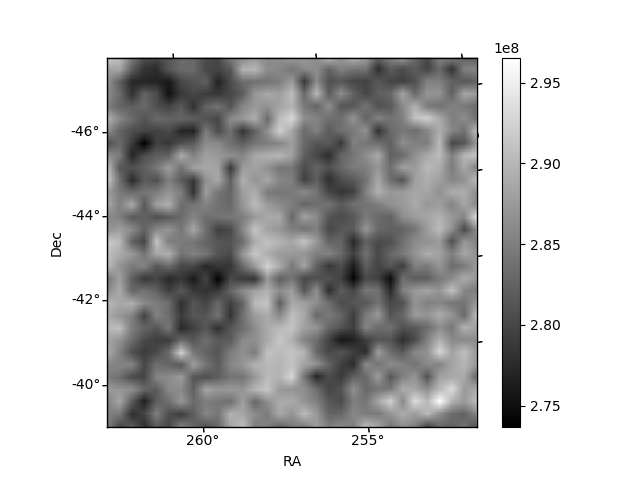
Histogram calculated using DETX and DETY for each event in the final _common_clean file
| Quadrant A | 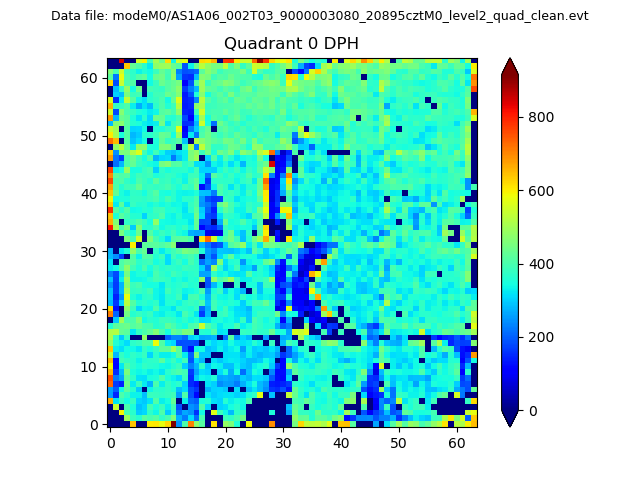 |
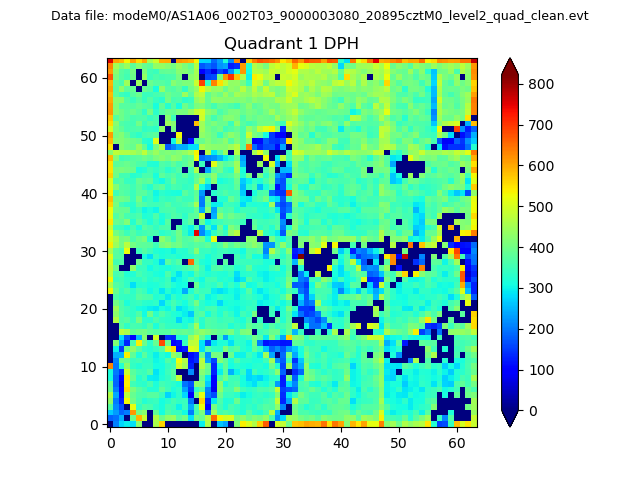 |
Quadrant B |
|---|---|---|---|
| Quadrant D | 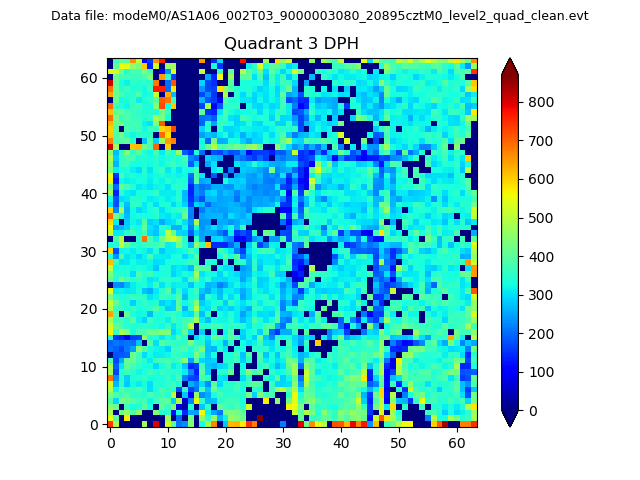 |
 |
Quadrant C |
| Plot type | Count rate plots | Images |
|---|---|---|
| Comparison with Poisson distribution Blue bars denote a histogram of data divided into 1 sec bins. Red curve is a Poisson curve with rate = median count rate of data. |
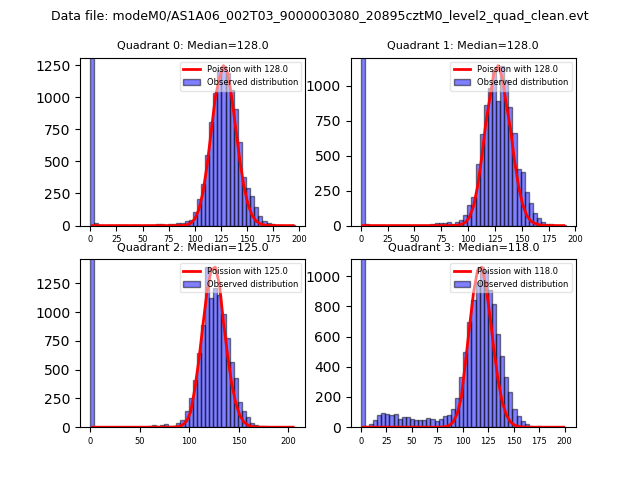 |
 |
| Quadrant-wise count rates Data is divided into 100 sec bins |
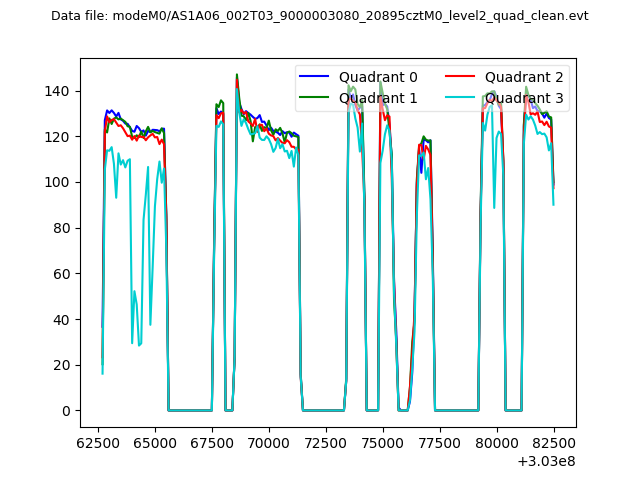 |
|
| Module-wise count rates for Quadrant A Data is divided into 100 sec bins |
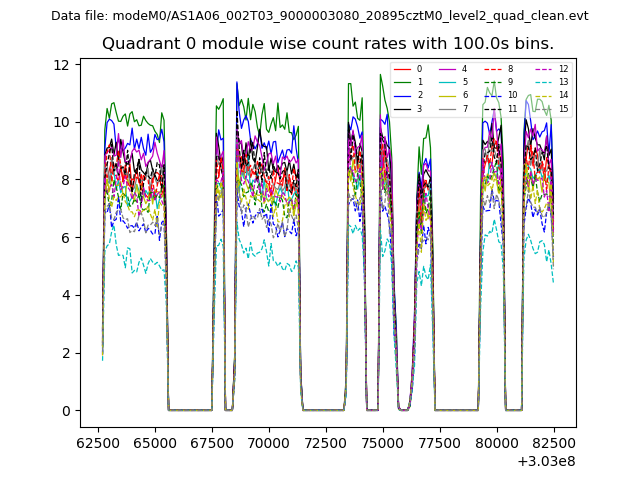 |
 |
| Module-wise count rates for Quadrant B Data is divided into 100 sec bins |
 |
 |
| Module-wise count rates for Quadrant C Data is divided into 100 sec bins |
 |
 |
| Module-wise count rates for Quadrant D Data is divided into 100 sec bins |
 |
 |
| Parameter | Plot |
|---|---|
| CZT HV Monitor | 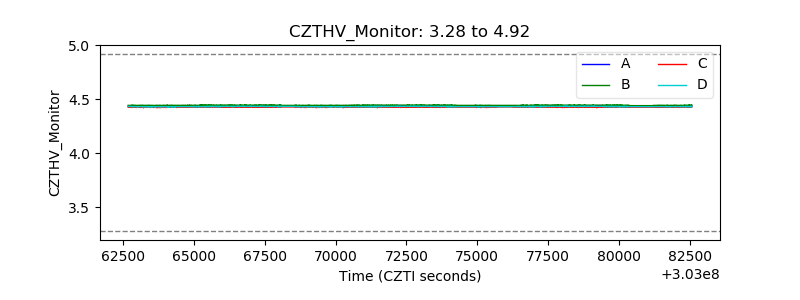 |
| D_VDD | 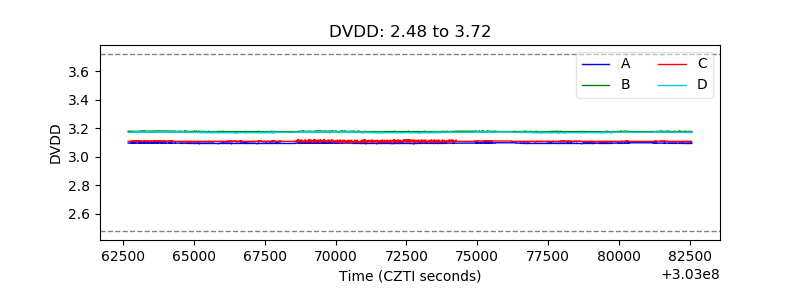 |
| Temperature 1 | 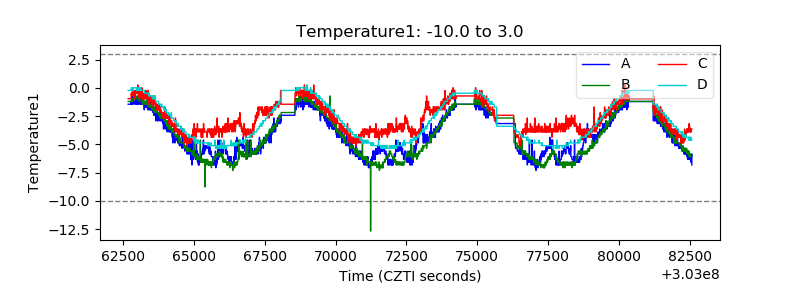 |
| Veto HV Monitor | 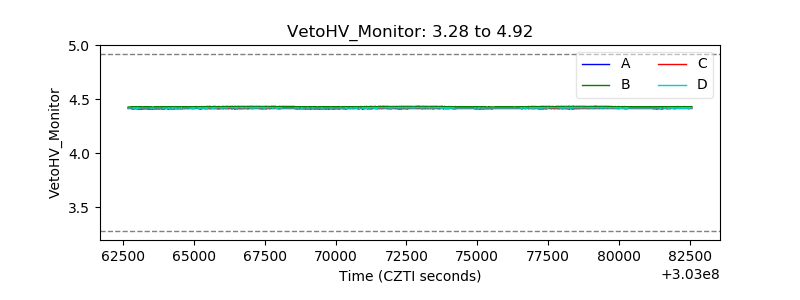 |
| Veto LLD | 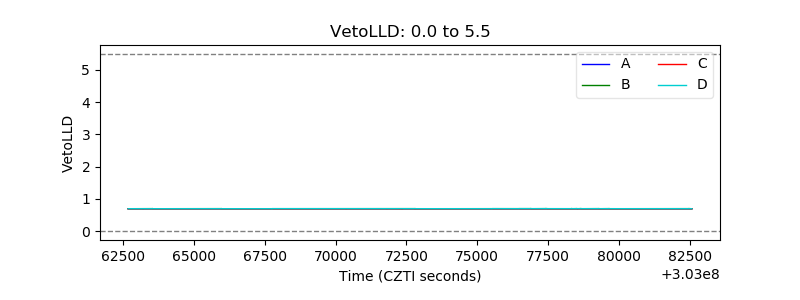 |
| Alpha Counter | 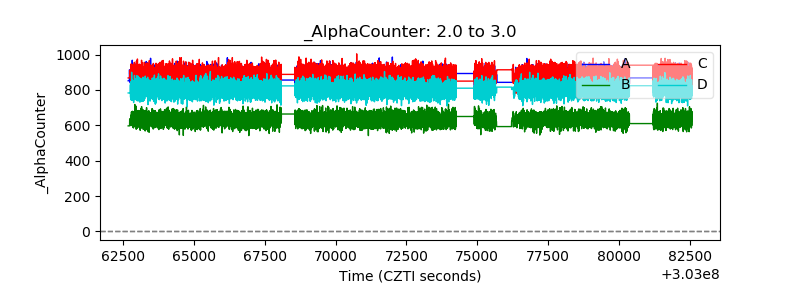 |
| _CPM_Rate | 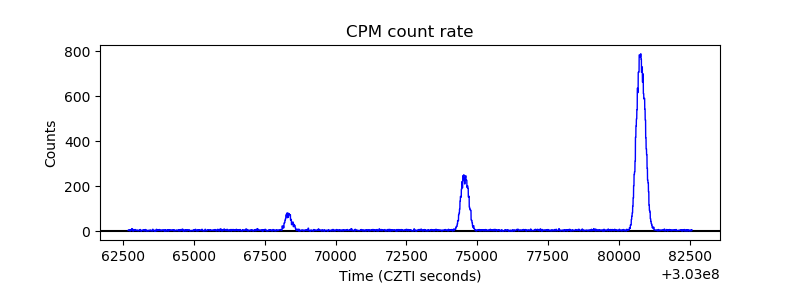 |
| CZT Counter | 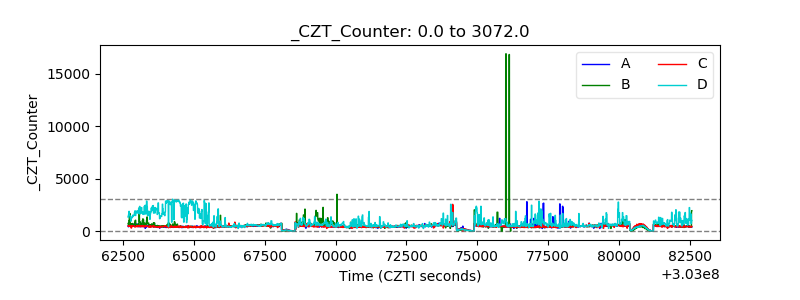 |
| +2.5 Volts monitor |  |
| +5 Volts monitor |  |
| _ROLL_ROT | 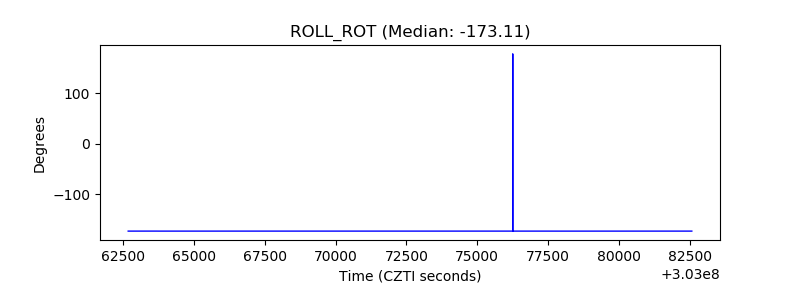 |
| _Roll_DEC |  |
| _Roll_RA | 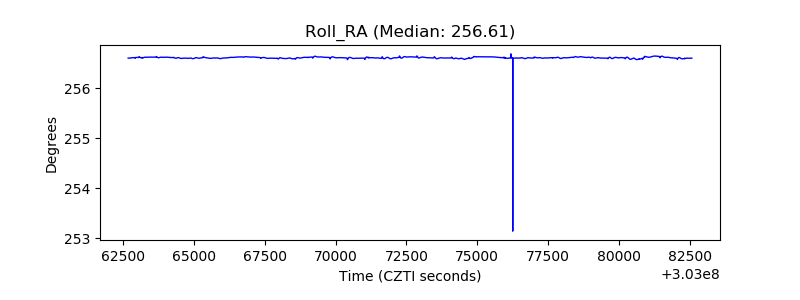 |
| Veto Counter | 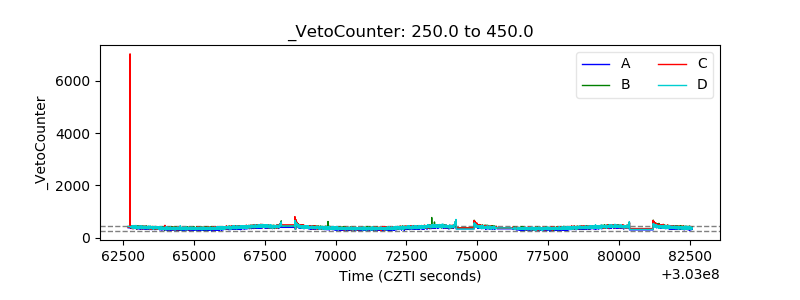 |