| Param | Original file | Final file |
|---|---|---|
| Filename | modeM0/AS1A06_002T03_9000003080_20898cztM0_level2.evt | modeM0/AS1A06_002T03_9000003080_20898cztM0_level2_quad_clean.evt |
| Size (bytes) | 455,823,360 | 90,725,760 |
| Size | 434.7 MB | 86.5 MB |
| Events in quadrant A | 3,205,997 | 575,907 |
| Events in quadrant B | 3,514,366 | 587,765 |
| Events in quadrant C | 3,196,855 | 568,727 |
| Events in quadrant D | 3,434,361 | 550,384 |
| Mode M9 | |||
|---|---|---|---|
| Quadrant | BADHDUFLAG | Total packets | Discarded packets |
| A | 0 | 18 | 0 |
| B | 0 | 18 | 0 |
| C | 0 | 19 | 0 |
| D | 0 | 19 | 0 |
| Mode M0 | |||
|---|---|---|---|
| Quadrant | BADHDUFLAG | Total packets | Discarded packets |
| A | 0 | 13835 | 8 |
| B | 0 | 14610 | 15 |
| C | 0 | 13648 | 4 |
| D | 0 | 14692 | 10 |
| Mode SS | |||
|---|---|---|---|
| Quadrant | BADHDUFLAG | Total packets | Discarded packets |
| A | 0 | 134 | 0 |
| B | 0 | 134 | 0 |
| C | 0 | 134 | 0 |
| D | 0 | 134 | 0 |
| Quadrant | Total seconds | Saturated seconds | Saturation percentage |
|---|---|---|---|
| A | 6671 | 40 | 0.599610% |
| B | 6670 | 38 | 0.569715% |
| C | 6673 | 38 | 0.569459% |
| D | 6671 | 41 | 0.614601% |
Noise dominated data is calculated using 1-second bins in cleaned event files. If a bin has >2000 counts, and if more than 50% of those come from <1% of pixels, then it is considered to be noise-dominated and hence unusable.
| Quadrant | # 1 sec bins | Bins with >0 counts | Bins with >2000 counts | High rate bins dominated by noise | Noise dominated (total time) | Noise dominated (detector-on time) | Marked lightcurve |
|---|---|---|---|---|---|---|---|
| A | 7804 | 6674 | 23 | 23 | 0.29% | 0.34% | 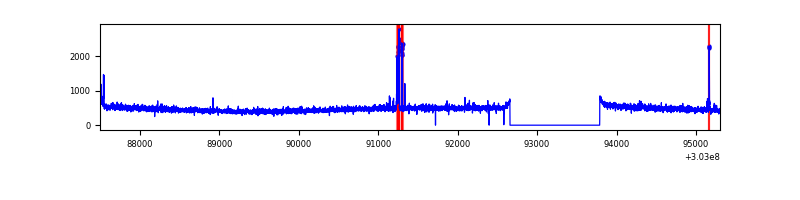 |
| B | 7804 | 6674 | 8 | 8 | 0.10% | 0.12% | 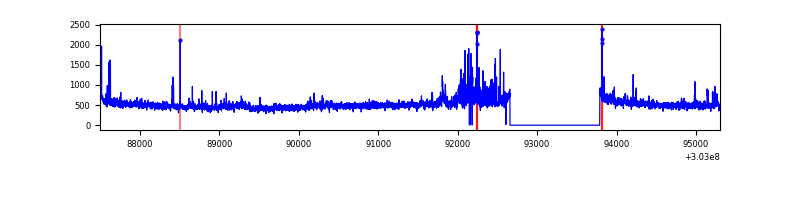 |
| C | 7804 | 6674 | 0 | 0 | 0.00% | 0.00% | 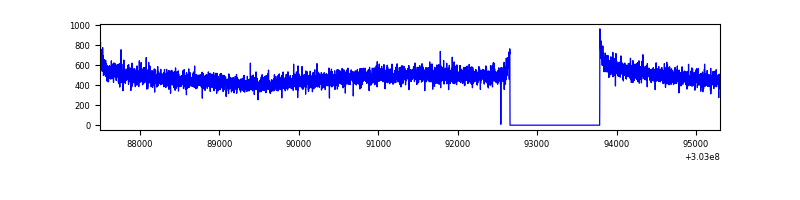 |
| D | 7804 | 6674 | 52 | 52 | 0.67% | 0.78% | 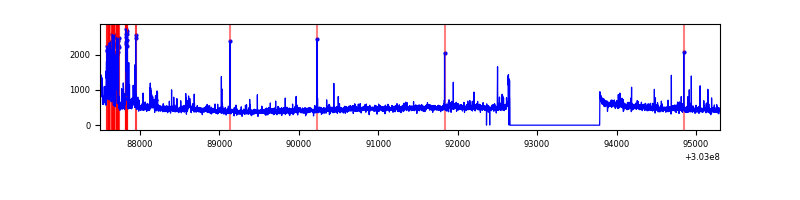 |
Top three noisy pixels from each quadrant. If the there are fewer than three noisy pixels in the level2.evt file, extra rows are filled as -1
| Pixel properties | Quadrant properties | ||||||
|---|---|---|---|---|---|---|---|
| Quadrant | DetID | PixID | Counts | Sigma | Mean | Median | Sigma |
| A | 15 | 174 | 66263 | 397.7 | 812 | 797 | 164.6 |
| A | 5 | 16 | 20249 | 118.17 | 812 | 797 | 164.6 |
| A | 0 | 226 | 6955 | 37.41 | 812 | 797 | 164.6 |
| B | 7 | 220 | 137629 | 888.35 | 818 | 800 | 154.0 |
| B | 0 | 189 | 53630 | 343.0 | 818 | 800 | 154.0 |
| B | 0 | 229 | 35088 | 222.61 | 818 | 800 | 154.0 |
| C | 14 | 238 | 126709 | 687.87 | 786 | 792 | 183.1 |
| C | 13 | 61 | 5571 | 26.11 | 786 | 792 | 183.1 |
| C | 9 | 54 | 2221 | 7.81 | 786 | 792 | 183.1 |
| D | 5 | 222 | 196494 | 1027.86 | 787 | 767 | 190.4 |
| D | 1 | 20 | 110459 | 576.05 | 787 | 767 | 190.4 |
| D | 1 | 52 | 58261 | 301.93 | 787 | 767 | 190.4 |
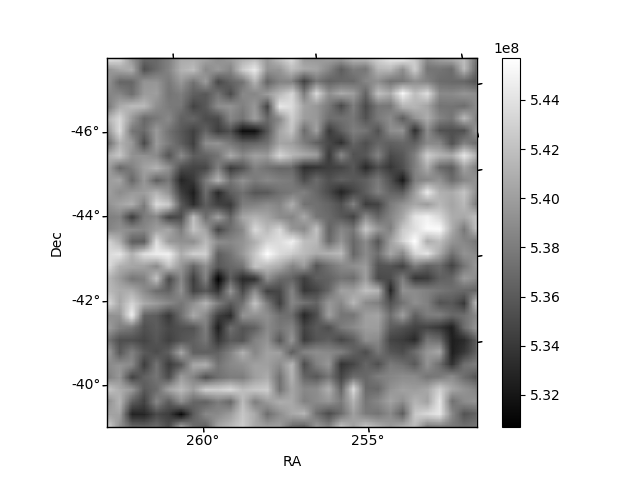
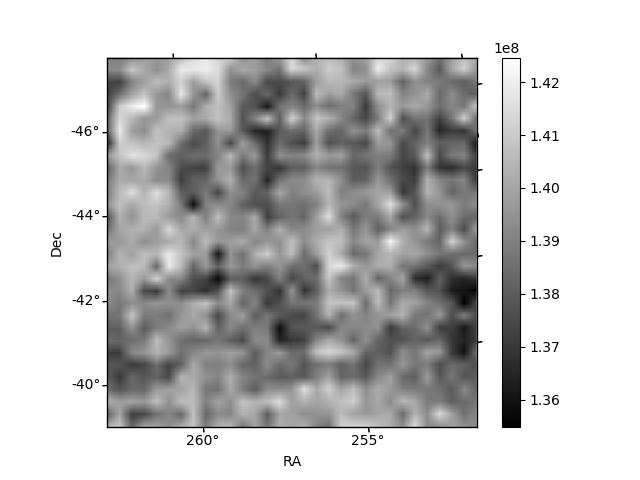
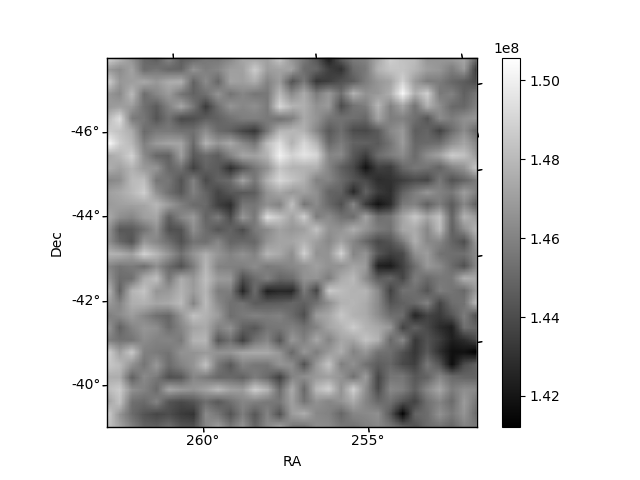
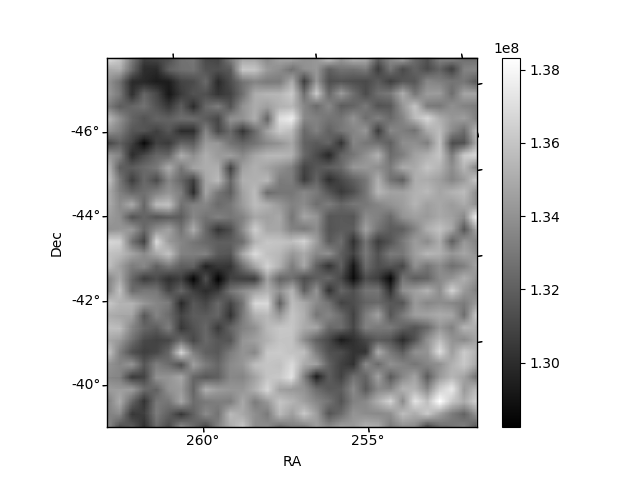
Histogram calculated using DETX and DETY for each event in the final _common_clean file
| Quadrant A | 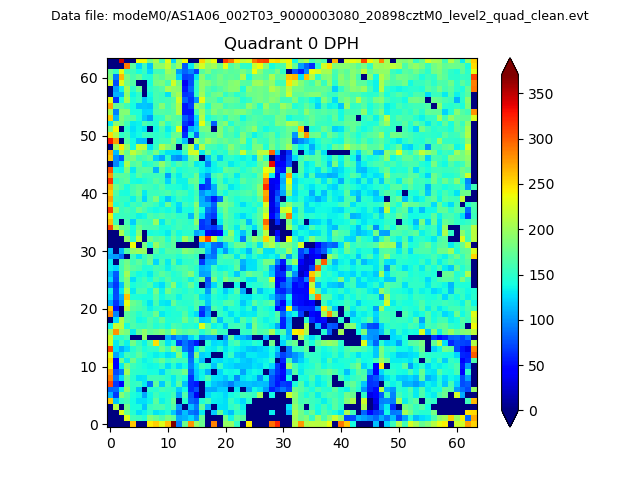 |
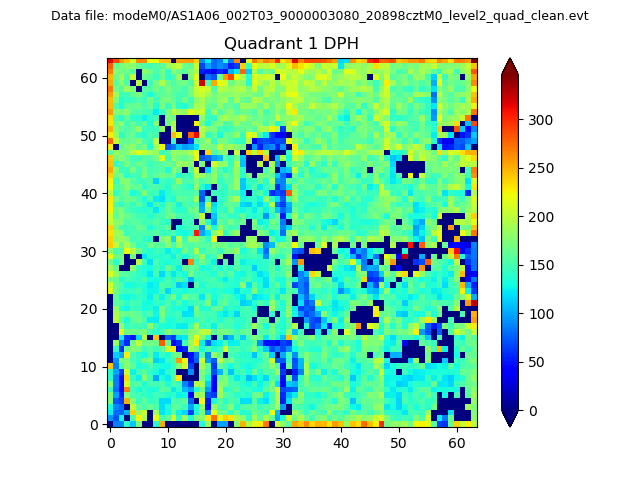 |
Quadrant B |
|---|---|---|---|
| Quadrant D | 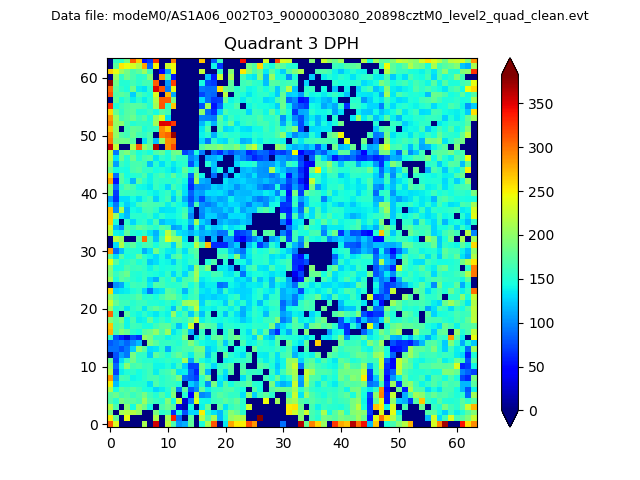 |
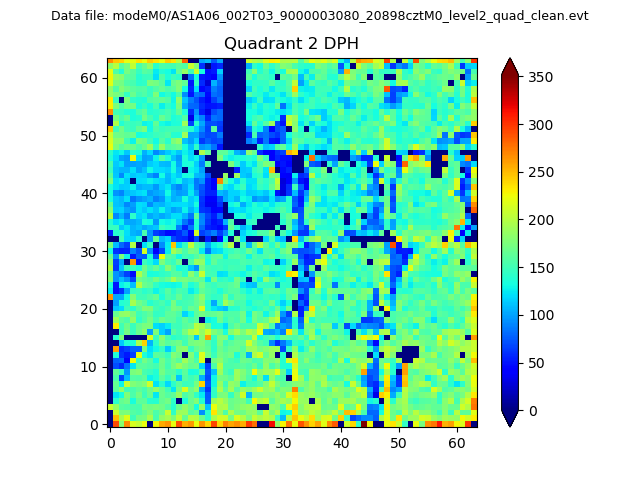 |
Quadrant C |
| Plot type | Count rate plots | Images |
|---|---|---|
| Comparison with Poisson distribution Blue bars denote a histogram of data divided into 1 sec bins. Red curve is a Poisson curve with rate = median count rate of data. |
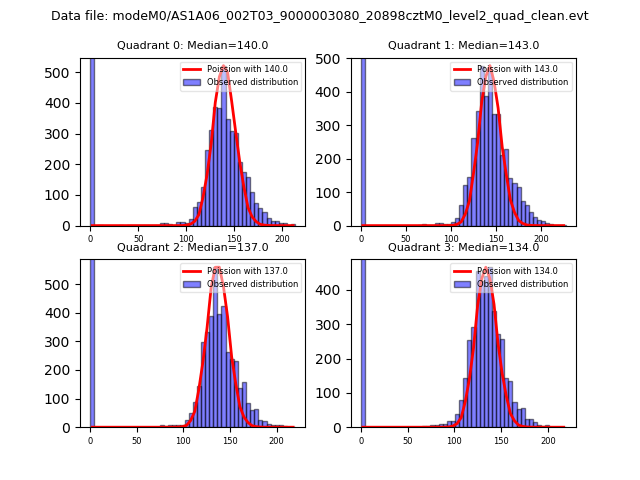 |
 |
| Quadrant-wise count rates Data is divided into 100 sec bins |
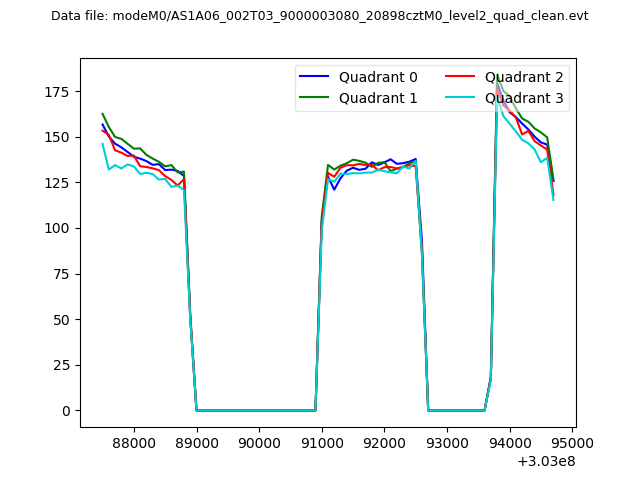 |
|
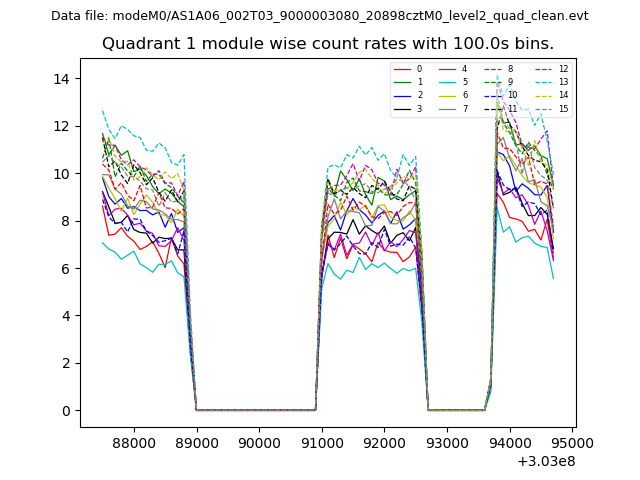
| Module-wise count rates for Quadrant A Data is divided into 100 sec bins |
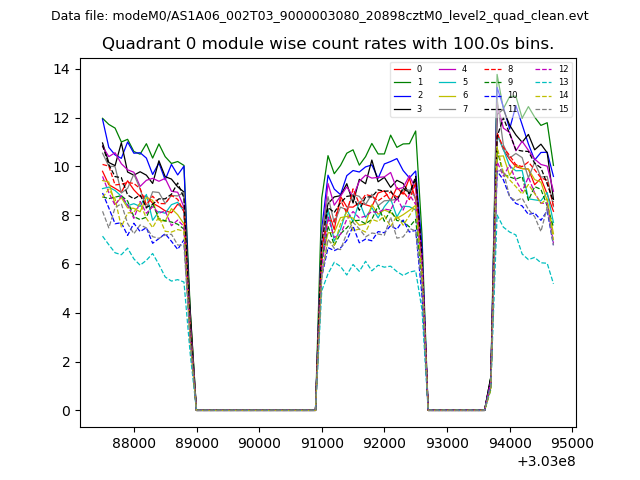 |
 |
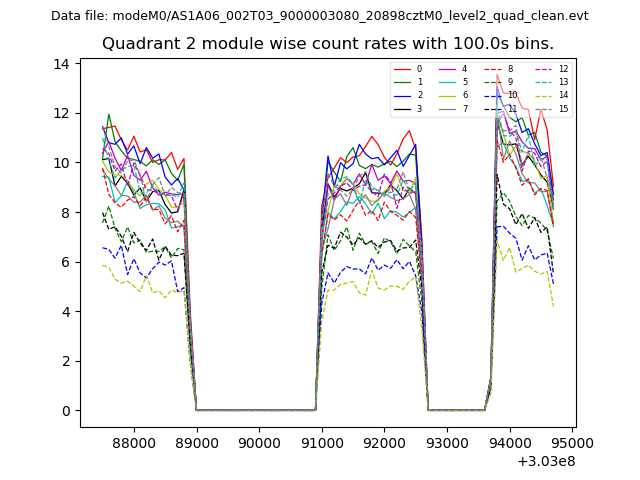
| Module-wise count rates for Quadrant B Data is divided into 100 sec bins |
 |
 |
| Module-wise count rates for Quadrant C Data is divided into 100 sec bins |
 |
 |
| Module-wise count rates for Quadrant D Data is divided into 100 sec bins |
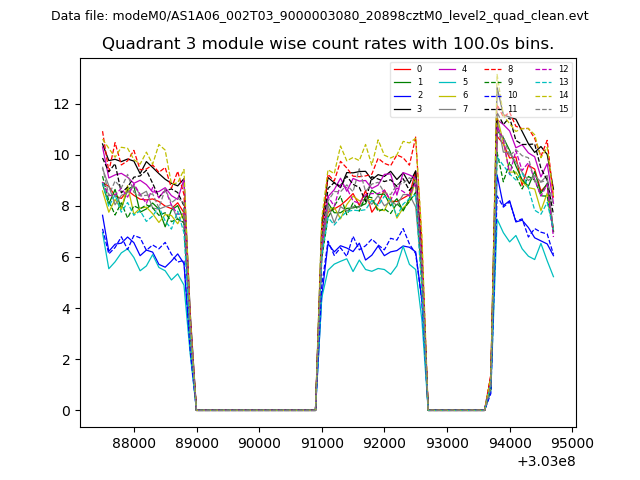 |
 |
| Parameter | Plot |
|---|---|
| CZT HV Monitor | 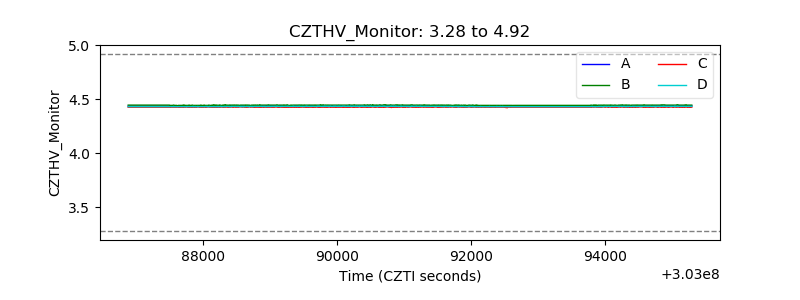 |
| D_VDD | 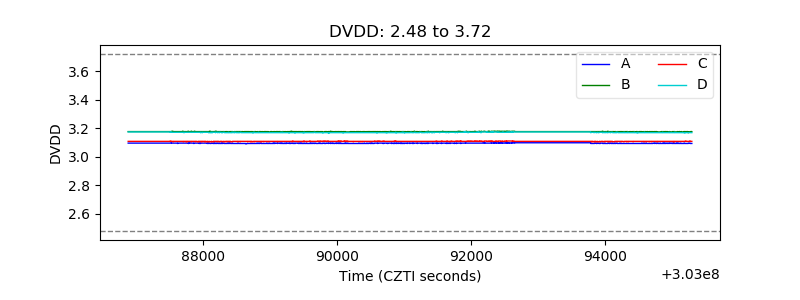 |
| Temperature 1 | 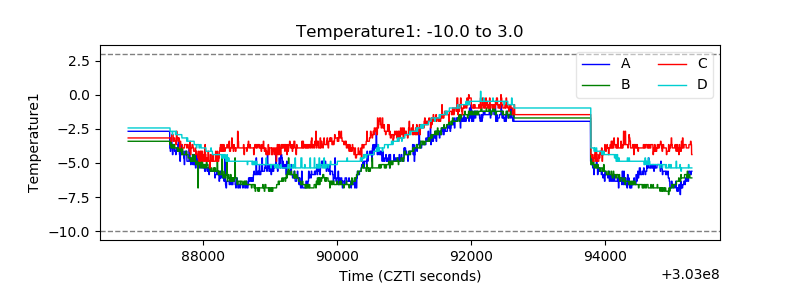 |
| Veto HV Monitor | 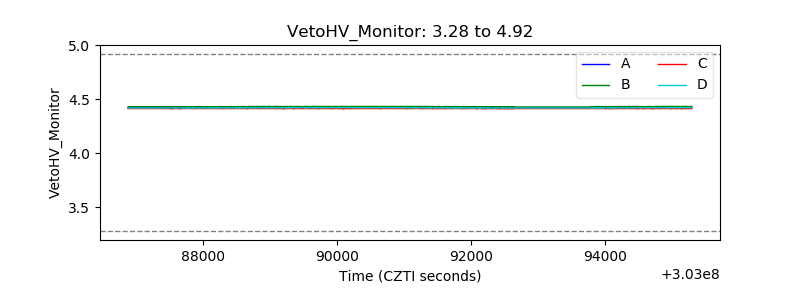 |
| Veto LLD | 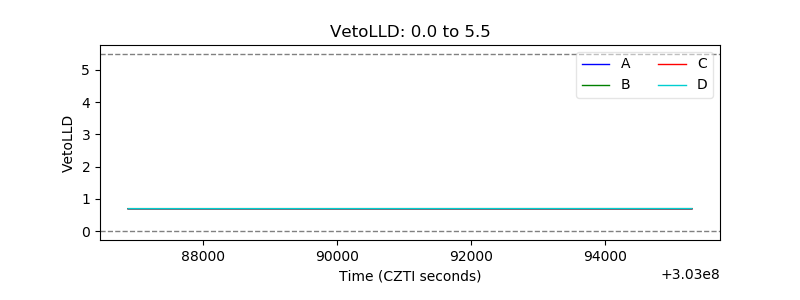 |
| Alpha Counter | 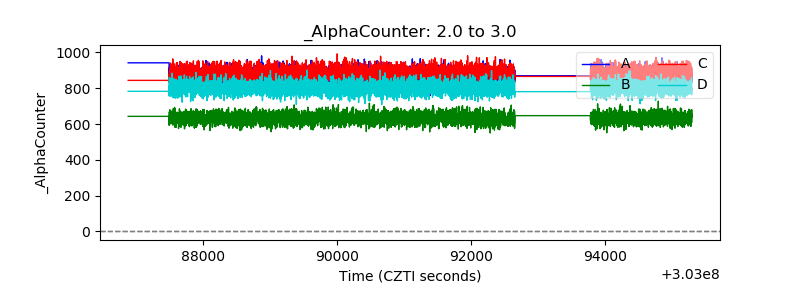 |
| _CPM_Rate | 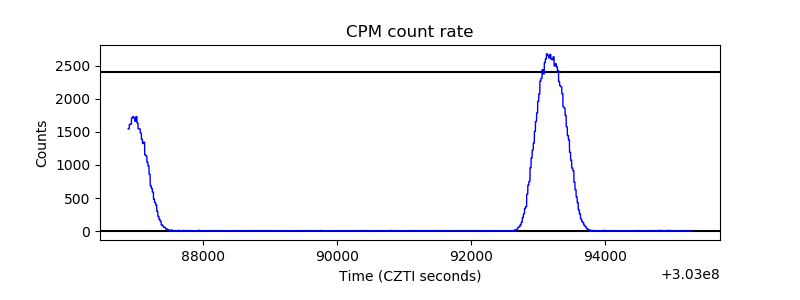 |
| CZT Counter | 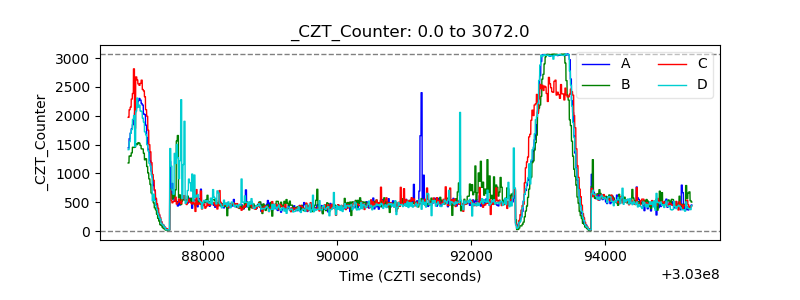 |
| +2.5 Volts monitor |  |
| +5 Volts monitor |  |
| _ROLL_ROT | 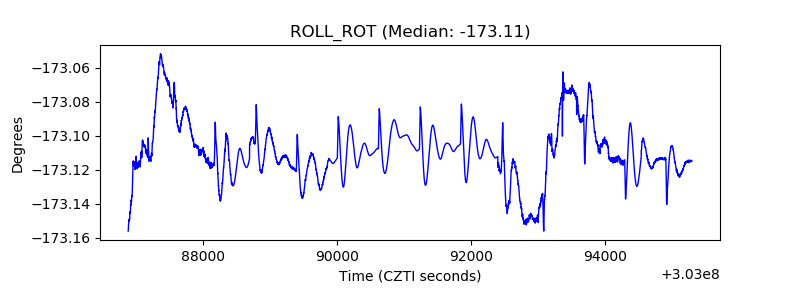 |
| _Roll_DEC |  |
| _Roll_RA | 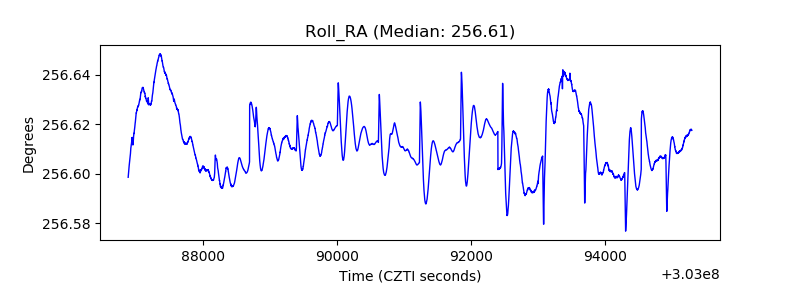 |
| Veto Counter |  |