| Param | Original file | Final file |
|---|---|---|
| Filename | modeM0/AS1A06_002T03_9000003080_20900cztM0_level2.evt | modeM0/AS1A06_002T03_9000003080_20900cztM0_level2_quad_clean.evt |
| Size (bytes) | 504,843,840 | 74,275,200 |
| Size | 481.5 MB | 70.8 MB |
| Events in quadrant A | 3,250,572 | 458,887 |
| Events in quadrant B | 3,624,719 | 465,519 |
| Events in quadrant C | 3,333,209 | 457,402 |
| Events in quadrant D | 4,655,996 | 430,011 |
| Mode M9 | |||
|---|---|---|---|
| Quadrant | BADHDUFLAG | Total packets | Discarded packets |
| A | 0 | 18 | 0 |
| B | 0 | 19 | 0 |
| C | 0 | 19 | 0 |
| D | 0 | 19 | 0 |
| Mode M0 | |||
|---|---|---|---|
| Quadrant | BADHDUFLAG | Total packets | Discarded packets |
| A | 0 | 13328 | 1 |
| B | 0 | 14584 | 1 |
| C | 0 | 13581 | 1 |
| D | 0 | 17769 | 1 |
| Mode SS | |||
|---|---|---|---|
| Quadrant | BADHDUFLAG | Total packets | Discarded packets |
| A | 0 | 126 | 0 |
| B | 0 | 126 | 0 |
| C | 0 | 126 | 0 |
| D | 0 | 126 | 0 |
| Quadrant | Total seconds | Saturated seconds | Saturation percentage |
|---|---|---|---|
| A | 6267 | 44 | 0.702090% |
| B | 6266 | 99 | 1.579955% |
| C | 6266 | 89 | 1.420364% |
| D | 6266 | 414 | 6.607086% |
Noise dominated data is calculated using 1-second bins in cleaned event files. If a bin has >2000 counts, and if more than 50% of those come from <1% of pixels, then it is considered to be noise-dominated and hence unusable.
| Quadrant | # 1 sec bins | Bins with >0 counts | Bins with >2000 counts | High rate bins dominated by noise | Noise dominated (total time) | Noise dominated (detector-on time) | Marked lightcurve |
|---|---|---|---|---|---|---|---|
| A | 7598 | 6269 | 3 | 3 | 0.04% | 0.05% | 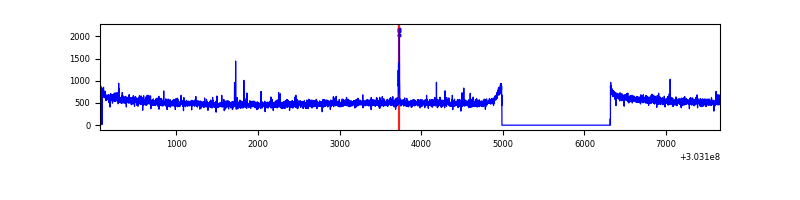 |
| B | 7597 | 6268 | 28 | 28 | 0.37% | 0.45% | 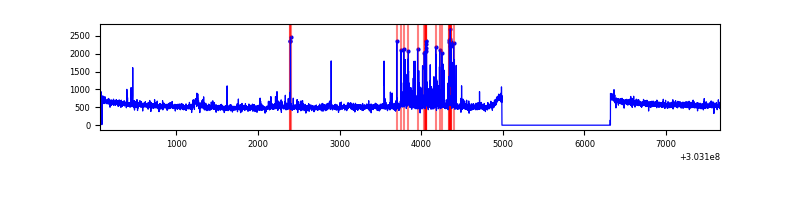 |
| C | 7597 | 6268 | 0 | 0 | 0.00% | 0.00% | 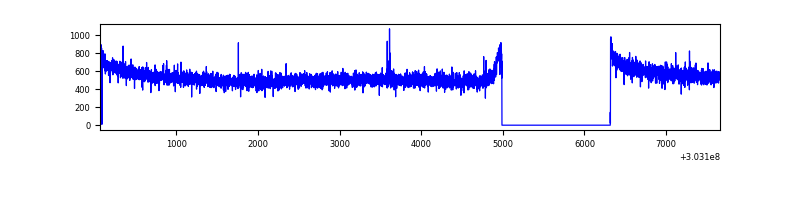 |
| D | 7597 | 6268 | 358 | 358 | 4.71% | 5.71% | 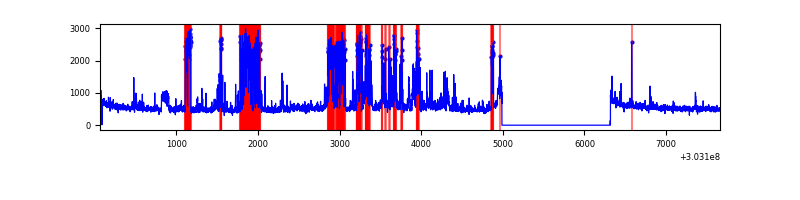 |
Top three noisy pixels from each quadrant. If the there are fewer than three noisy pixels in the level2.evt file, extra rows are filled as -1
| Pixel properties | Quadrant properties | ||||||
|---|---|---|---|---|---|---|---|
| Quadrant | DetID | PixID | Counts | Sigma | Mean | Median | Sigma |
| A | 15 | 174 | 15093 | 86.76 | 838 | 824 | 164.5 |
| A | 6 | 16 | 12157 | 68.9 | 838 | 824 | 164.5 |
| A | 0 | 226 | 7202 | 38.78 | 838 | 824 | 164.5 |
| B | 7 | 220 | 211896 | 1363.55 | 842 | 823 | 154.8 |
| B | 0 | 230 | 48589 | 308.57 | 842 | 823 | 154.8 |
| B | 0 | 219 | 36739 | 232.02 | 842 | 823 | 154.8 |
| C | 14 | 238 | 132127 | 700.96 | 820 | 829 | 187.3 |
| C | 13 | 61 | 5660 | 25.79 | 820 | 829 | 187.3 |
| C | 9 | 54 | 3578 | 14.68 | 820 | 829 | 187.3 |
| D | 1 | 52 | 1092830 | 5702.28 | 805 | 785 | 191.5 |
| D | 7 | 223 | 187523 | 975.08 | 805 | 785 | 191.5 |
| D | 5 | 222 | 133899 | 695.07 | 805 | 785 | 191.5 |
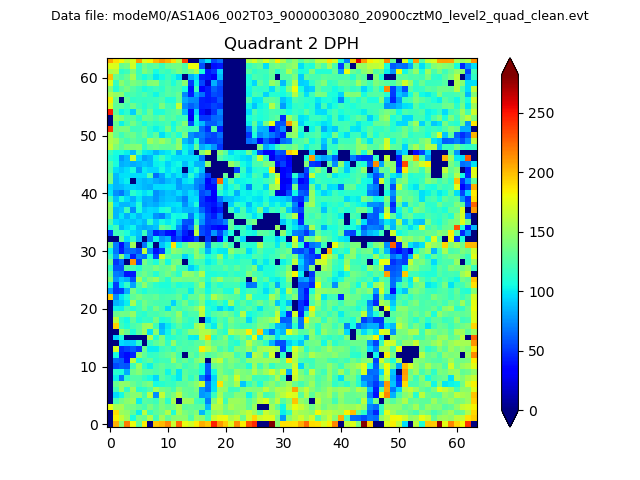
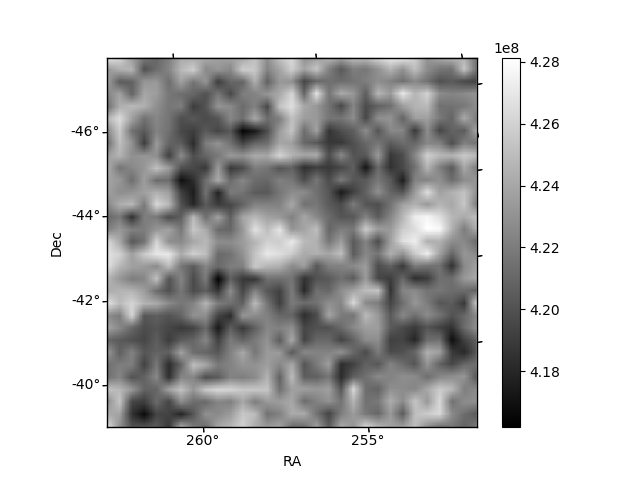
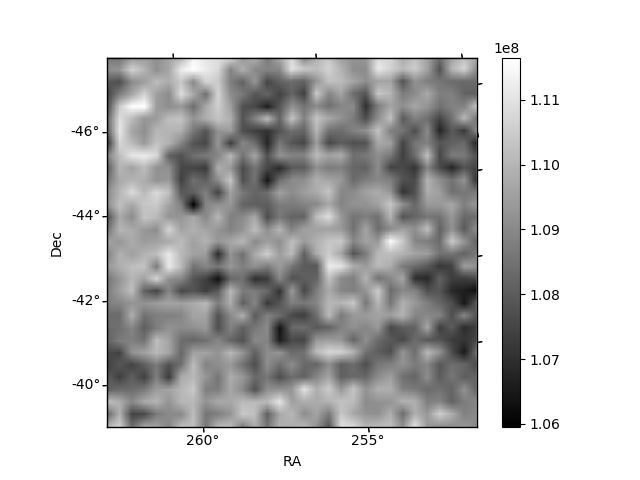
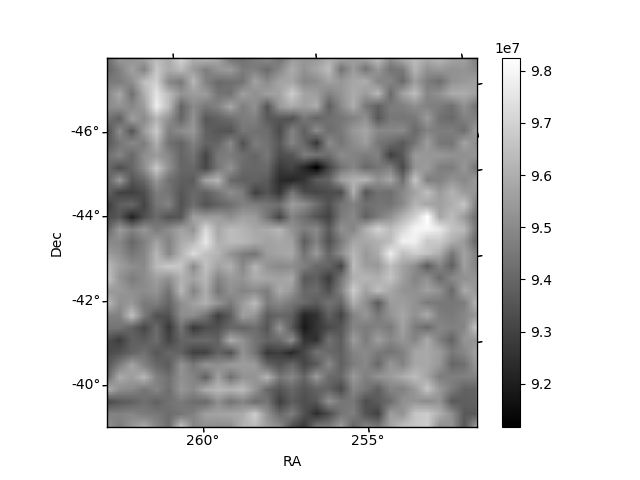
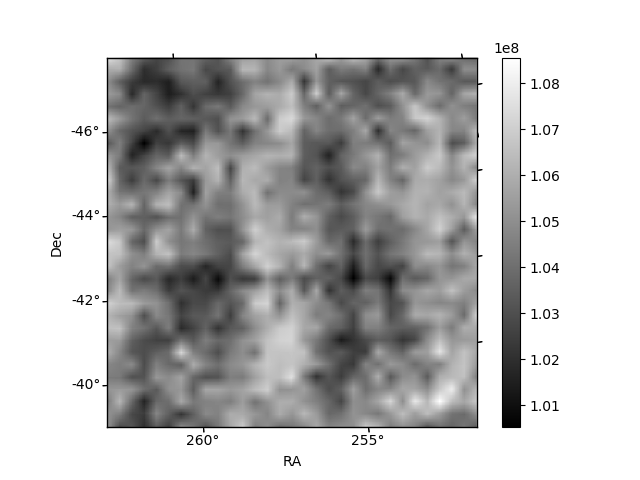
Histogram calculated using DETX and DETY for each event in the final _common_clean file
| Quadrant A | 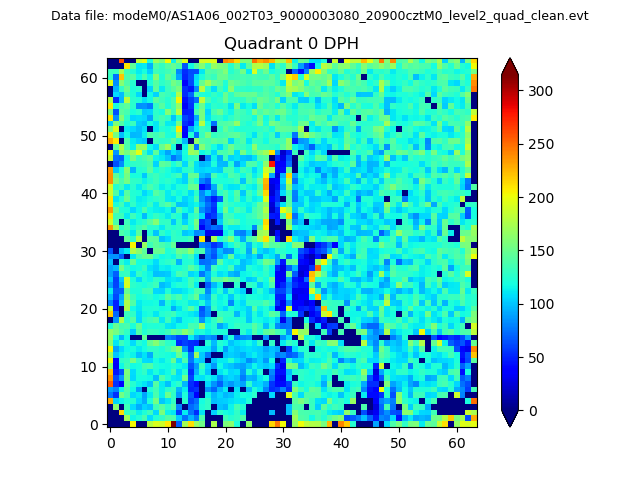 |
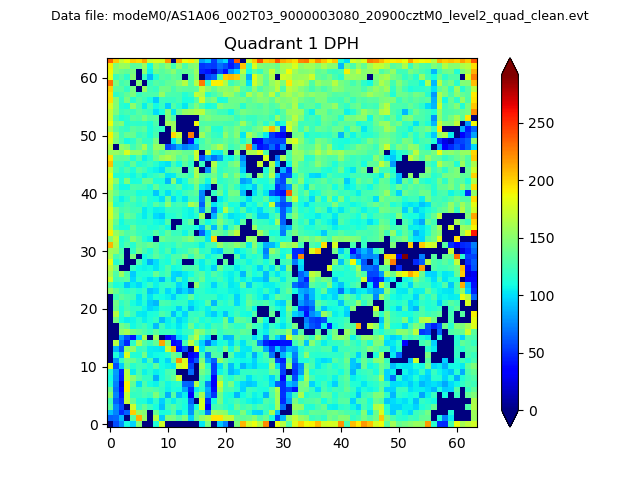 |
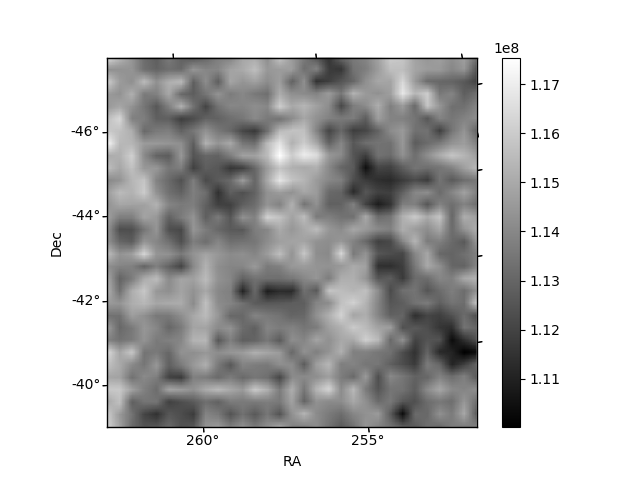
Quadrant B |
|---|---|---|---|
| Quadrant D | 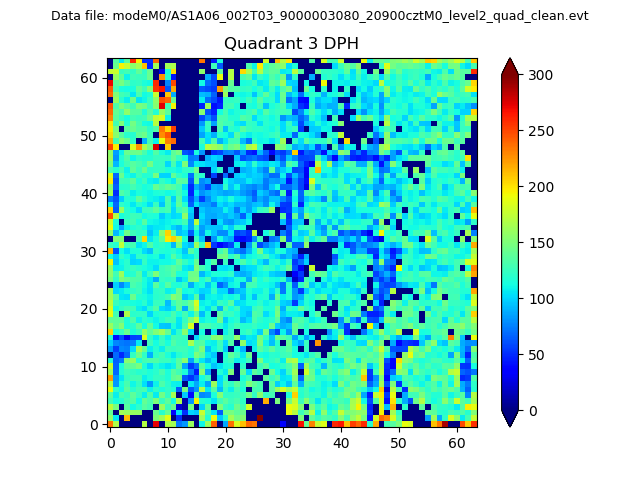 |
 |
Quadrant C |
| Plot type | Count rate plots | Images |
|---|---|---|
| Comparison with Poisson distribution Blue bars denote a histogram of data divided into 1 sec bins. Red curve is a Poisson curve with rate = median count rate of data. |
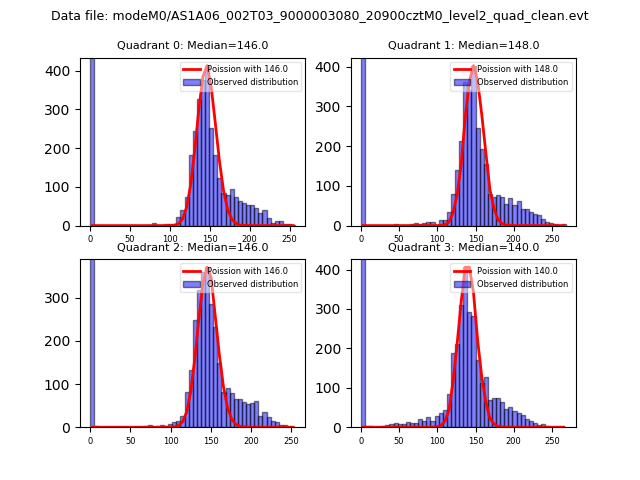 |
 |
| Quadrant-wise count rates Data is divided into 100 sec bins |
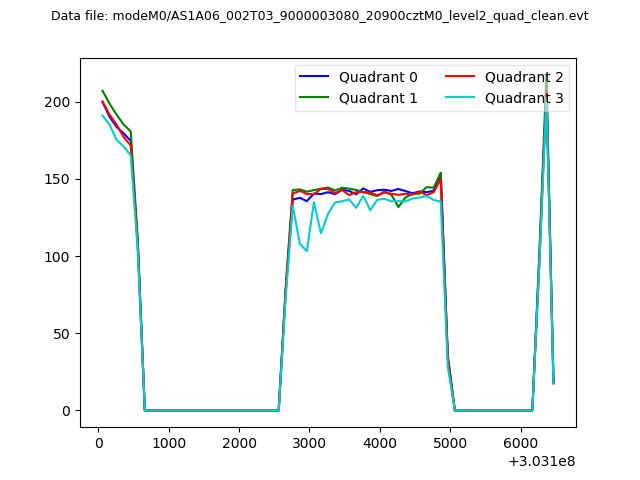 |
|
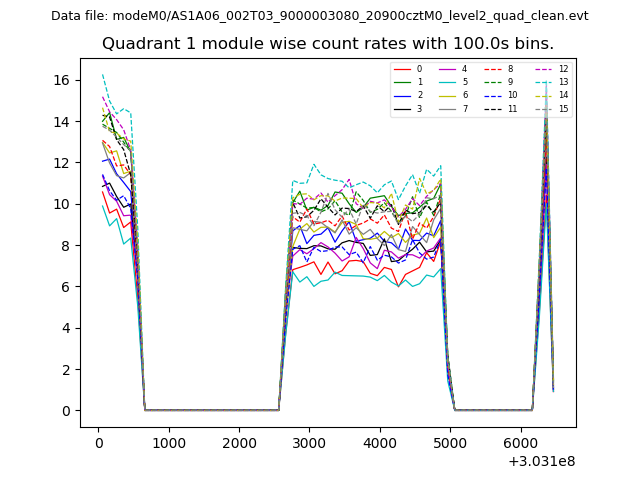
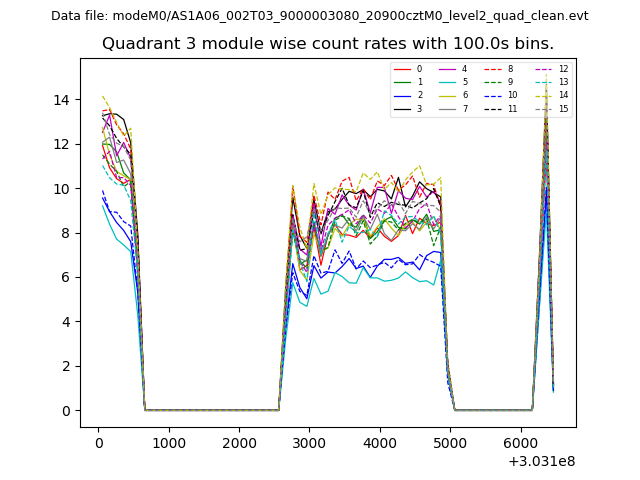
| Module-wise count rates for Quadrant A Data is divided into 100 sec bins |
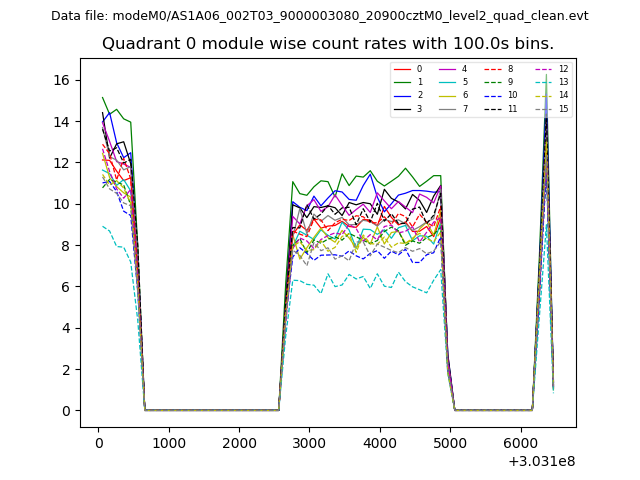 |
 |
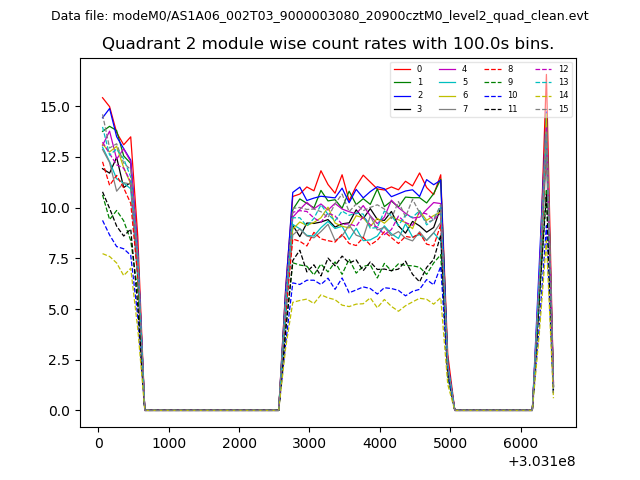
| Module-wise count rates for Quadrant B Data is divided into 100 sec bins |
 |
 |
| Module-wise count rates for Quadrant C Data is divided into 100 sec bins |
 |
 |
| Module-wise count rates for Quadrant D Data is divided into 100 sec bins |
 |
 |
| Parameter | Plot |
|---|---|
| CZT HV Monitor | 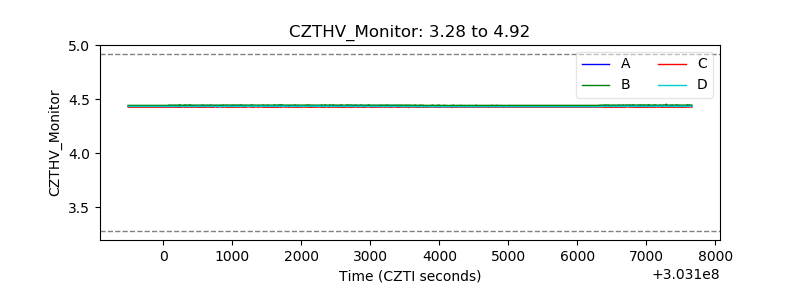 |
| D_VDD | 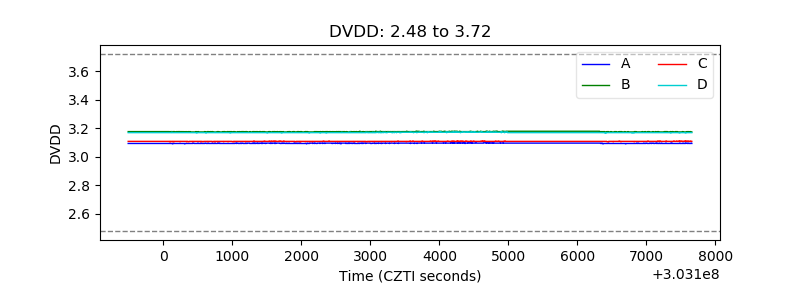 |
| Temperature 1 | 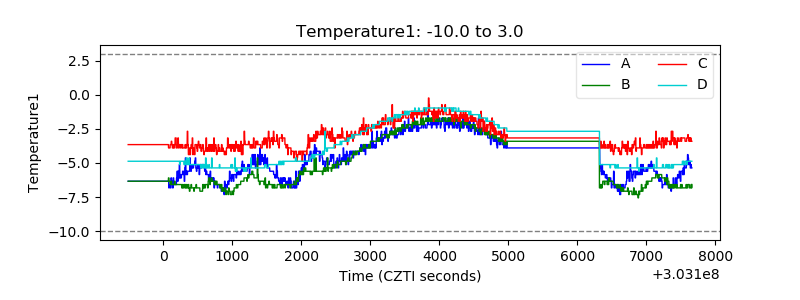 |
| Veto HV Monitor | 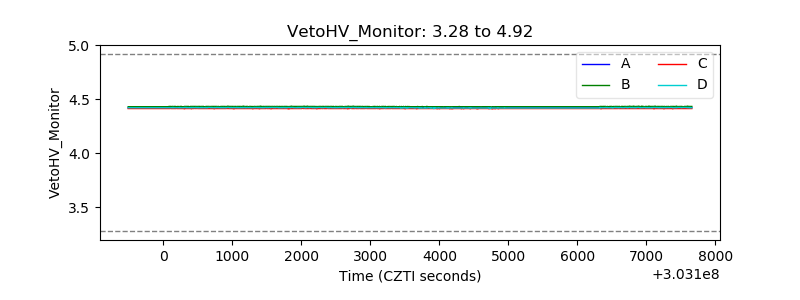 |
| Veto LLD | 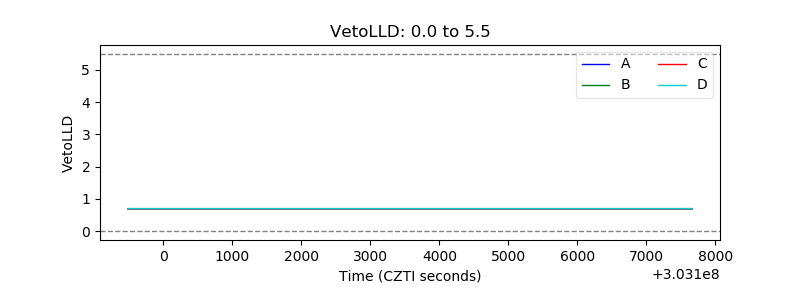 |
| Alpha Counter | 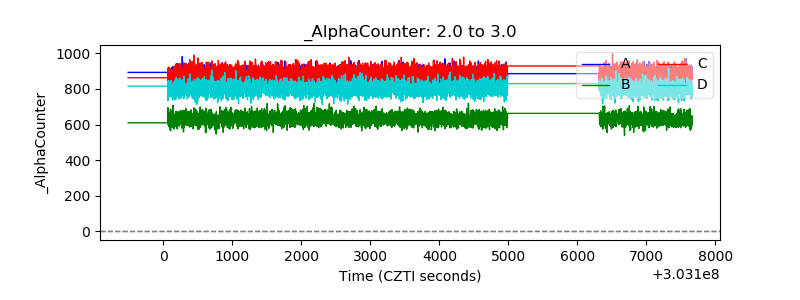 |
| _CPM_Rate | 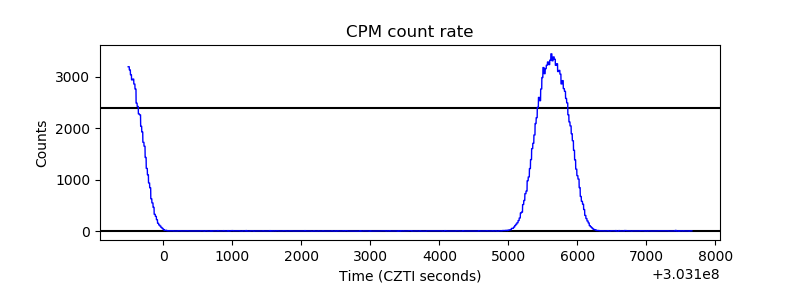 |
| CZT Counter | 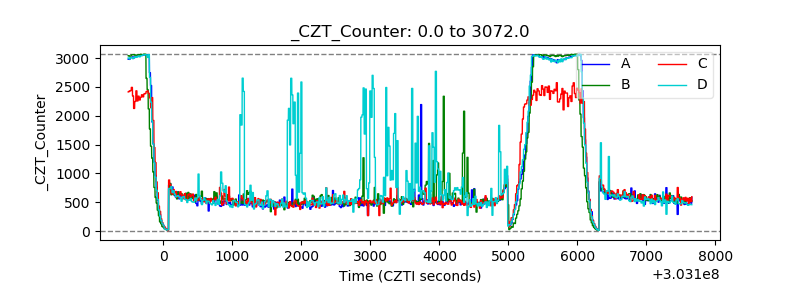 |
| +2.5 Volts monitor |  |
| +5 Volts monitor |  |
| _ROLL_ROT | 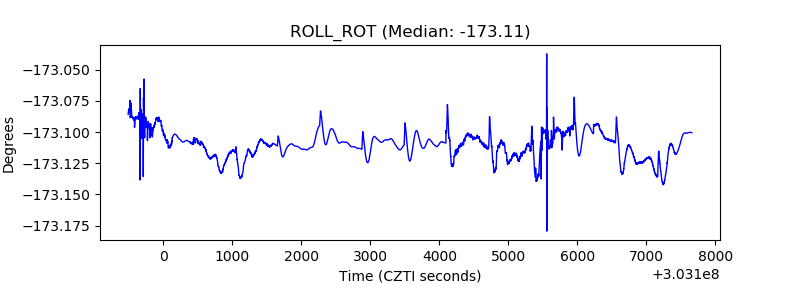 |
| _Roll_DEC | 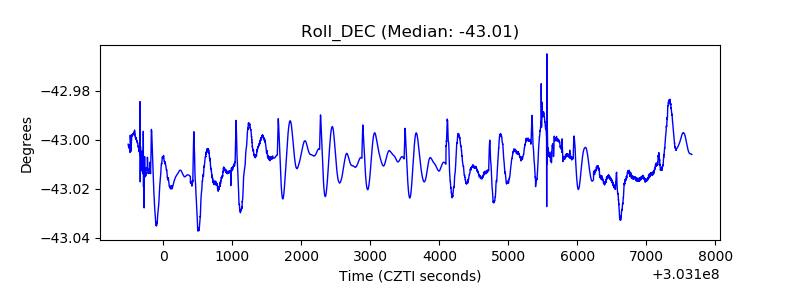 |
| _Roll_RA | 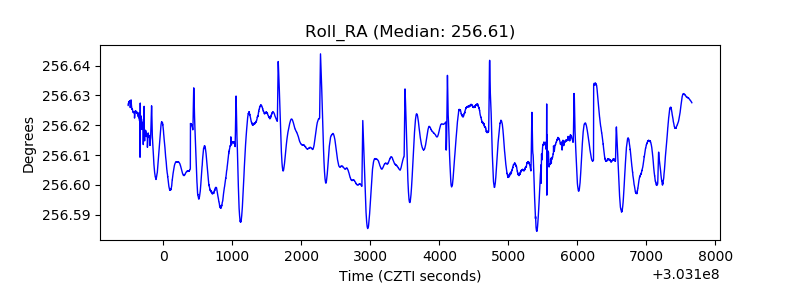 |
| Veto Counter | 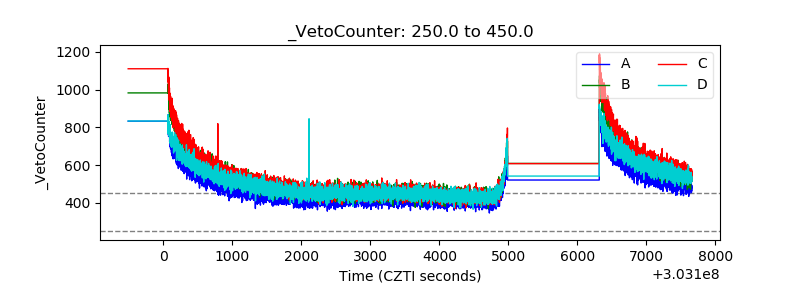 |