| Param | Original file | Final file |
|---|---|---|
| Filename | modeM0/AS1A06_002T03_9000003080_20905cztM0_level2.evt | modeM0/AS1A06_002T03_9000003080_20905cztM0_level2_quad_clean.evt |
| Size (bytes) | 862,139,520 | 98,092,800 |
| Size | 822.2 MB | 93.5 MB |
| Events in quadrant A | 3,807,606 | 648,736 |
| Events in quadrant B | 4,048,604 | 648,696 |
| Events in quadrant C | 3,541,880 | 641,258 |
| Events in quadrant D | 14,214,727 | 518,998 |
| Mode M9 | |||
|---|---|---|---|
| Quadrant | BADHDUFLAG | Total packets | Discarded packets |
| A | 0 | 3 | 0 |
| B | 0 | 3 | 0 |
| C | 0 | 3 | 0 |
| D | 0 | 3 | 0 |
| Mode M0 | |||
|---|---|---|---|
| Quadrant | BADHDUFLAG | Total packets | Discarded packets |
| A | 0 | 16056 | 2 |
| B | 0 | 16633 | 2 |
| C | 0 | 15167 | 2 |
| D | 0 | 47263 | 2 |
| Mode SS | |||
|---|---|---|---|
| Quadrant | BADHDUFLAG | Total packets | Discarded packets |
| A | 0 | 150 | 0 |
| B | 0 | 150 | 0 |
| C | 0 | 150 | 0 |
| D | 0 | 150 | 0 |
| Quadrant | Total seconds | Saturated seconds | Saturation percentage |
|---|---|---|---|
| A | 7353 | 180 | 2.447980% |
| B | 7353 | 196 | 2.665579% |
| C | 7354 | 164 | 2.230079% |
| D | 7354 | 3967 | 53.943432% |
Noise dominated data is calculated using 1-second bins in cleaned event files. If a bin has >2000 counts, and if more than 50% of those come from <1% of pixels, then it is considered to be noise-dominated and hence unusable.
| Quadrant | # 1 sec bins | Bins with >0 counts | Bins with >2000 counts | High rate bins dominated by noise | Noise dominated (total time) | Noise dominated (detector-on time) | Marked lightcurve |
|---|---|---|---|---|---|---|---|
| A | 7698 | 7355 | 26 | 26 | 0.34% | 0.35% | 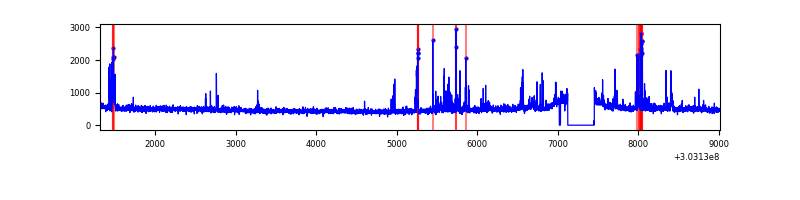 |
| B | 7698 | 7355 | 52 | 52 | 0.68% | 0.71% | 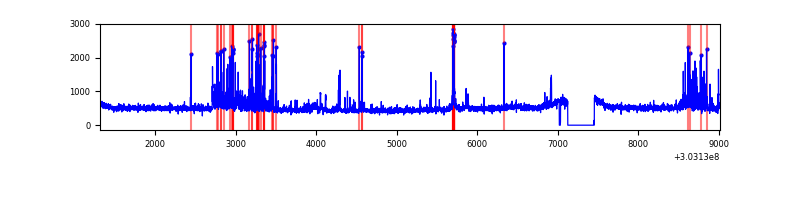 |
| C | 7699 | 7356 | 0 | 0 | 0.00% | 0.00% | 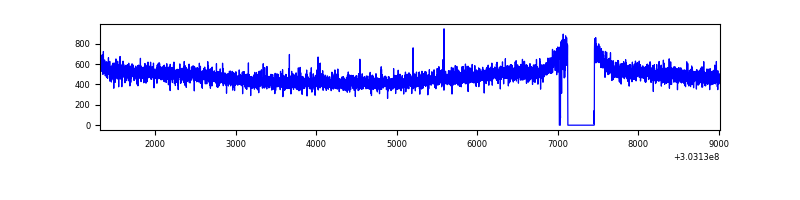 |
| D | 7699 | 7356 | 3997 | 3997 | 51.92% | 54.34% | 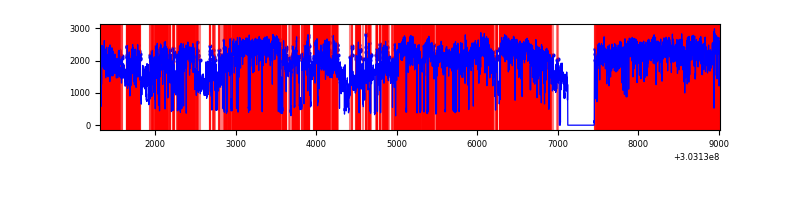 |
Top three noisy pixels from each quadrant. If the there are fewer than three noisy pixels in the level2.evt file, extra rows are filled as -1
| Pixel properties | Quadrant properties | ||||||
|---|---|---|---|---|---|---|---|
| Quadrant | DetID | PixID | Counts | Sigma | Mean | Median | Sigma |
| A | 6 | 16 | 145630 | 796.85 | 905 | 886 | 181.6 |
| A | 5 | 16 | 130344 | 712.7 | 905 | 886 | 181.6 |
| A | 15 | 174 | 54039 | 292.62 | 905 | 886 | 181.6 |
| B | 7 | 220 | 306232 | 1769.04 | 899 | 875 | 172.6 |
| B | 3 | 64 | 98469 | 565.4 | 899 | 875 | 172.6 |
| B | 0 | 230 | 39129 | 221.62 | 899 | 875 | 172.6 |
| C | 14 | 238 | 136028 | 661.38 | 872 | 878 | 204.3 |
| C | 13 | 61 | 6095 | 25.53 | 872 | 878 | 204.3 |
| C | 10 | 91 | 5464 | 22.44 | 872 | 878 | 204.3 |
| D | 1 | 239 | 7904752 | 43568.51 | 748 | 726 | 181.4 |
| D | 1 | 52 | 2864605 | 15786.25 | 748 | 726 | 181.4 |
| D | 1 | 20 | 583774 | 3213.87 | 748 | 726 | 181.4 |
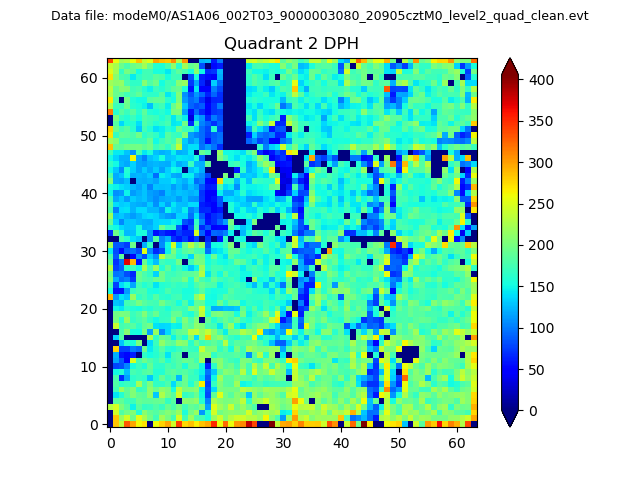
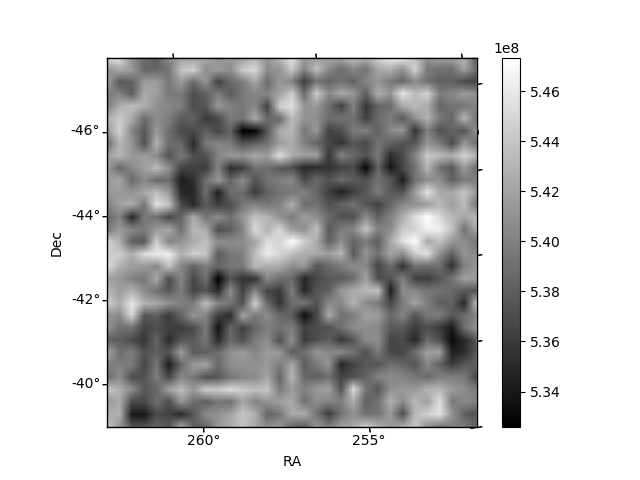
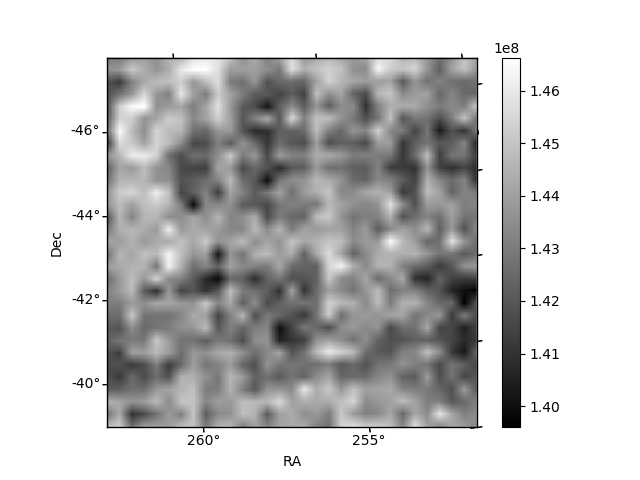
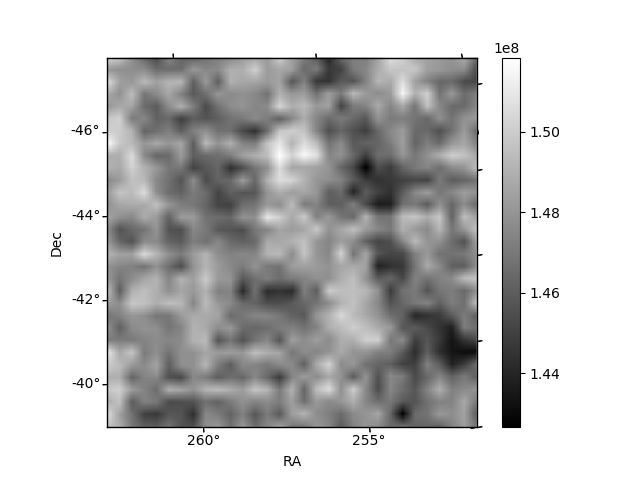
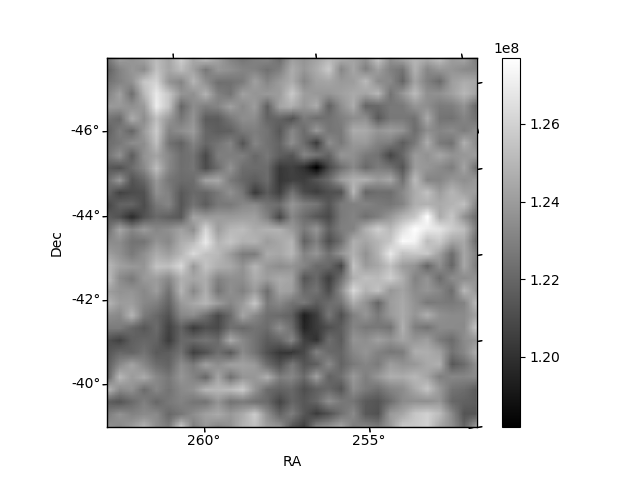
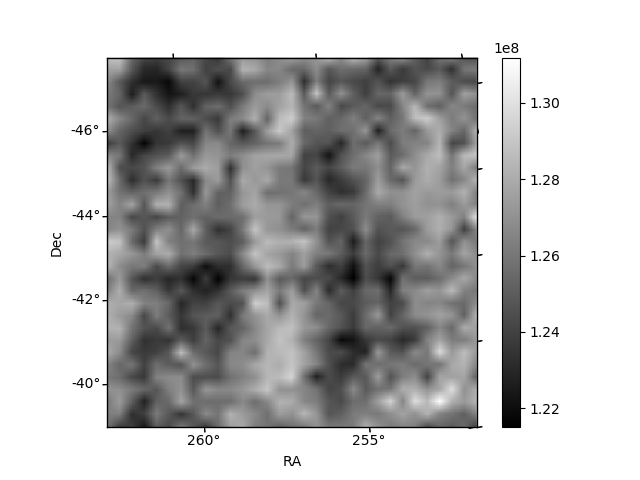
Histogram calculated using DETX and DETY for each event in the final _common_clean file
| Quadrant A | 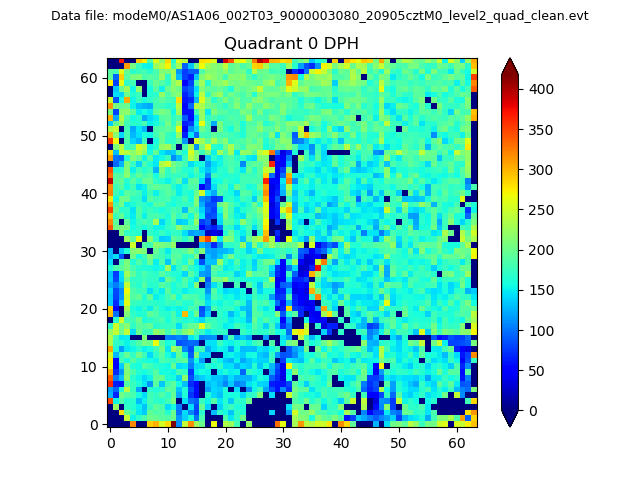 |
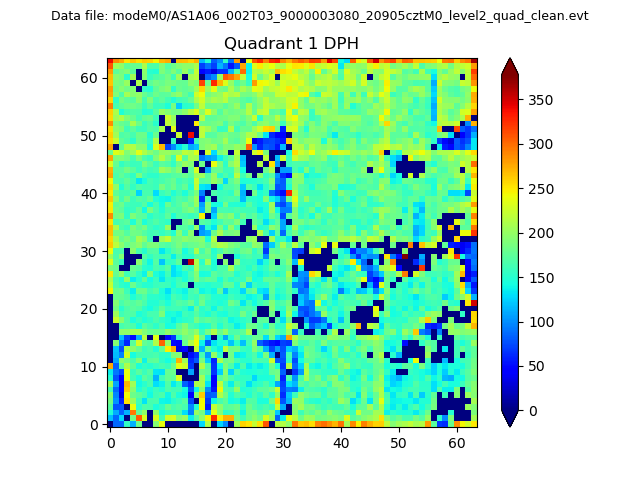 |
Quadrant B |
|---|---|---|---|
| Quadrant D | 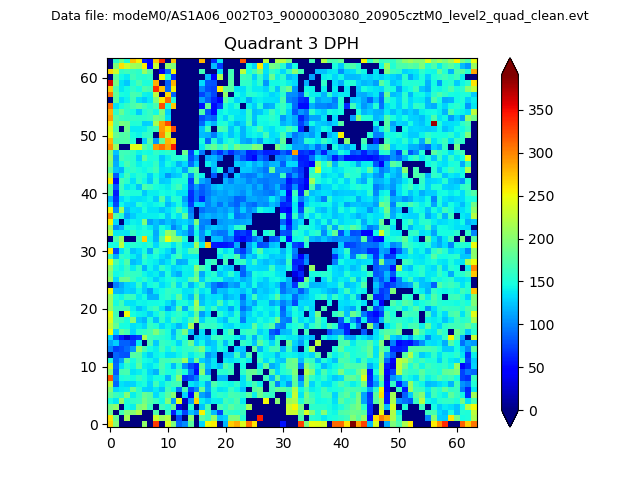 |
 |
Quadrant C |
| Plot type | Count rate plots | Images |
|---|---|---|
| Comparison with Poisson distribution Blue bars denote a histogram of data divided into 1 sec bins. Red curve is a Poisson curve with rate = median count rate of data. |
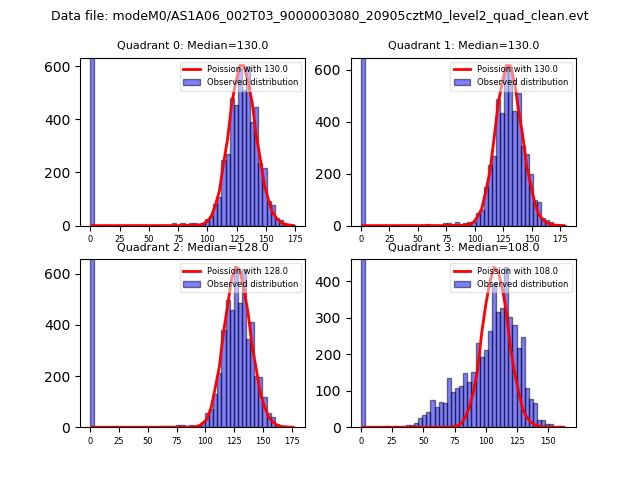 |
 |
| Quadrant-wise count rates Data is divided into 100 sec bins |
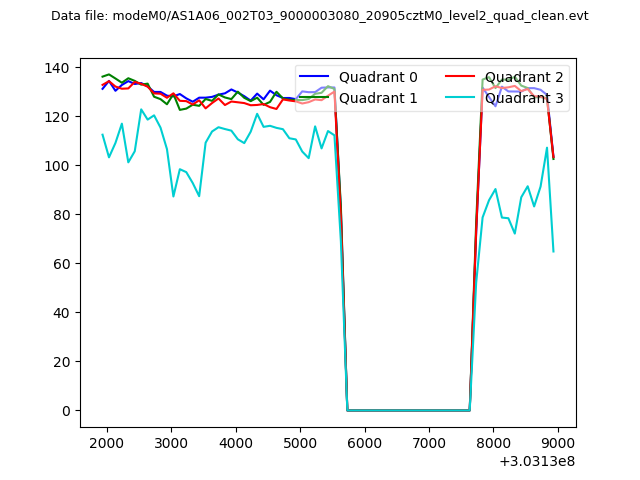 |
|
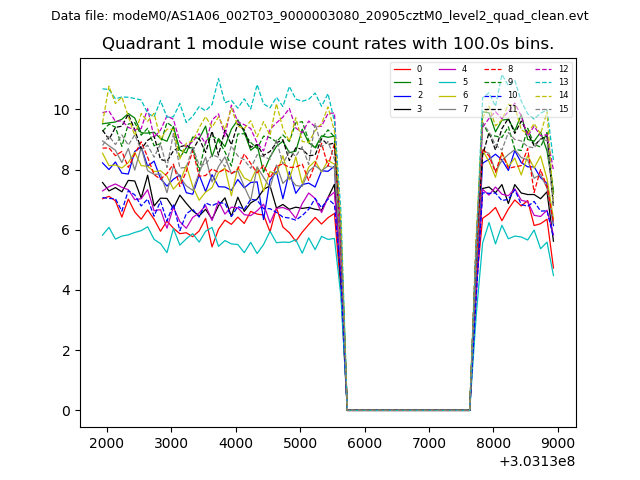
| Module-wise count rates for Quadrant A Data is divided into 100 sec bins |
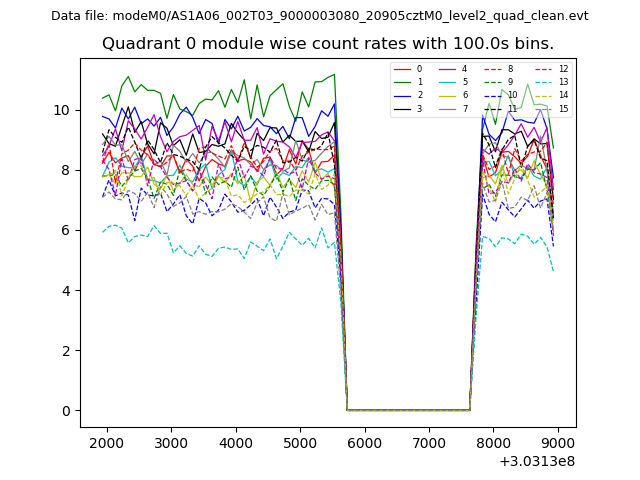 |
 |
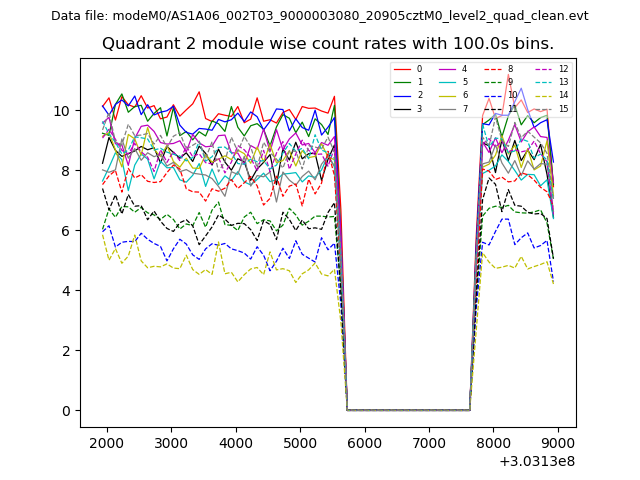
| Module-wise count rates for Quadrant B Data is divided into 100 sec bins |
 |
 |
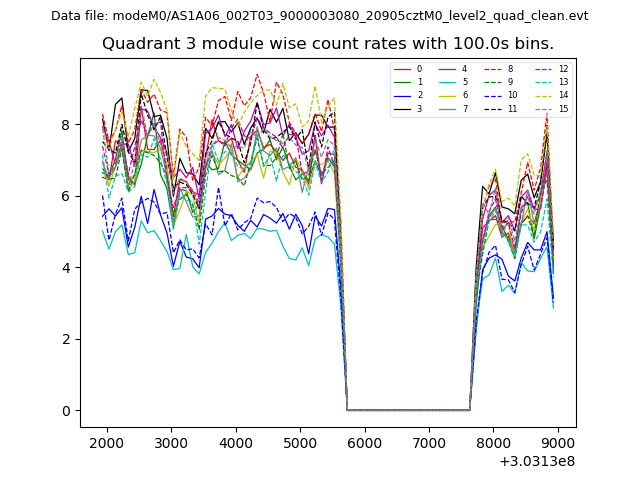
| Module-wise count rates for Quadrant C Data is divided into 100 sec bins |
 |
 |
| Module-wise count rates for Quadrant D Data is divided into 100 sec bins |
 |
 |
| Parameter | Plot |
|---|---|
| CZT HV Monitor | 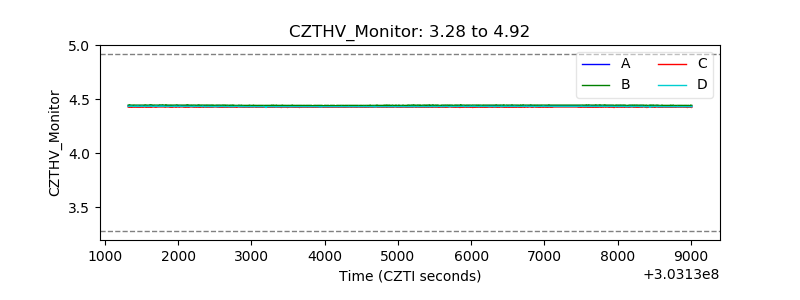 |
| D_VDD | 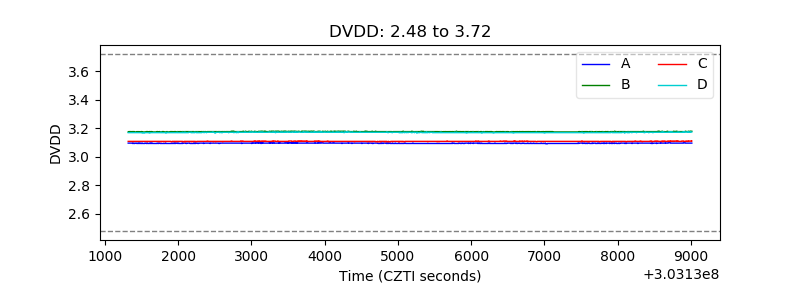 |
| Temperature 1 | 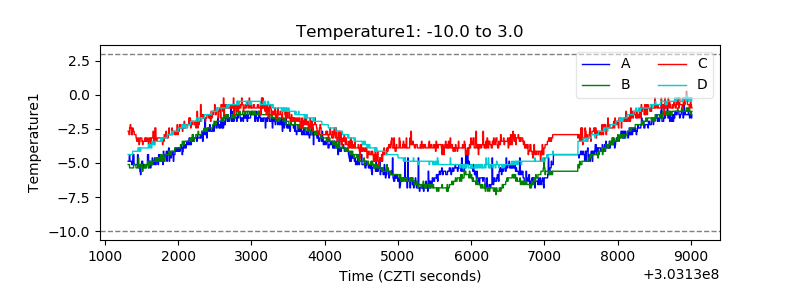 |
| Veto HV Monitor |  |
| Veto LLD | 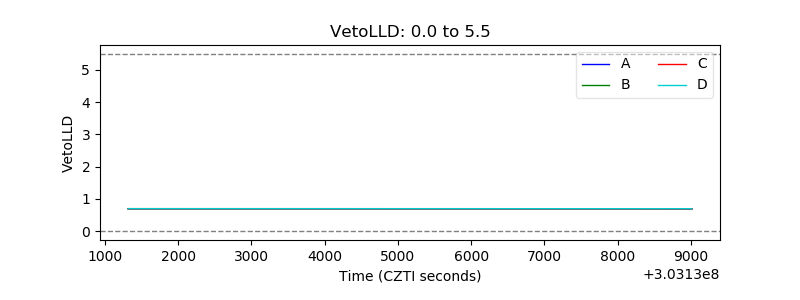 |
| Alpha Counter | 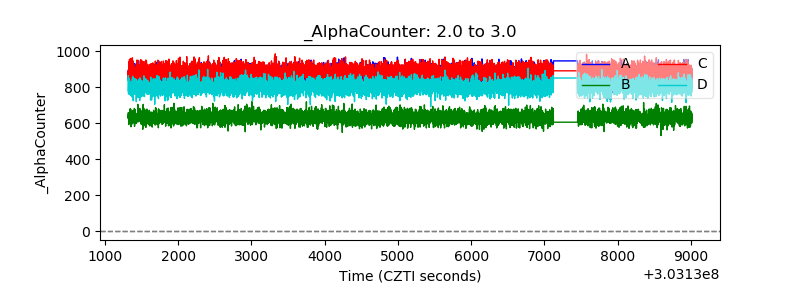 |
| _CPM_Rate | 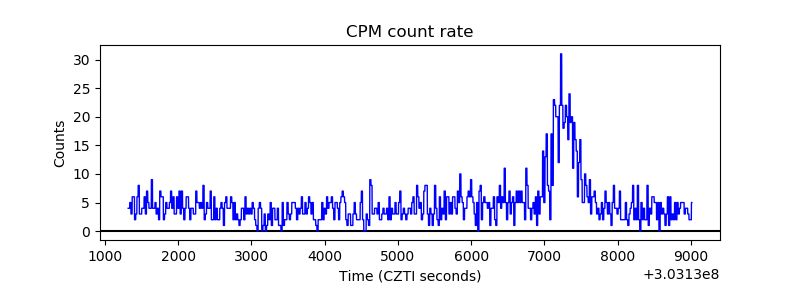 |
| CZT Counter | 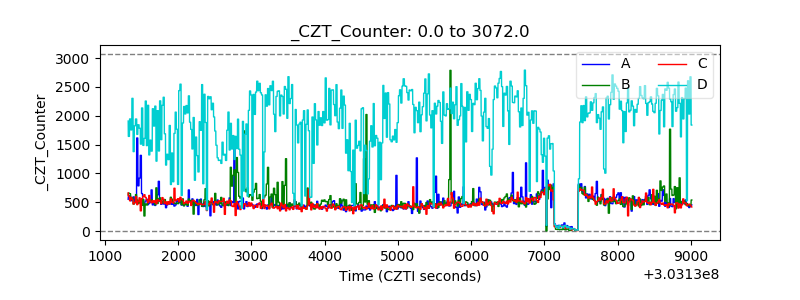 |
| +2.5 Volts monitor |  |
| +5 Volts monitor |  |
| _ROLL_ROT | 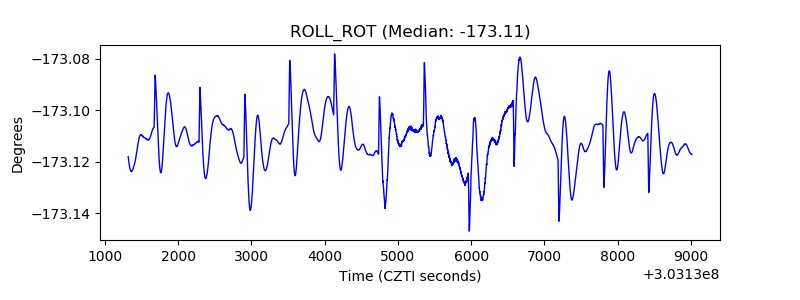 |
| _Roll_DEC | 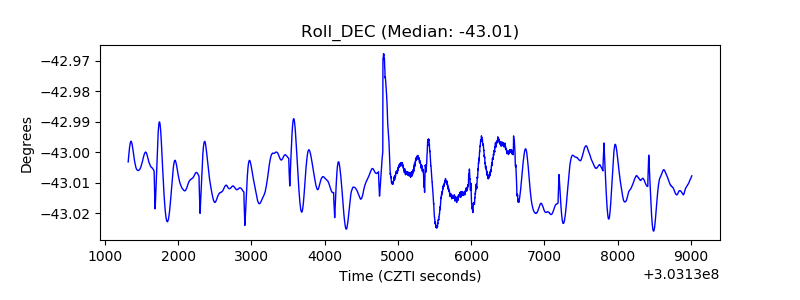 |
| _Roll_RA | 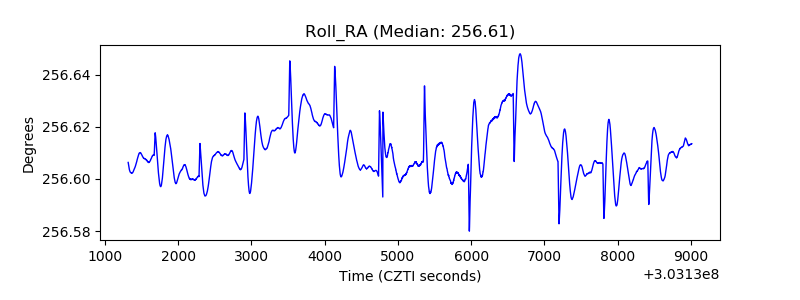 |
| Veto Counter | 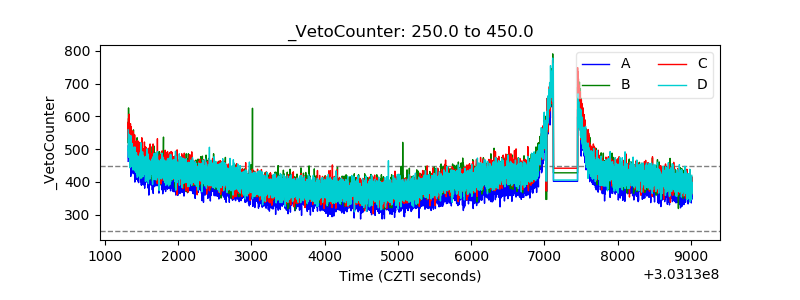 |