| Param | Original file | Final file |
|---|---|---|
| Filename | modeM0/AS1A06_002T03_9000003080_20906cztM0_level2.evt | modeM0/AS1A06_002T03_9000003080_20906cztM0_level2_quad_clean.evt |
| Size (bytes) | 851,270,400 | 99,976,320 |
| Size | 811.8 MB | 95.3 MB |
| Events in quadrant A | 3,545,185 | 673,083 |
| Events in quadrant B | 3,882,512 | 674,221 |
| Events in quadrant C | 3,469,621 | 661,221 |
| Events in quadrant D | 14,396,303 | 515,754 |
| Mode M9 | |||
|---|---|---|---|
| Quadrant | BADHDUFLAG | Total packets | Discarded packets |
| A | 0 | 2 | 0 |
| B | 0 | 2 | 0 |
| C | 0 | 2 | 0 |
| D | 0 | 2 | 0 |
| Mode M0 | |||
|---|---|---|---|
| Quadrant | BADHDUFLAG | Total packets | Discarded packets |
| A | 0 | 15222 | 1 |
| B | 0 | 16075 | 1 |
| C | 0 | 14873 | 1 |
| D | 0 | 47713 | 4 |
| Mode SS | |||
|---|---|---|---|
| Quadrant | BADHDUFLAG | Total packets | Discarded packets |
| A | 0 | 146 | 0 |
| B | 0 | 146 | 0 |
| C | 0 | 146 | 0 |
| D | 0 | 146 | 0 |
| Quadrant | Total seconds | Saturated seconds | Saturation percentage |
|---|---|---|---|
| A | 7211 | 100 | 1.386770% |
| B | 7212 | 179 | 2.481974% |
| C | 7212 | 100 | 1.386578% |
| D | 7211 | 4043 | 56.067120% |
Noise dominated data is calculated using 1-second bins in cleaned event files. If a bin has >2000 counts, and if more than 50% of those come from <1% of pixels, then it is considered to be noise-dominated and hence unusable.
| Quadrant | # 1 sec bins | Bins with >0 counts | Bins with >2000 counts | High rate bins dominated by noise | Noise dominated (total time) | Noise dominated (detector-on time) | Marked lightcurve |
|---|---|---|---|---|---|---|---|
| A | 7436 | 7212 | 16 | 16 | 0.22% | 0.22% | 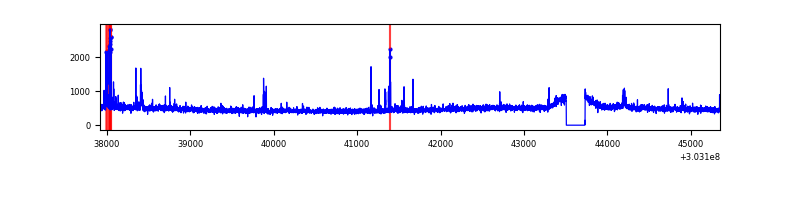 |
| B | 7437 | 7213 | 19 | 19 | 0.26% | 0.26% | 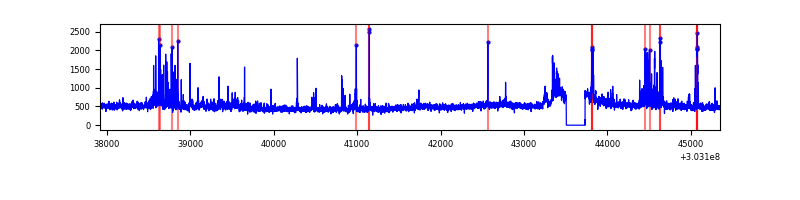 |
| C | 7437 | 7213 | 0 | 0 | 0.00% | 0.00% | 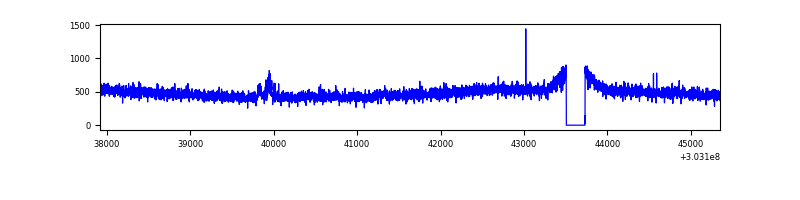 |
| D | 7436 | 7212 | 4095 | 4095 | 55.07% | 56.78% | 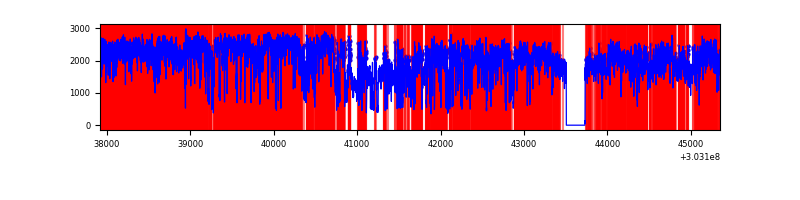 |
Top three noisy pixels from each quadrant. If the there are fewer than three noisy pixels in the level2.evt file, extra rows are filled as -1
| Pixel properties | Quadrant properties | ||||||
|---|---|---|---|---|---|---|---|
| Quadrant | DetID | PixID | Counts | Sigma | Mean | Median | Sigma |
| A | 5 | 16 | 87082 | 485.14 | 883 | 864 | 177.7 |
| A | 15 | 174 | 34231 | 187.75 | 883 | 864 | 177.7 |
| A | 6 | 16 | 30305 | 165.66 | 883 | 864 | 177.7 |
| B | 7 | 220 | 139657 | 835.36 | 873 | 853 | 166.2 |
| B | 3 | 64 | 124235 | 742.55 | 873 | 853 | 166.2 |
| B | 0 | 189 | 70364 | 418.34 | 873 | 853 | 166.2 |
| C | 14 | 238 | 132856 | 666.73 | 843 | 845 | 198.0 |
| C | 8 | 222 | 21956 | 106.62 | 843 | 845 | 198.0 |
| C | 10 | 91 | 20965 | 101.62 | 843 | 845 | 198.0 |
| D | 1 | 52 | 8259699 | 45686.48 | 738 | 715 | 180.8 |
| D | 1 | 239 | 3022438 | 16715.36 | 738 | 715 | 180.8 |
| D | 1 | 20 | 211205 | 1164.37 | 738 | 715 | 180.8 |
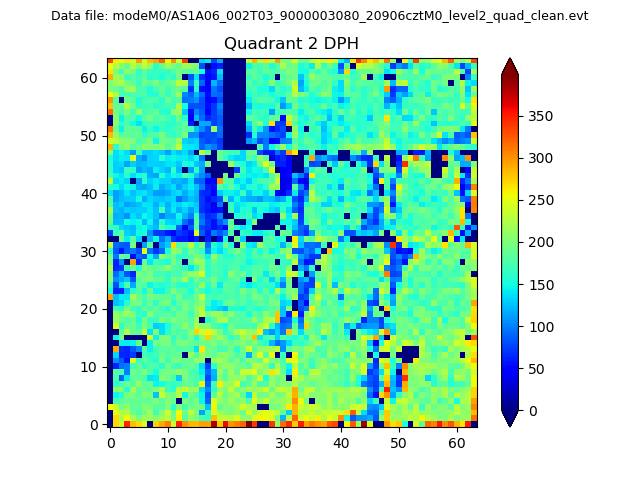
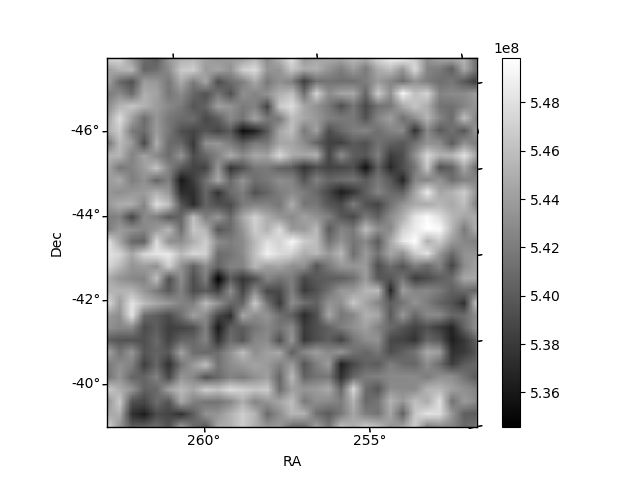
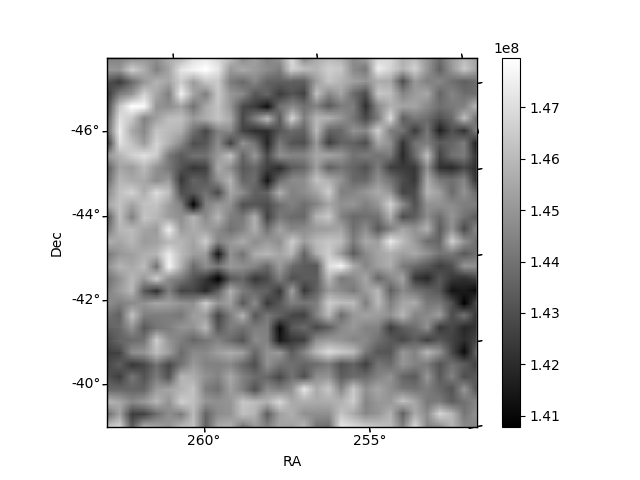
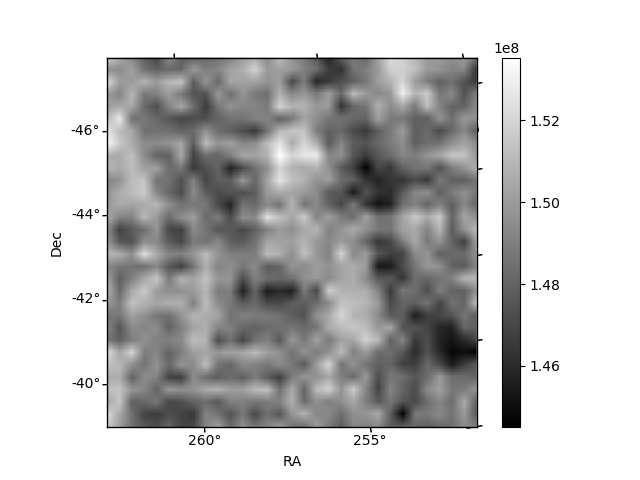
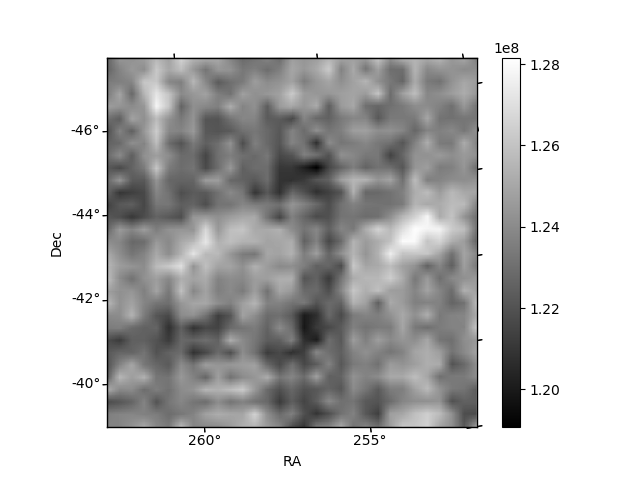
Histogram calculated using DETX and DETY for each event in the final _common_clean file
| Quadrant A | 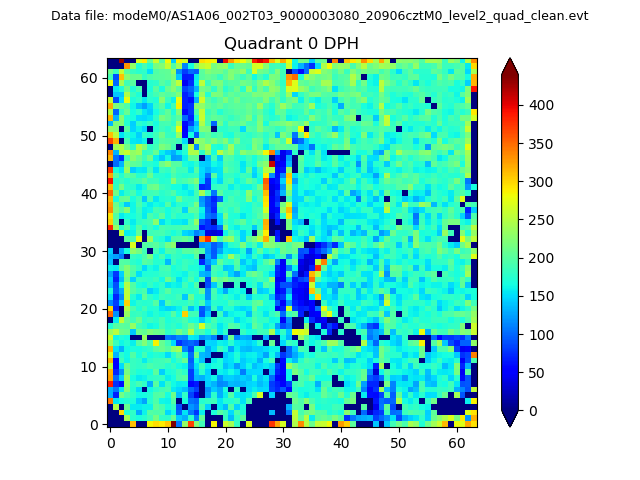 |
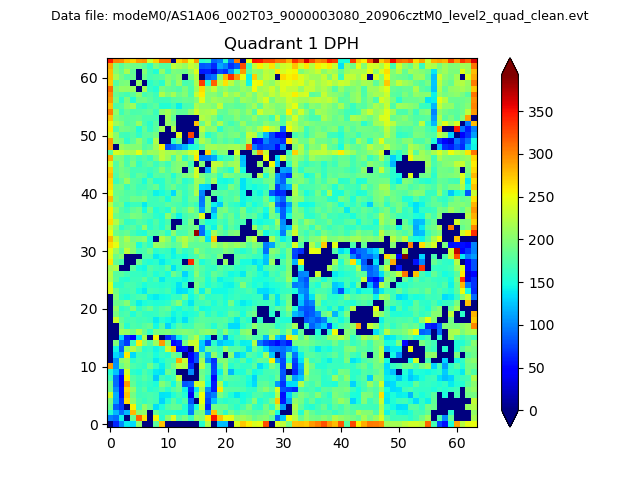 |
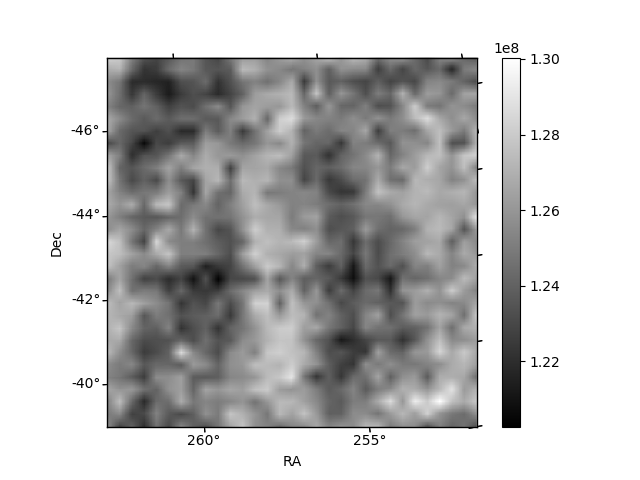
Quadrant B |
|---|---|---|---|
| Quadrant D | 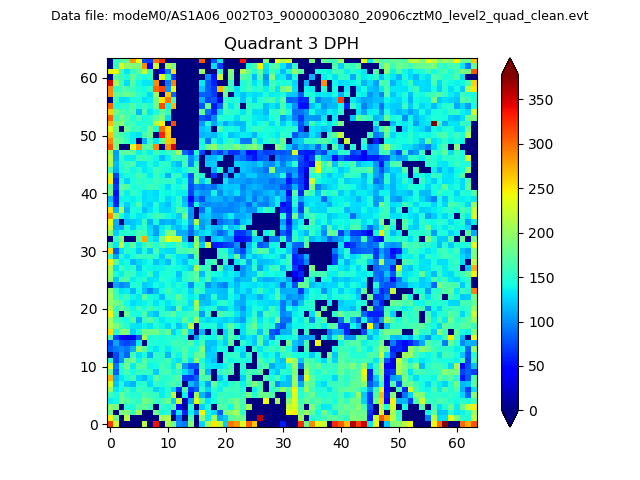 |
 |
Quadrant C |
| Plot type | Count rate plots | Images |
|---|---|---|
| Comparison with Poisson distribution Blue bars denote a histogram of data divided into 1 sec bins. Red curve is a Poisson curve with rate = median count rate of data. |
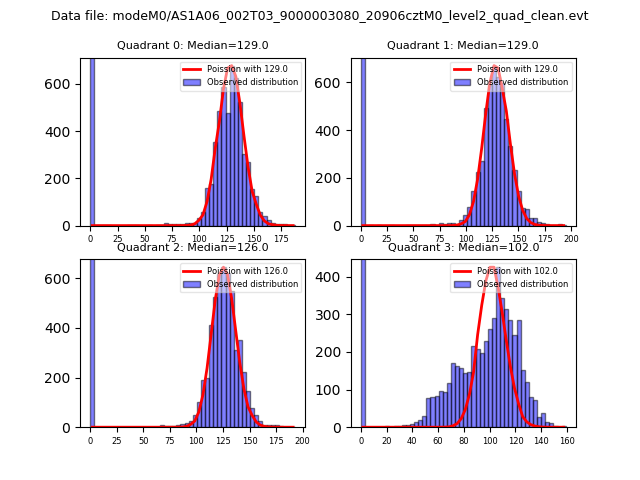 |
 |
| Quadrant-wise count rates Data is divided into 100 sec bins |
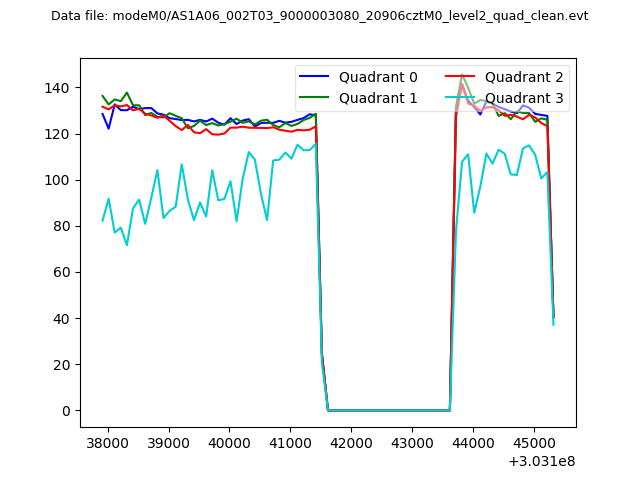 |
|
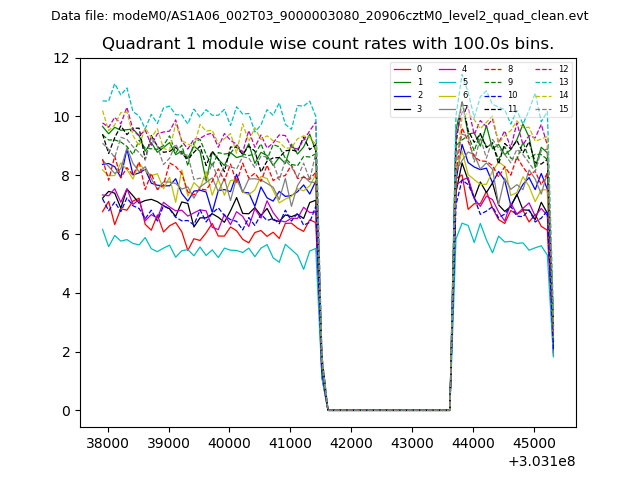
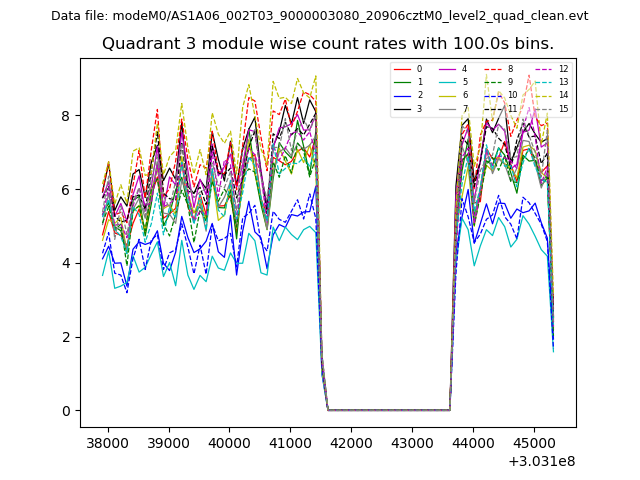
| Module-wise count rates for Quadrant A Data is divided into 100 sec bins |
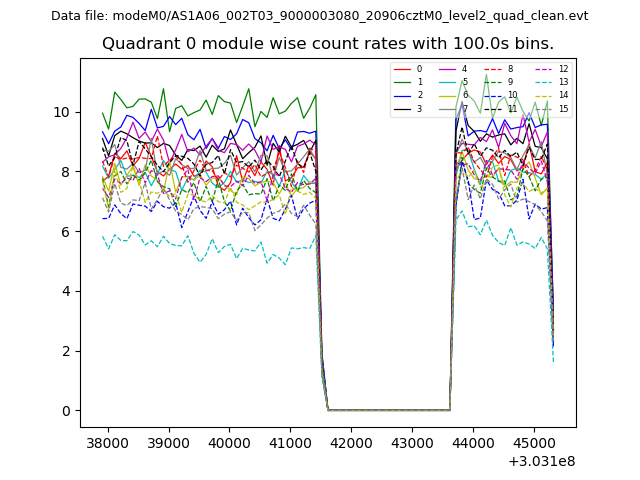 |
 |
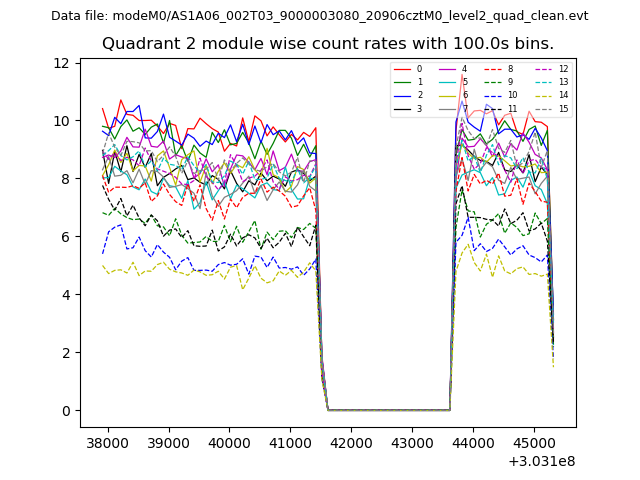
| Module-wise count rates for Quadrant B Data is divided into 100 sec bins |
 |
 |
| Module-wise count rates for Quadrant C Data is divided into 100 sec bins |
 |
 |
| Module-wise count rates for Quadrant D Data is divided into 100 sec bins |
 |
 |
| Parameter | Plot |
|---|---|
| CZT HV Monitor | 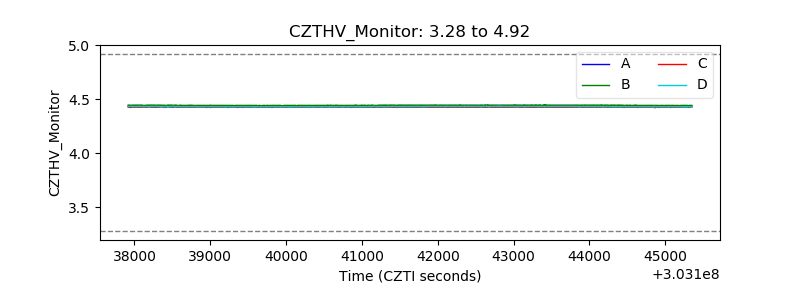 |
| D_VDD | 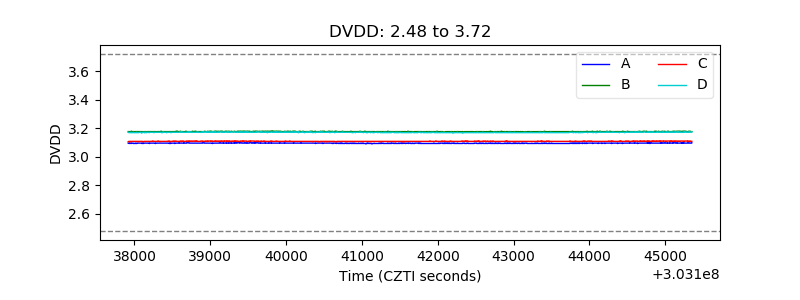 |
| Temperature 1 | 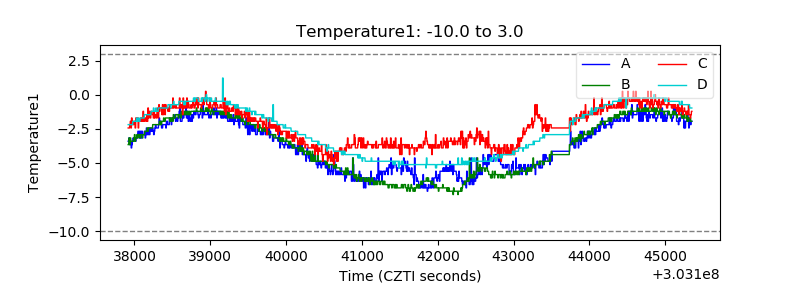 |
| Veto HV Monitor | 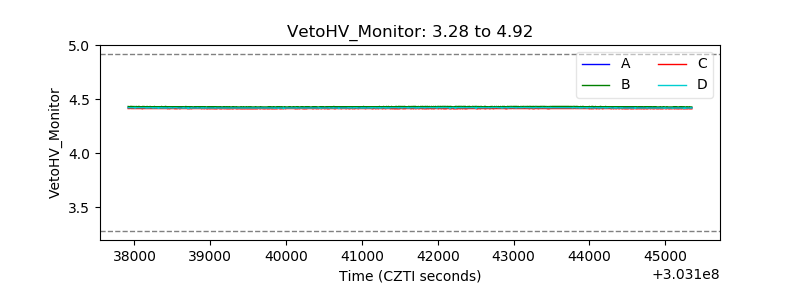 |
| Veto LLD | 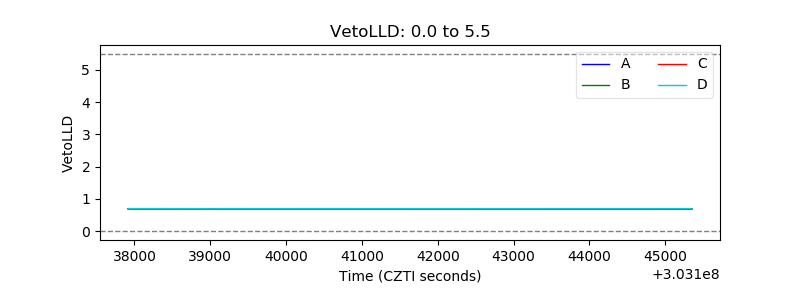 |
| Alpha Counter | 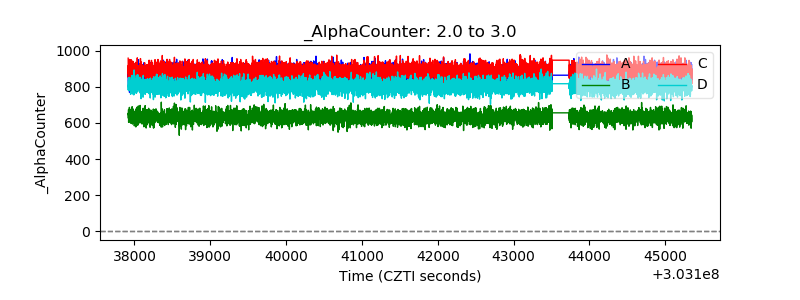 |
| _CPM_Rate | 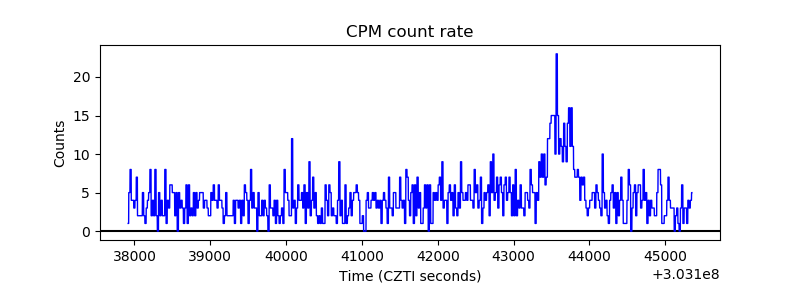 |
| CZT Counter | 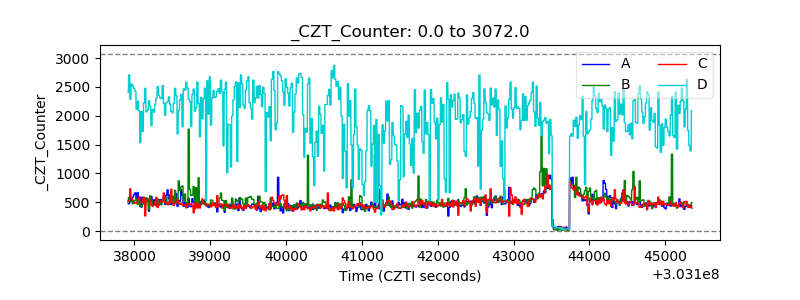 |
| +2.5 Volts monitor | 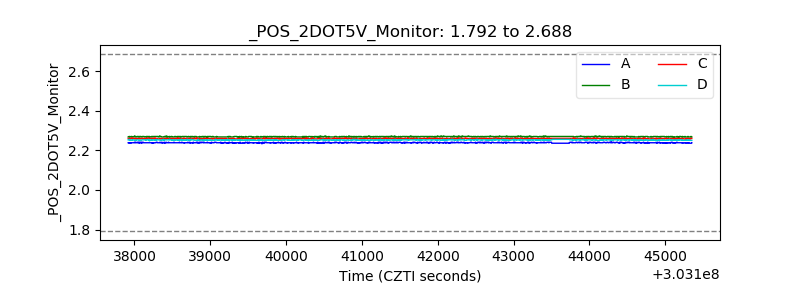 |
| +5 Volts monitor |  |
| _ROLL_ROT | 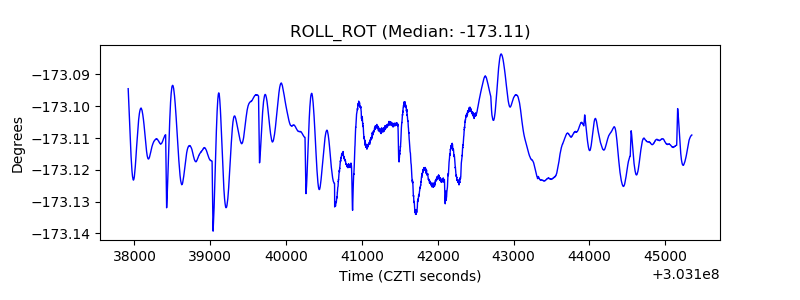 |
| _Roll_DEC | 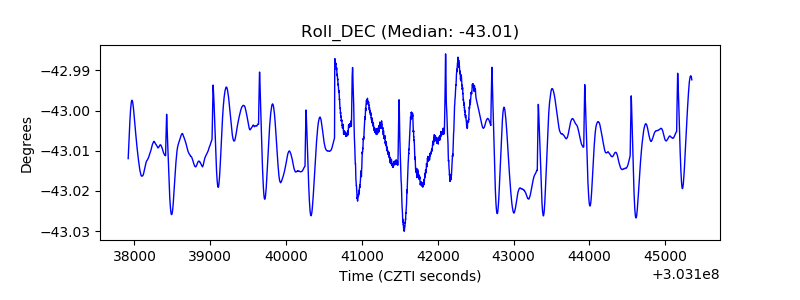 |
| _Roll_RA | 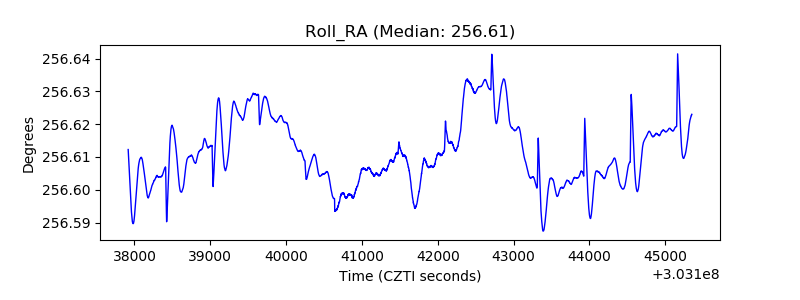 |
| Veto Counter | 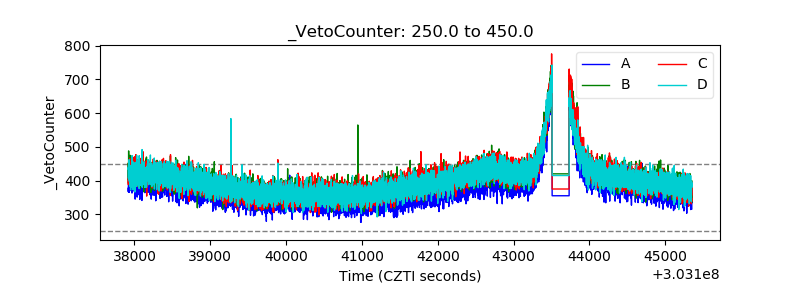 |