| Param | Original file | Final file |
|---|---|---|
| Filename | modeM0/AS1A06_002T03_9000003080_20907cztM0_level2.evt | modeM0/AS1A06_002T03_9000003080_20907cztM0_level2_quad_clean.evt |
| Size (bytes) | 648,535,680 | 96,295,680 |
| Size | 618.5 MB | 91.8 MB |
| Events in quadrant A | 3,382,807 | 630,591 |
| Events in quadrant B | 3,827,254 | 625,882 |
| Events in quadrant C | 3,718,619 | 606,423 |
| Events in quadrant D | 8,238,267 | 564,611 |
| Mode M9 | |||
|---|---|---|---|
| Quadrant | BADHDUFLAG | Total packets | Discarded packets |
| A | 0 | 4 | 0 |
| B | 0 | 4 | 0 |
| C | 0 | 4 | 0 |
| D | 0 | 4 | 0 |
| Mode M0 | |||
|---|---|---|---|
| Quadrant | BADHDUFLAG | Total packets | Discarded packets |
| A | 0 | 14691 | 1 |
| B | 0 | 15907 | 1 |
| C | 0 | 15690 | 1 |
| D | 0 | 29226 | 1 |
| Mode SS | |||
|---|---|---|---|
| Quadrant | BADHDUFLAG | Total packets | Discarded packets |
| A | 0 | 142 | 0 |
| B | 0 | 142 | 0 |
| C | 0 | 142 | 0 |
| D | 0 | 142 | 0 |
| Quadrant | Total seconds | Saturated seconds | Saturation percentage |
|---|---|---|---|
| A | 7011 | 39 | 0.556269% |
| B | 7012 | 104 | 1.483172% |
| C | 7012 | 244 | 3.479749% |
| D | 7012 | 771 | 10.995436% |
Noise dominated data is calculated using 1-second bins in cleaned event files. If a bin has >2000 counts, and if more than 50% of those come from <1% of pixels, then it is considered to be noise-dominated and hence unusable.
| Quadrant | # 1 sec bins | Bins with >0 counts | Bins with >2000 counts | High rate bins dominated by noise | Noise dominated (total time) | Noise dominated (detector-on time) | Marked lightcurve |
|---|---|---|---|---|---|---|---|
| A | 7421 | 7012 | 5 | 5 | 0.07% | 0.07% | 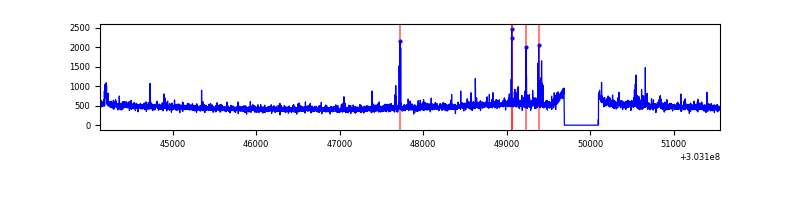 |
| B | 7422 | 7013 | 28 | 28 | 0.38% | 0.40% | 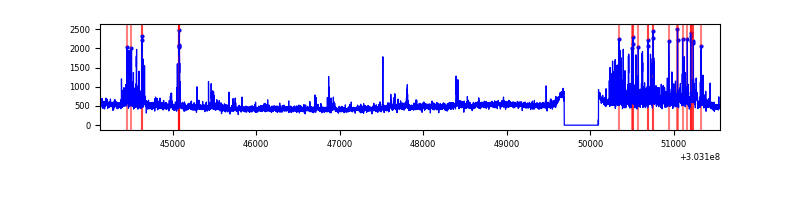 |
| C | 7422 | 7013 | 134 | 134 | 1.81% | 1.91% | 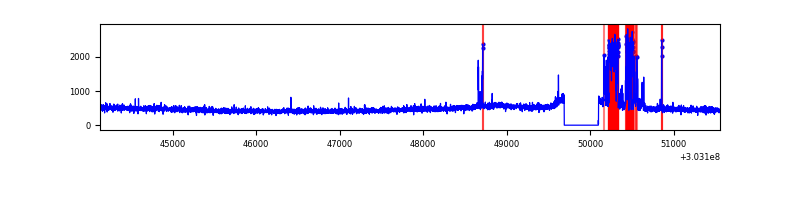 |
| D | 7422 | 7013 | 887 | 887 | 11.95% | 12.65% | 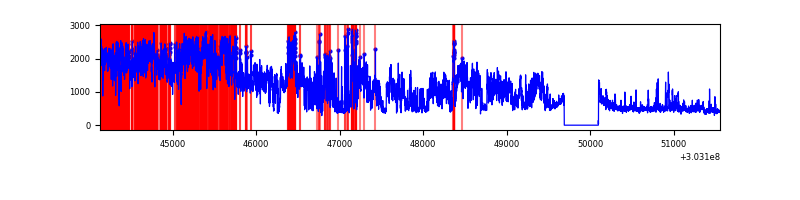 |
Top three noisy pixels from each quadrant. If the there are fewer than three noisy pixels in the level2.evt file, extra rows are filled as -1
| Pixel properties | Quadrant properties | ||||||
|---|---|---|---|---|---|---|---|
| Quadrant | DetID | PixID | Counts | Sigma | Mean | Median | Sigma |
| A | 5 | 16 | 58119 | 333.57 | 846 | 827 | 171.8 |
| A | 6 | 16 | 55833 | 320.26 | 846 | 827 | 171.8 |
| A | 15 | 174 | 17217 | 95.43 | 846 | 827 | 171.8 |
| B | 7 | 220 | 295594 | 1834.7 | 838 | 817 | 160.7 |
| B | 0 | 228 | 61960 | 380.55 | 838 | 817 | 160.7 |
| B | 0 | 190 | 41900 | 255.7 | 838 | 817 | 160.7 |
| C | 9 | 54 | 450288 | 2395.28 | 799 | 803 | 187.7 |
| C | 14 | 238 | 124553 | 659.46 | 799 | 803 | 187.7 |
| C | 0 | 207 | 11234 | 55.59 | 799 | 803 | 187.7 |
| D | 1 | 52 | 4554652 | 23420.4 | 802 | 780 | 194.4 |
| D | 1 | 239 | 513000 | 2634.33 | 802 | 780 | 194.4 |
| D | 7 | 38 | 88343 | 450.33 | 802 | 780 | 194.4 |
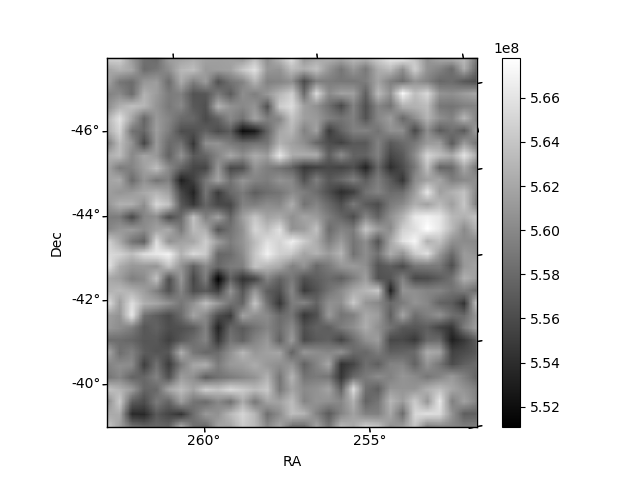
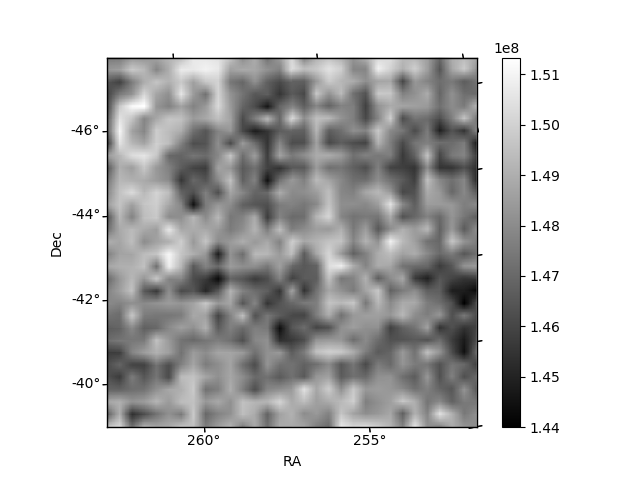
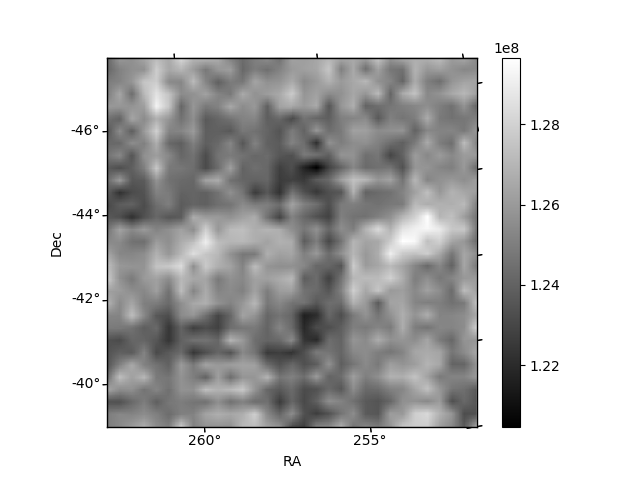
Histogram calculated using DETX and DETY for each event in the final _common_clean file
| Quadrant A | 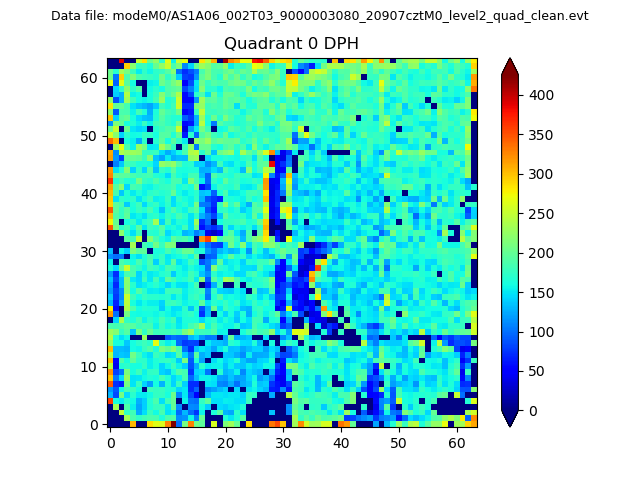 |
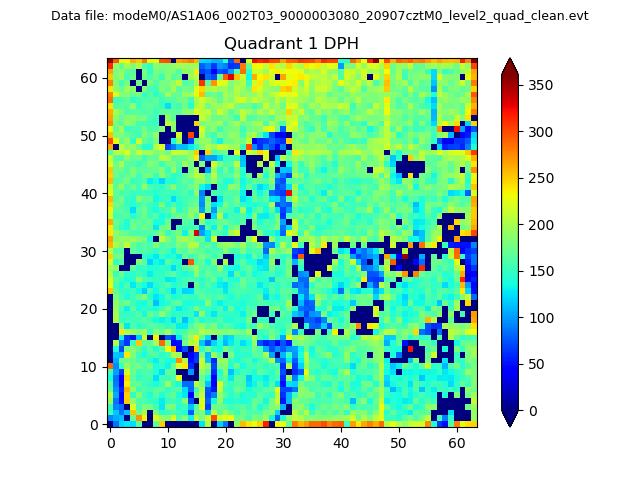 |
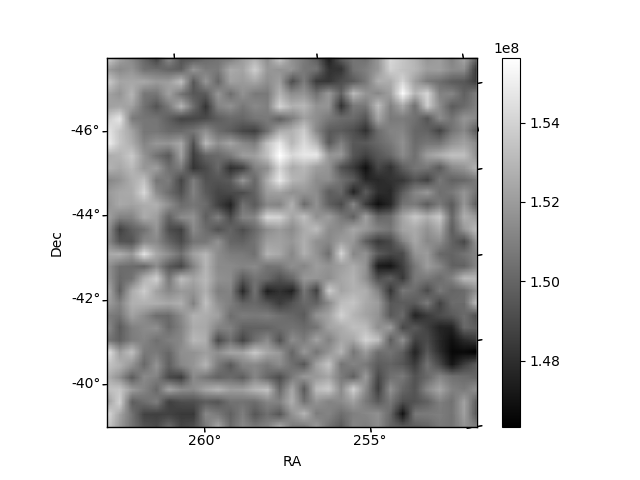
Quadrant B |
|---|---|---|---|
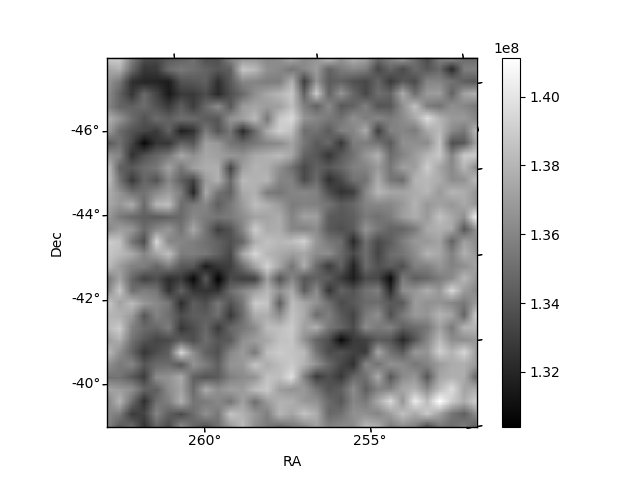
| Quadrant D | 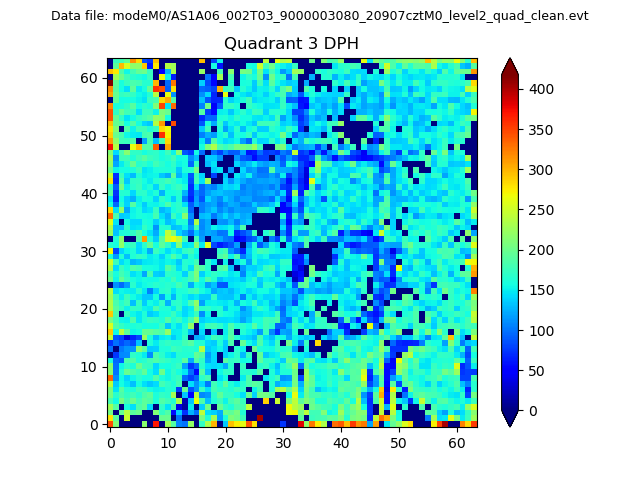 |
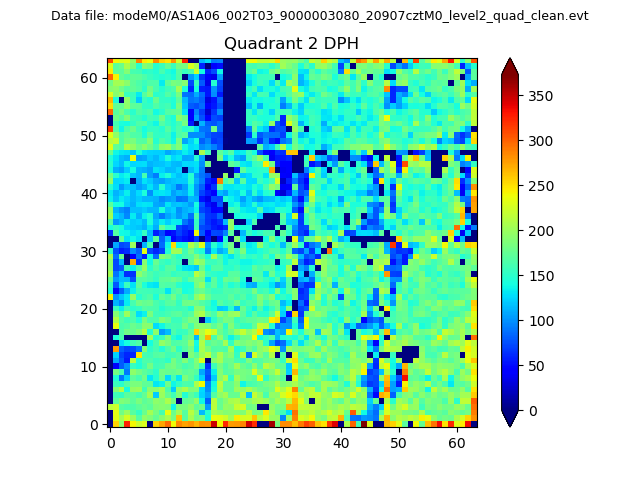 |
Quadrant C |
| Plot type | Count rate plots | Images |
|---|---|---|
| Comparison with Poisson distribution Blue bars denote a histogram of data divided into 1 sec bins. Red curve is a Poisson curve with rate = median count rate of data. |
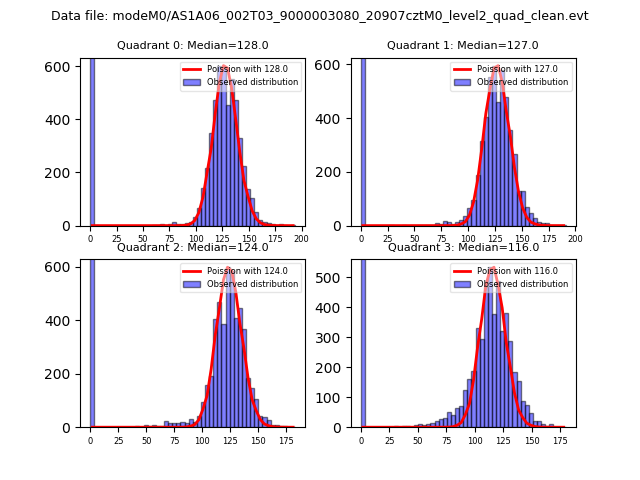 |
 |
| Quadrant-wise count rates Data is divided into 100 sec bins |
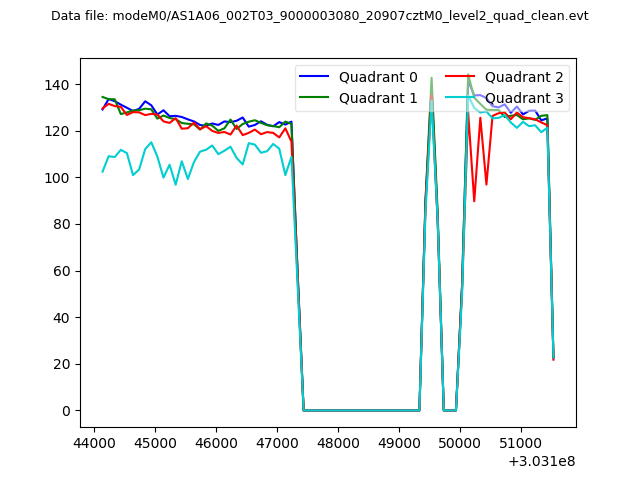 |
|
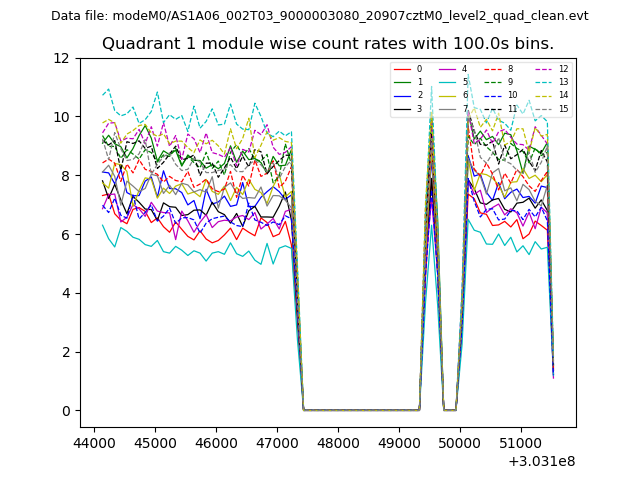
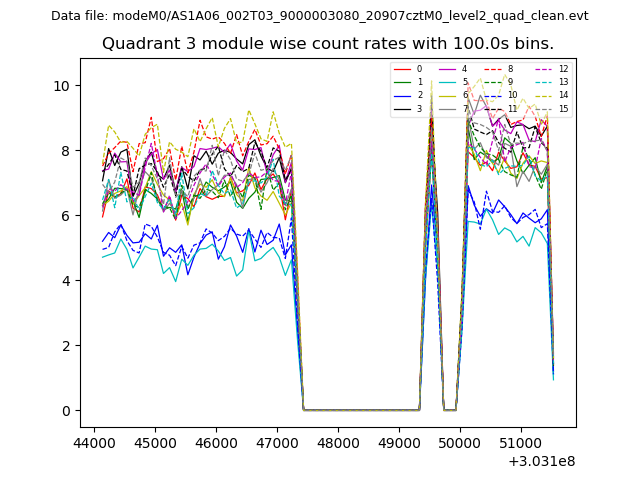
| Module-wise count rates for Quadrant A Data is divided into 100 sec bins |
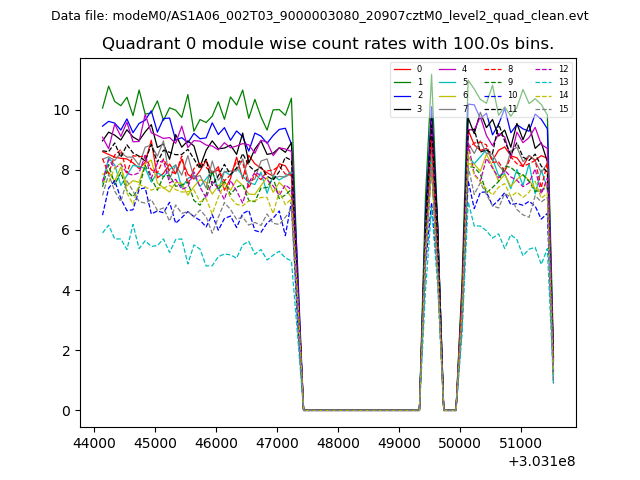 |
 |
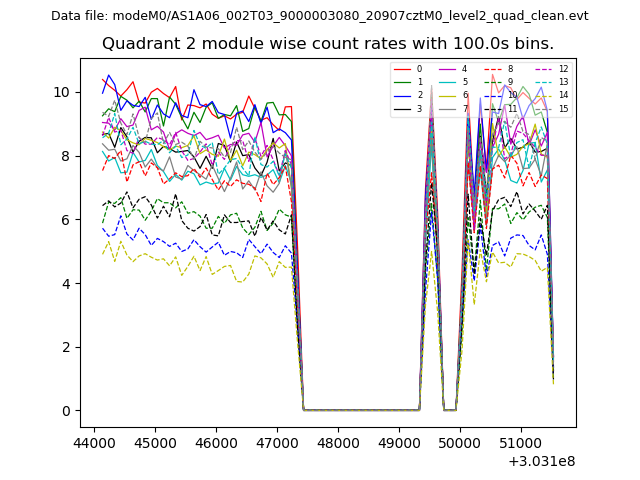
| Module-wise count rates for Quadrant B Data is divided into 100 sec bins |
 |
 |
| Module-wise count rates for Quadrant C Data is divided into 100 sec bins |
 |
 |
| Module-wise count rates for Quadrant D Data is divided into 100 sec bins |
 |
 |
| Parameter | Plot |
|---|---|
| CZT HV Monitor | 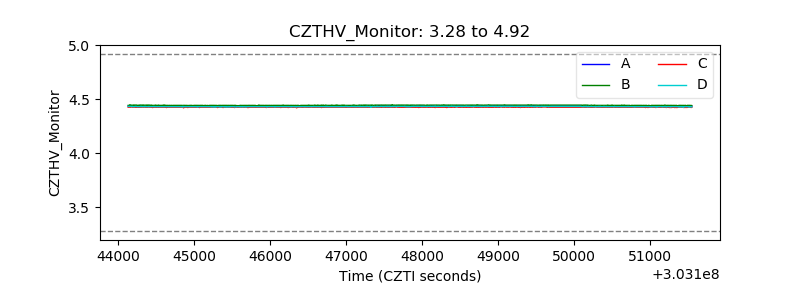 |
| D_VDD | 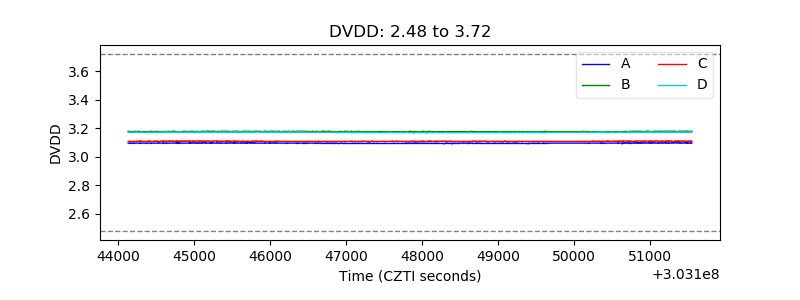 |
| Temperature 1 | 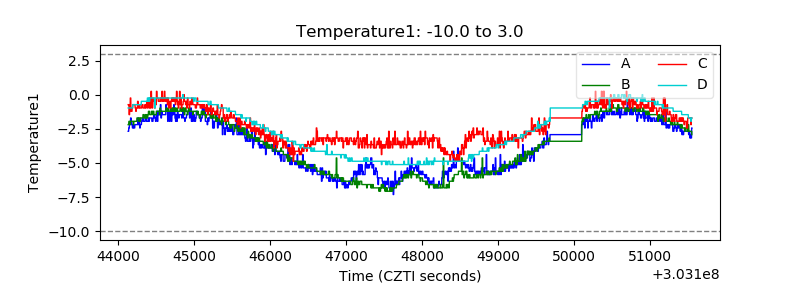 |
| Veto HV Monitor | 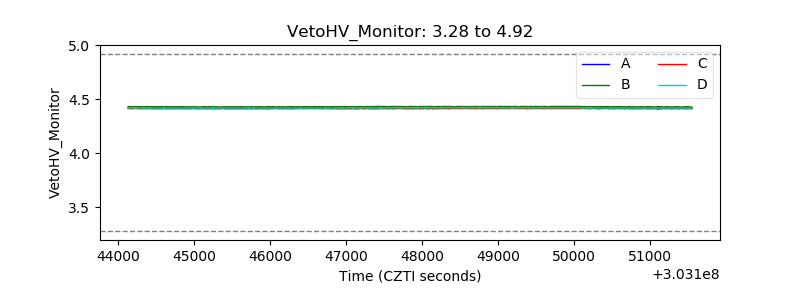 |
| Veto LLD | 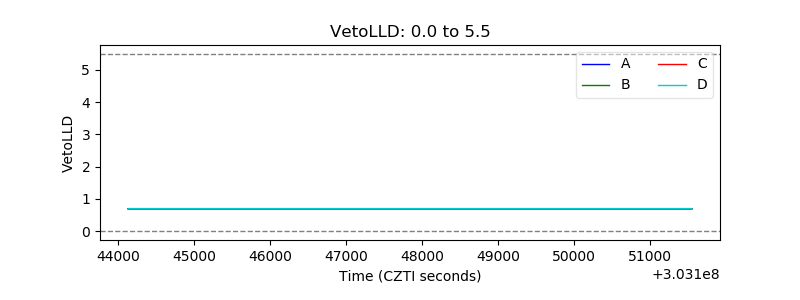 |
| Alpha Counter | 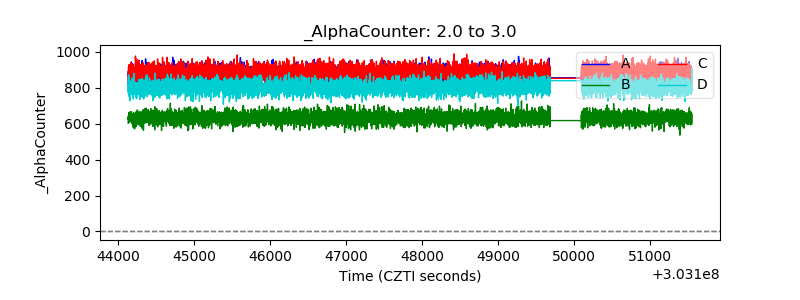 |
| _CPM_Rate | 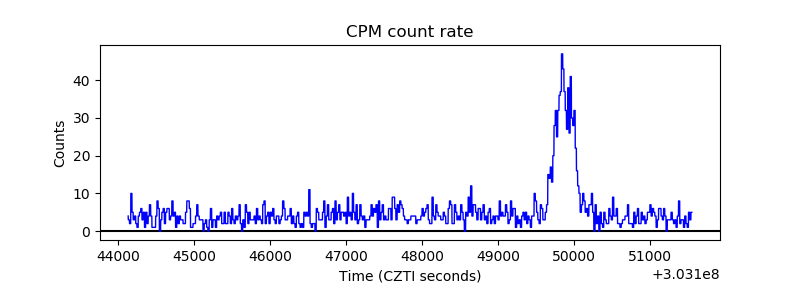 |
| CZT Counter | 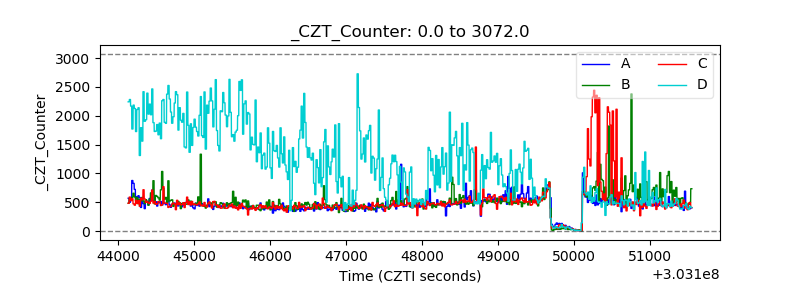 |
| +2.5 Volts monitor |  |
| +5 Volts monitor |  |
| _ROLL_ROT | 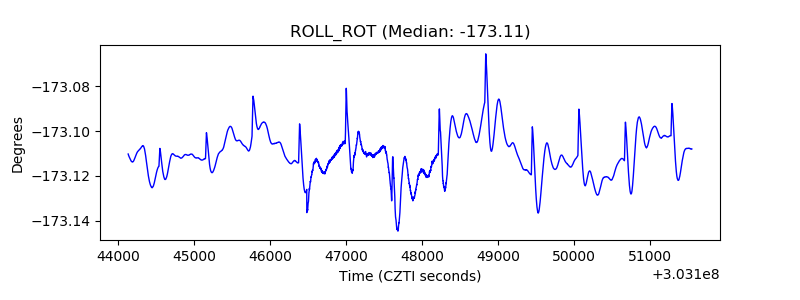 |
| _Roll_DEC | 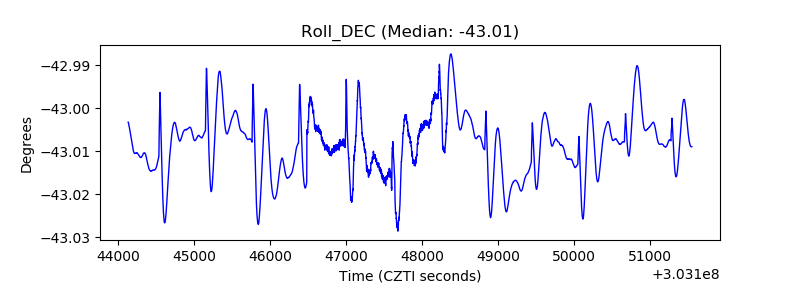 |
| _Roll_RA | 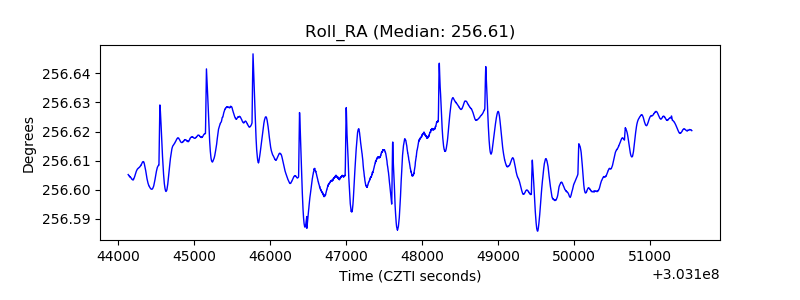 |
| Veto Counter | 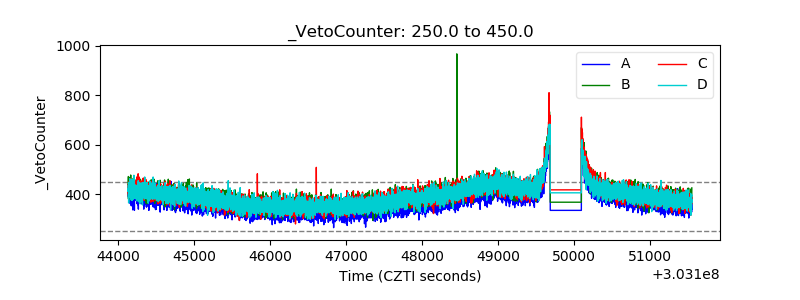 |