| Param | Original file | Final file |
|---|---|---|
| Filename | modeM0/AS1A06_002T03_9000003080_20909cztM0_level2.evt | modeM0/AS1A06_002T03_9000003080_20909cztM0_level2_quad_clean.evt |
| Size (bytes) | 660,674,880 | 115,470,720 |
| Size | 630.1 MB | 110.1 MB |
| Events in quadrant A | 4,547,645 | 732,187 |
| Events in quadrant B | 4,798,622 | 733,583 |
| Events in quadrant C | 4,752,116 | 702,779 |
| Events in quadrant D | 5,282,071 | 686,444 |
| Mode M9 | |||
|---|---|---|---|
| Quadrant | BADHDUFLAG | Total packets | Discarded packets |
| A | 0 | 11 | 0 |
| B | 0 | 12 | 1 |
| C | 0 | 12 | 2 |
| D | 0 | 12 | 1 |
| Mode M0 | |||
|---|---|---|---|
| Quadrant | BADHDUFLAG | Total packets | Discarded packets |
| A | 0 | 24224 | 4623 |
| B | 0 | 24704 | 4441 |
| C | 0 | 25079 | 4867 |
| D | 0 | 26524 | 4717 |
| Mode SS | |||
|---|---|---|---|
| Quadrant | BADHDUFLAG | Total packets | Discarded packets |
| A | 0 | 229 | 35 |
| B | 0 | 228 | 38 |
| C | 0 | 230 | 46 |
| D | 0 | 231 | 41 |
| Quadrant | Total seconds | Saturated seconds | Saturation percentage |
|---|---|---|---|
| A | 9263 | 74 | 0.798877% |
| B | 9248 | 117 | 1.265138% |
| C | 9209 | 244 | 2.649582% |
| D | 9260 | 262 | 2.829374% |
Noise dominated data is calculated using 1-second bins in cleaned event files. If a bin has >2000 counts, and if more than 50% of those come from <1% of pixels, then it is considered to be noise-dominated and hence unusable.
| Quadrant | # 1 sec bins | Bins with >0 counts | Bins with >2000 counts | High rate bins dominated by noise | Noise dominated (total time) | Noise dominated (detector-on time) | Marked lightcurve |
|---|---|---|---|---|---|---|---|
| A | 12826 | 9787 | 22 | 22 | 0.17% | 0.22% |  |
| B | 12822 | 9792 | 24 | 24 | 0.19% | 0.25% | 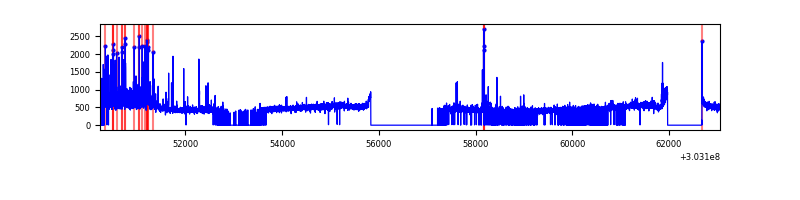 |
| C | 12778 | 9720 | 104 | 104 | 0.81% | 1.07% | 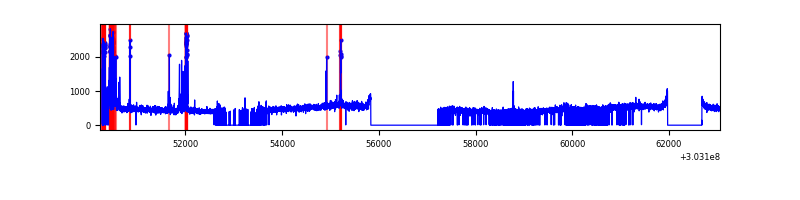 |
| D | 12818 | 9773 | 250 | 250 | 1.95% | 2.56% |  |
Top three noisy pixels from each quadrant. If the there are fewer than three noisy pixels in the level2.evt file, extra rows are filled as -1
| Pixel properties | Quadrant properties | ||||||
|---|---|---|---|---|---|---|---|
| Quadrant | DetID | PixID | Counts | Sigma | Mean | Median | Sigma |
| A | 6 | 16 | 186549 | 824.71 | 1110 | 1086 | 224.9 |
| A | 15 | 174 | 53263 | 232.02 | 1110 | 1086 | 224.9 |
| A | 5 | 16 | 42779 | 185.4 | 1110 | 1086 | 224.9 |
| B | 7 | 220 | 283892 | 1335.12 | 1105 | 1077 | 211.8 |
| B | 0 | 228 | 55362 | 256.27 | 1105 | 1077 | 211.8 |
| B | 0 | 190 | 37712 | 172.95 | 1105 | 1077 | 211.8 |
| C | 9 | 54 | 444464 | 1800.9 | 1054 | 1061 | 246.2 |
| C | 14 | 238 | 166389 | 671.49 | 1054 | 1061 | 246.2 |
| C | 10 | 91 | 12634 | 47.0 | 1054 | 1061 | 246.2 |
| D | 1 | 52 | 1065525 | 4125.76 | 1070 | 1040 | 258.0 |
| D | 7 | 38 | 130217 | 500.67 | 1070 | 1040 | 258.0 |
| D | 2 | 234 | 48023 | 182.1 | 1070 | 1040 | 258.0 |
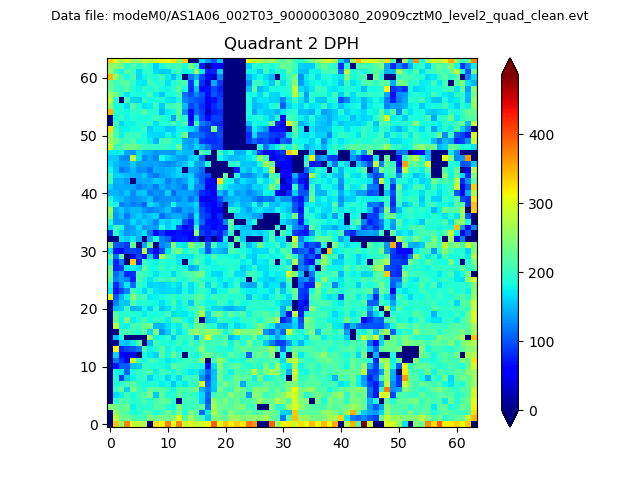
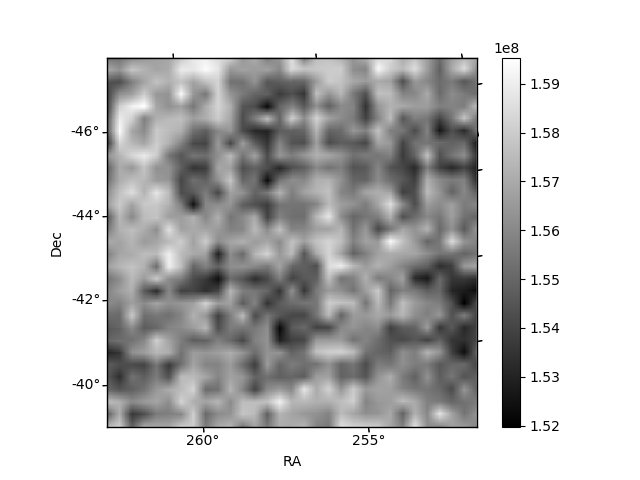
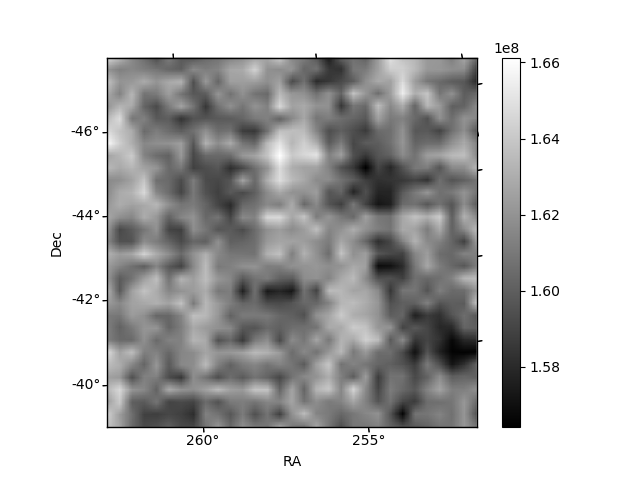
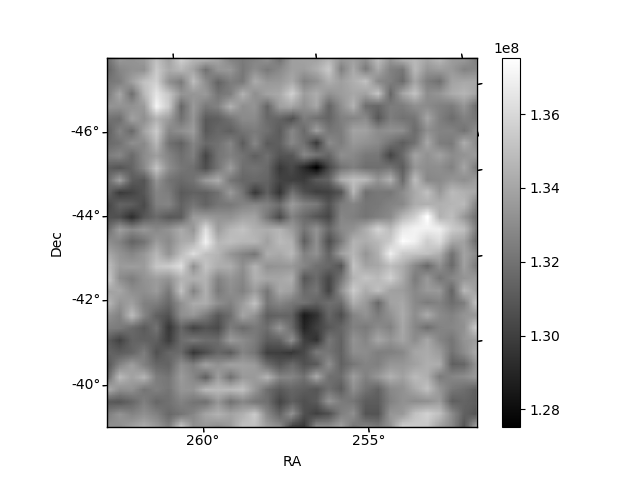
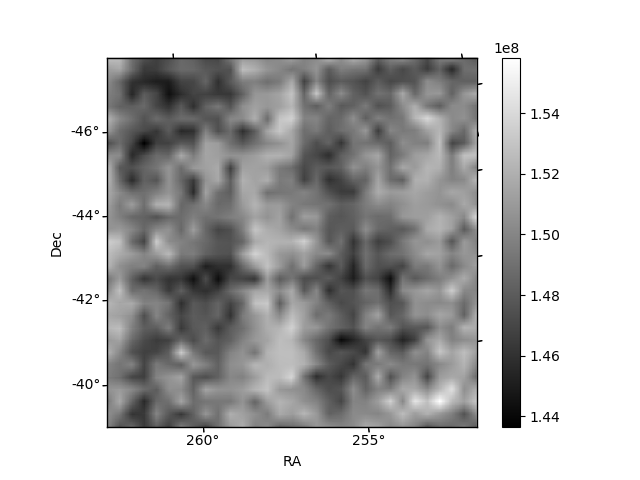
Histogram calculated using DETX and DETY for each event in the final _common_clean file
| Quadrant A | 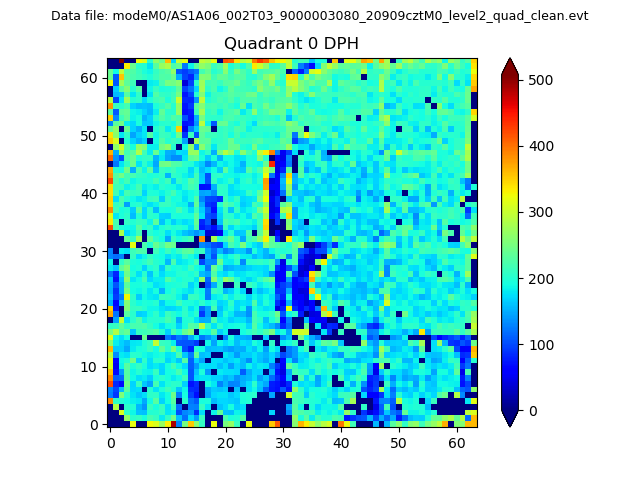 |
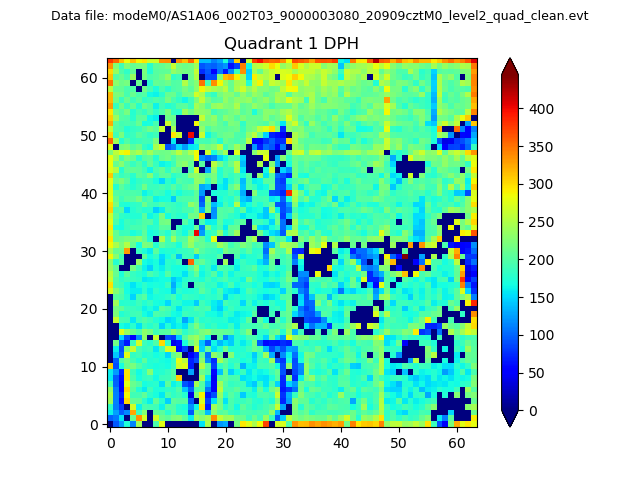 |
Quadrant B |
|---|---|---|---|
| Quadrant D | 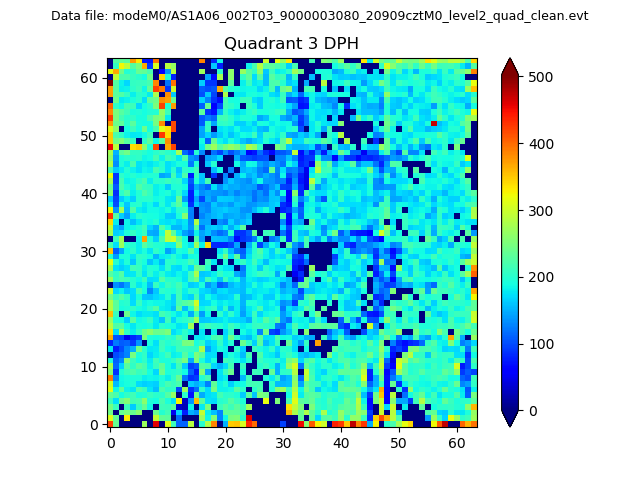 |
 |
Quadrant C |
| Plot type | Count rate plots | Images |
|---|---|---|
| Comparison with Poisson distribution Blue bars denote a histogram of data divided into 1 sec bins. Red curve is a Poisson curve with rate = median count rate of data. |
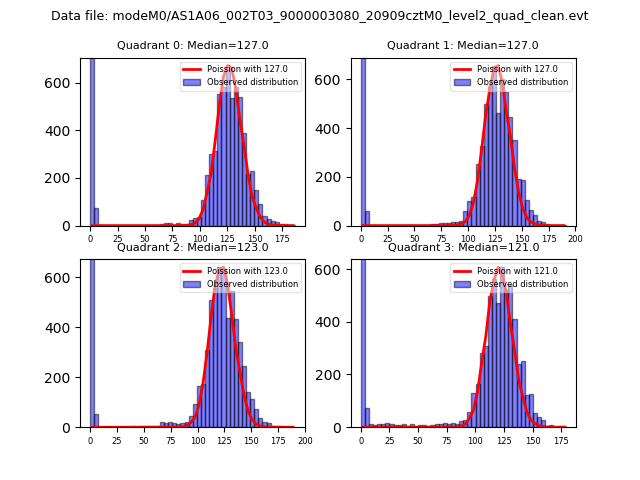 |
 |
| Quadrant-wise count rates Data is divided into 100 sec bins |
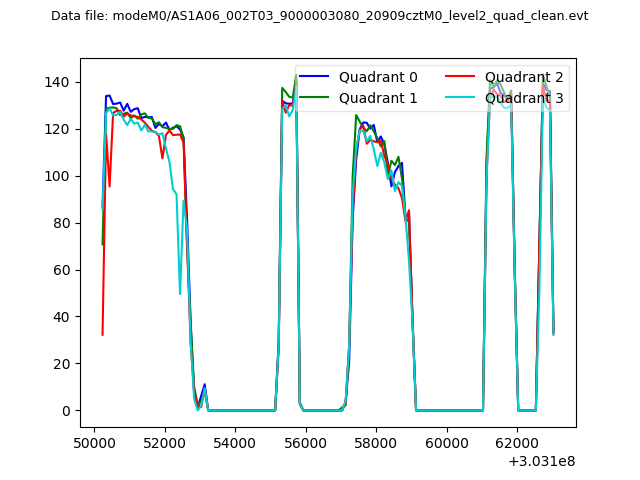 |
|
| Module-wise count rates for Quadrant A Data is divided into 100 sec bins |
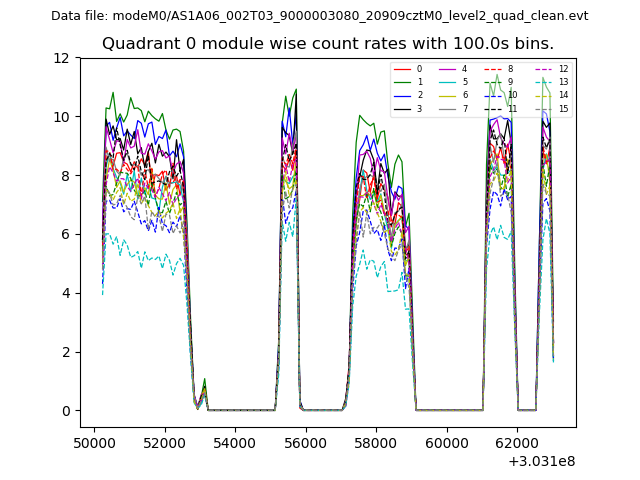 |
 |
| Module-wise count rates for Quadrant B Data is divided into 100 sec bins |
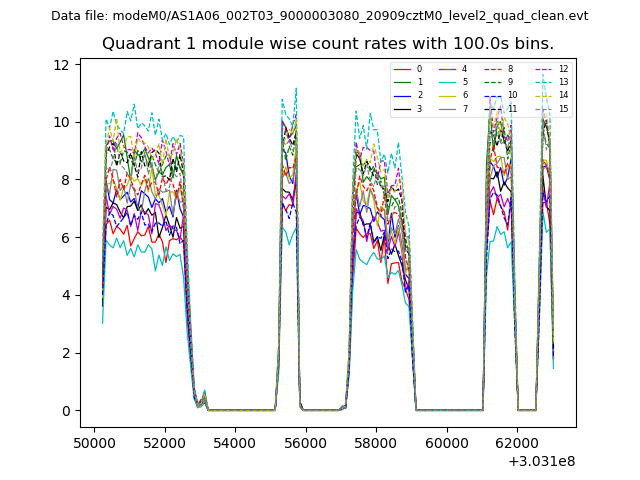 |
 |
| Module-wise count rates for Quadrant C Data is divided into 100 sec bins |
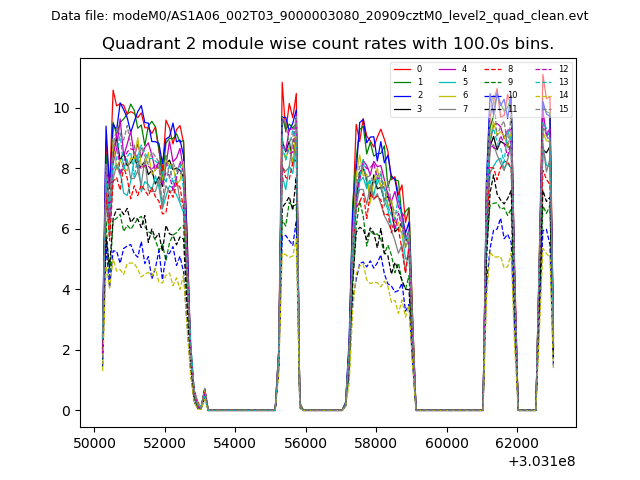 |
 |
| Module-wise count rates for Quadrant D Data is divided into 100 sec bins |
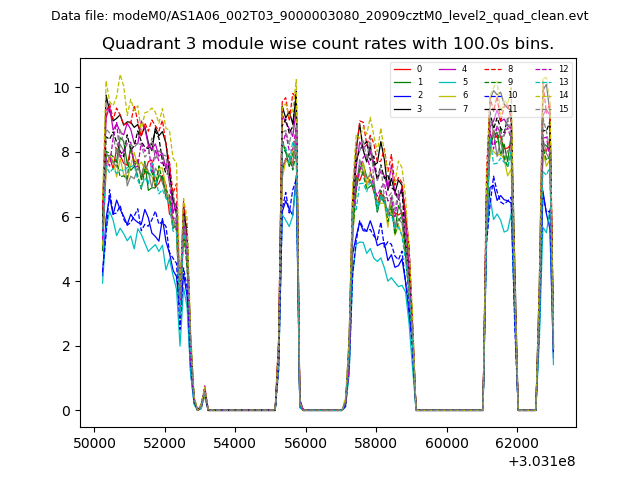 |
 |
| Parameter | Plot |
|---|---|
| CZT HV Monitor | 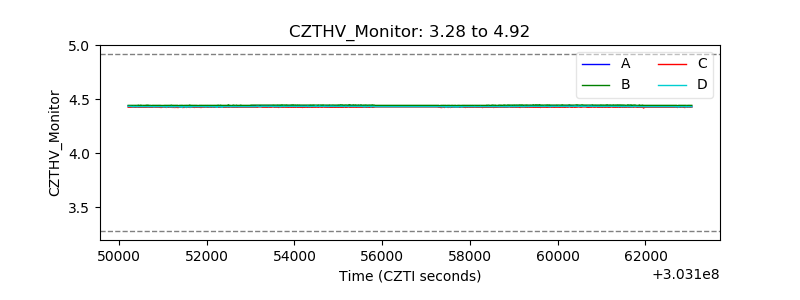 |
| D_VDD | 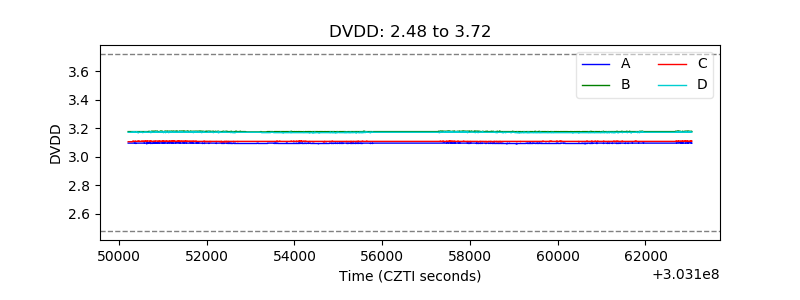 |
| Temperature 1 | 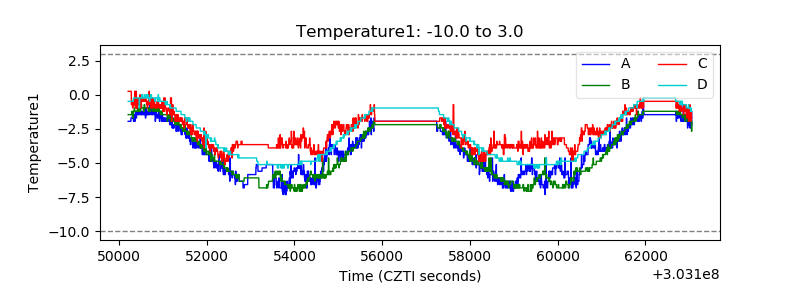 |
| Veto HV Monitor | 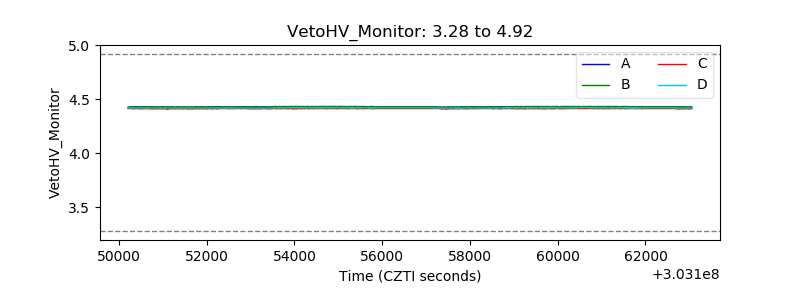 |
| Veto LLD | 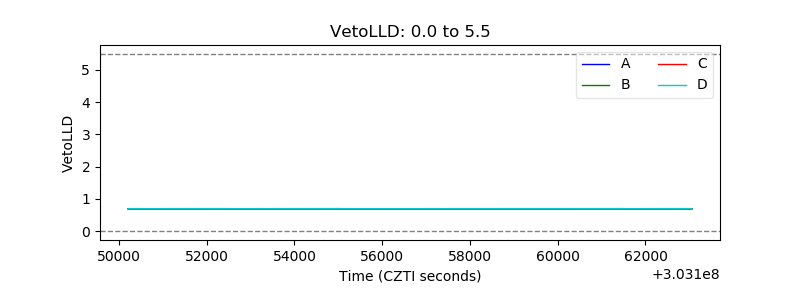 |
| Alpha Counter | 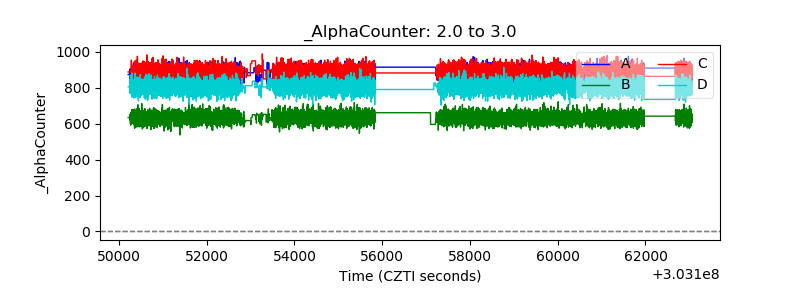 |
| _CPM_Rate | 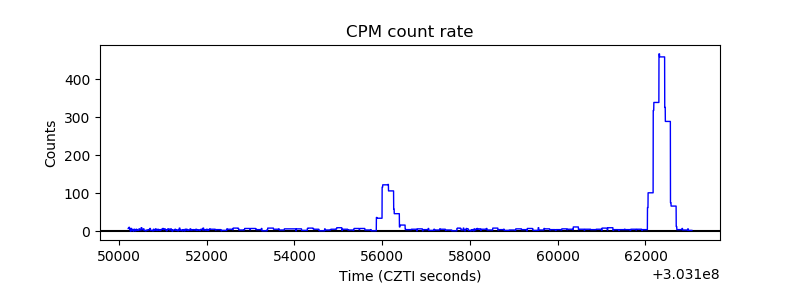 |
| CZT Counter | 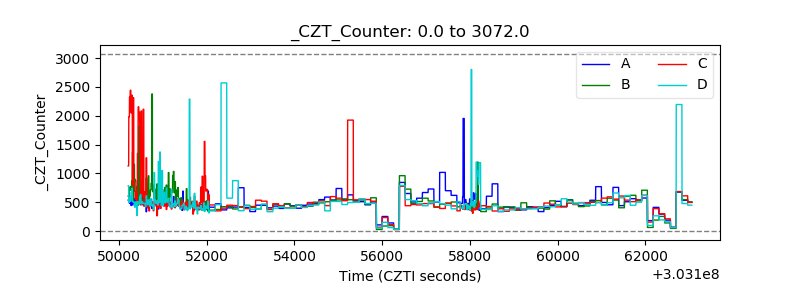 |
| +2.5 Volts monitor |  |
| +5 Volts monitor |  |
| _ROLL_ROT | 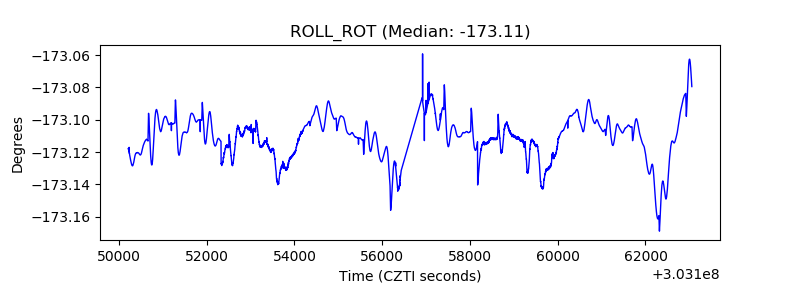 |
| _Roll_DEC | 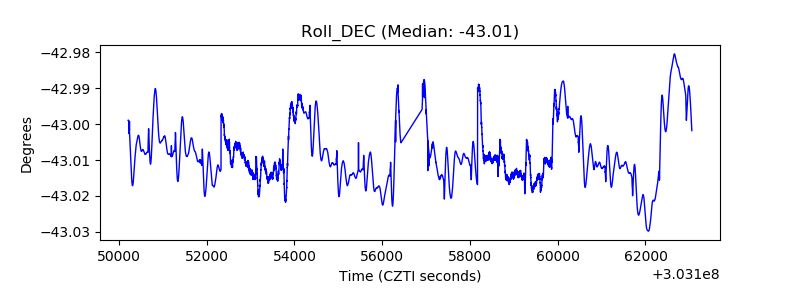 |
| _Roll_RA | 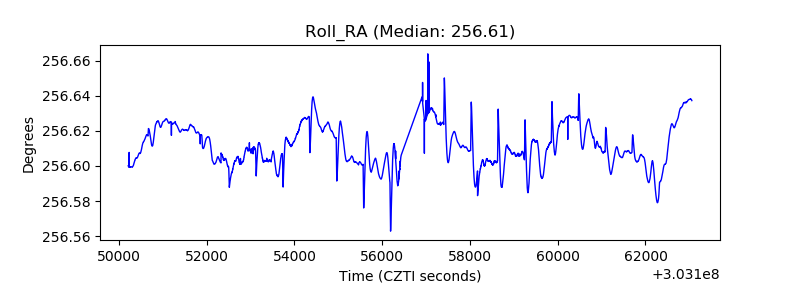 |
| Veto Counter | 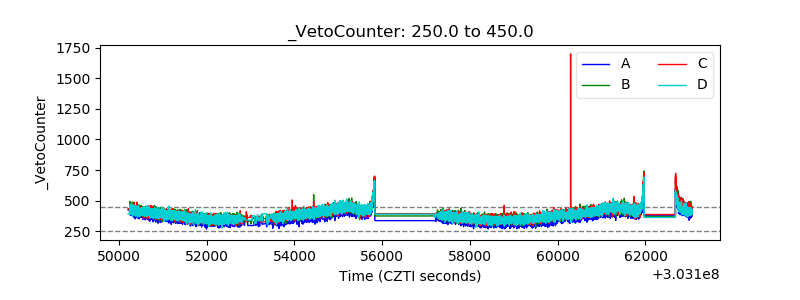 |