| Param | Original file | Final file |
|---|---|---|
| Filename | modeM0/AS1A06_002T03_9000003080_20911cztM0_level2.evt | modeM0/AS1A06_002T03_9000003080_20911cztM0_level2_quad_clean.evt |
| Size (bytes) | 720,754,560 | 130,377,600 |
| Size | 687.4 MB | 124.3 MB |
| Events in quadrant A | 5,087,554 | 822,607 |
| Events in quadrant B | 5,176,660 | 826,463 |
| Events in quadrant C | 5,059,374 | 804,048 |
| Events in quadrant D | 5,802,356 | 777,698 |
| Mode M9 | |||
|---|---|---|---|
| Quadrant | BADHDUFLAG | Total packets | Discarded packets |
| A | 0 | 12 | 5 |
| B | 0 | 11 | 4 |
| C | 0 | 10 | 3 |
| D | 0 | 12 | 5 |
| Mode M0 | |||
|---|---|---|---|
| Quadrant | BADHDUFLAG | Total packets | Discarded packets |
| A | 0 | 23631 | 1486 |
| B | 0 | 23713 | 1477 |
| C | 0 | 23415 | 1468 |
| D | 0 | 25906 | 1669 |
| Mode SS | |||
|---|---|---|---|
| Quadrant | BADHDUFLAG | Total packets | Discarded packets |
| A | 0 | 226 | 18 |
| B | 0 | 225 | 17 |
| C | 0 | 225 | 19 |
| D | 0 | 226 | 12 |
| Quadrant | Total seconds | Saturated seconds | Saturation percentage |
|---|---|---|---|
| A | 10363 | 79 | 0.762328% |
| B | 10368 | 96 | 0.925926% |
| C | 10354 | 158 | 1.525980% |
| D | 10379 | 256 | 2.466519% |
Noise dominated data is calculated using 1-second bins in cleaned event files. If a bin has >2000 counts, and if more than 50% of those come from <1% of pixels, then it is considered to be noise-dominated and hence unusable.
| Quadrant | # 1 sec bins | Bins with >0 counts | Bins with >2000 counts | High rate bins dominated by noise | Noise dominated (total time) | Noise dominated (detector-on time) | Marked lightcurve |
|---|---|---|---|---|---|---|---|
| A | 11264 | 10524 | 23 | 23 | 0.20% | 0.22% | 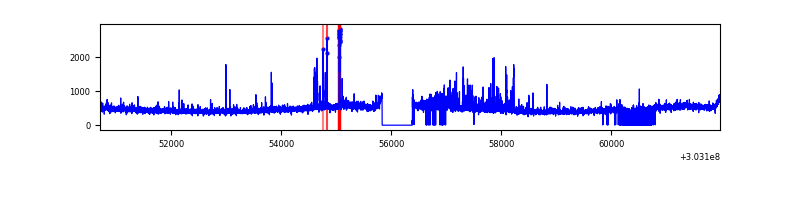 |
| B | 11264 | 10523 | 17 | 17 | 0.15% | 0.16% | 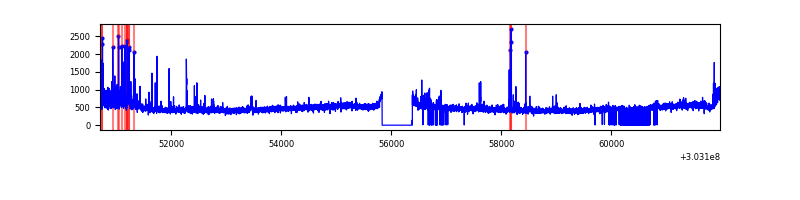 |
| C | 11264 | 10520 | 41 | 41 | 0.36% | 0.39% | 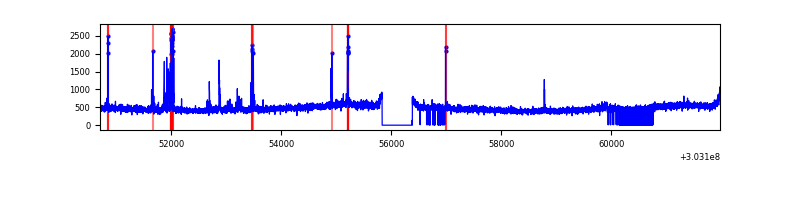 |
| D | 11265 | 10556 | 270 | 270 | 2.40% | 2.56% | 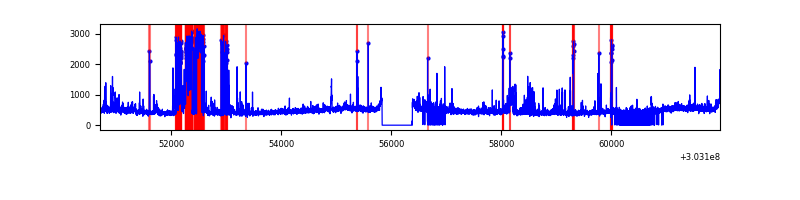 |
Top three noisy pixels from each quadrant. If the there are fewer than three noisy pixels in the level2.evt file, extra rows are filled as -1
| Pixel properties | Quadrant properties | ||||||
|---|---|---|---|---|---|---|---|
| Quadrant | DetID | PixID | Counts | Sigma | Mean | Median | Sigma |
| A | 6 | 16 | 287038 | 1155.6 | 1223 | 1199 | 247.4 |
| A | 15 | 174 | 57948 | 229.43 | 1223 | 1199 | 247.4 |
| A | 5 | 16 | 43584 | 171.36 | 1223 | 1199 | 247.4 |
| B | 7 | 220 | 187801 | 795.81 | 1223 | 1194 | 234.5 |
| B | 0 | 228 | 60669 | 253.64 | 1223 | 1194 | 234.5 |
| B | 0 | 190 | 38184 | 157.75 | 1223 | 1194 | 234.5 |
| C | 9 | 54 | 271508 | 991.02 | 1170 | 1179 | 272.8 |
| C | 14 | 238 | 184566 | 672.29 | 1170 | 1179 | 272.8 |
| C | 0 | 207 | 18574 | 63.77 | 1170 | 1179 | 272.8 |
| D | 1 | 52 | 1213629 | 4210.4 | 1183 | 1147 | 288.0 |
| D | 7 | 38 | 82004 | 280.78 | 1183 | 1147 | 288.0 |
| D | 2 | 234 | 54174 | 184.14 | 1183 | 1147 | 288.0 |
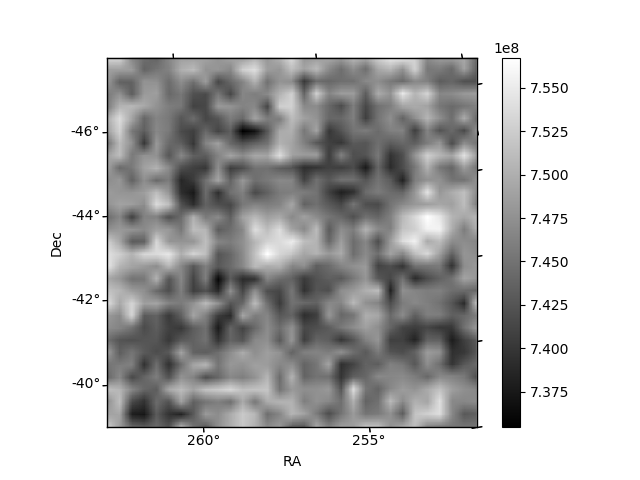
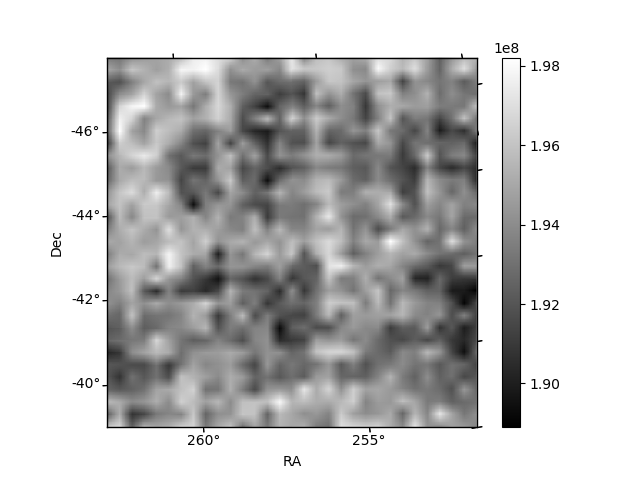
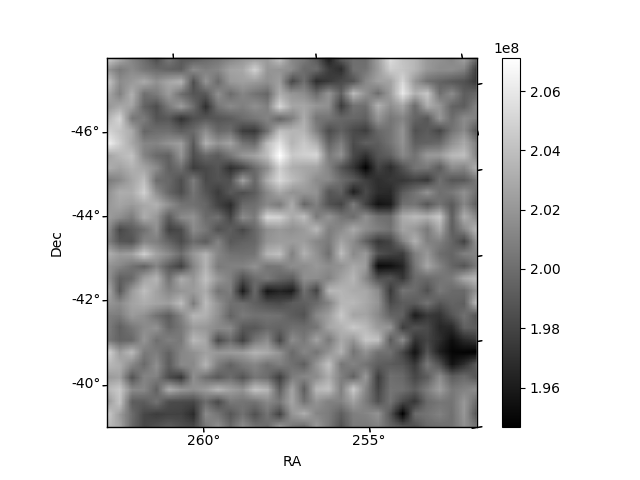
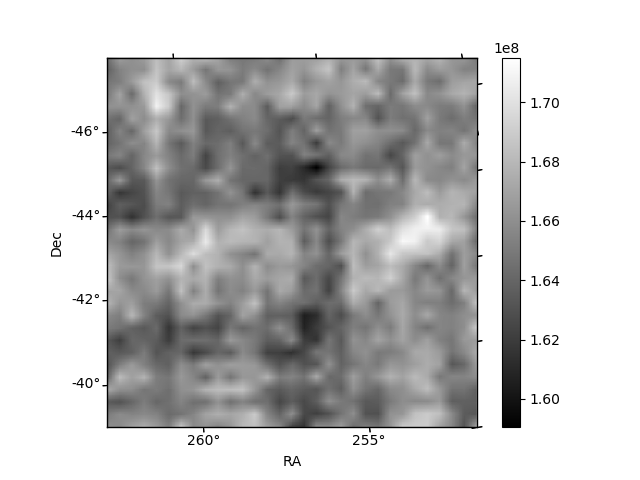
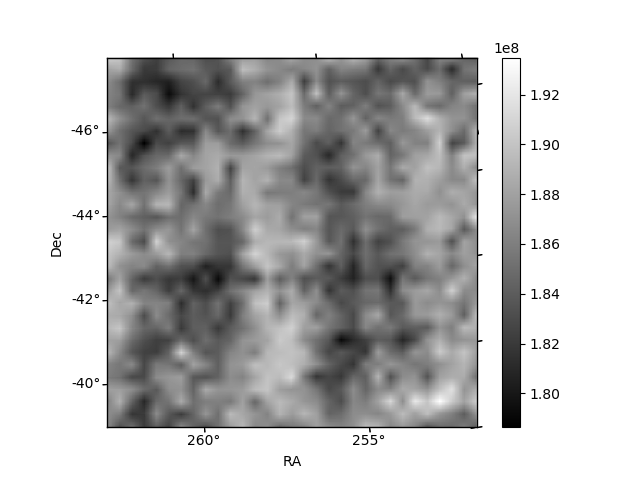
Histogram calculated using DETX and DETY for each event in the final _common_clean file
| Quadrant A | 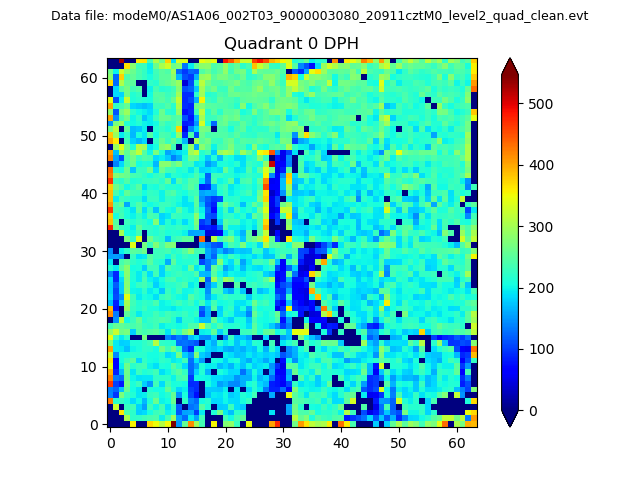 |
 |
Quadrant B |
|---|---|---|---|
| Quadrant D | 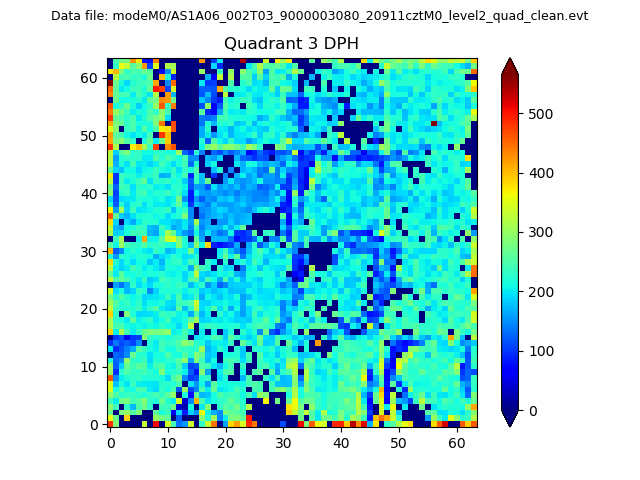 |
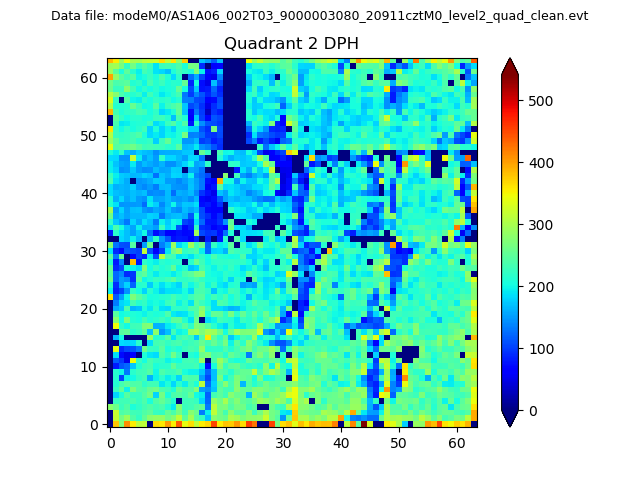 |
Quadrant C |
| Plot type | Count rate plots | Images |
|---|---|---|
| Comparison with Poisson distribution Blue bars denote a histogram of data divided into 1 sec bins. Red curve is a Poisson curve with rate = median count rate of data. |
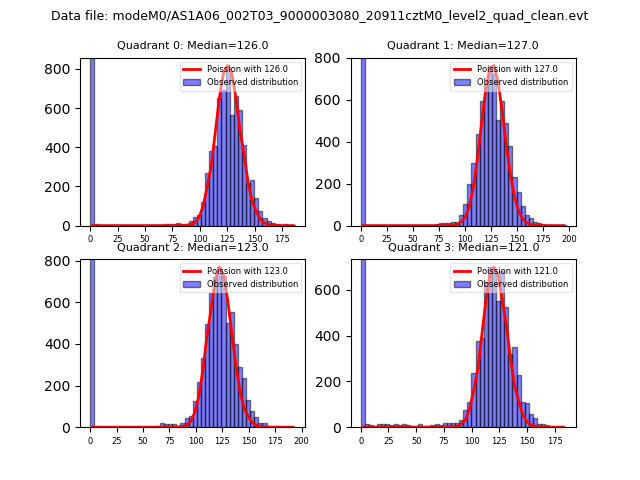 |
 |
| Quadrant-wise count rates Data is divided into 100 sec bins |
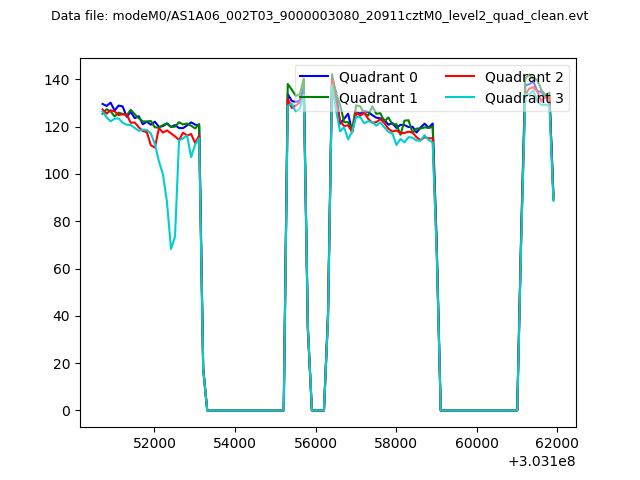 |
|
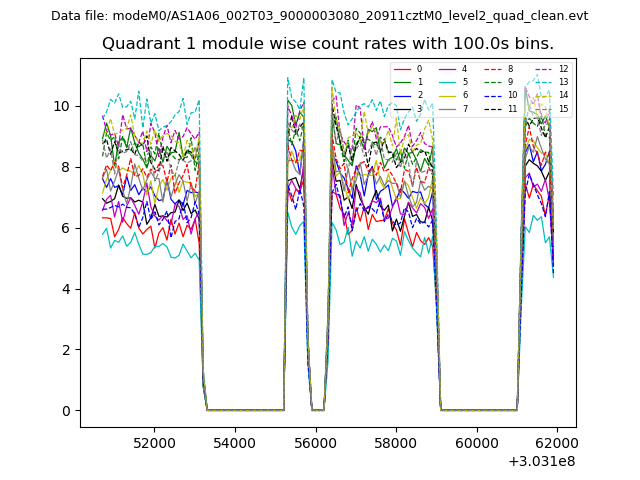
| Module-wise count rates for Quadrant A Data is divided into 100 sec bins |
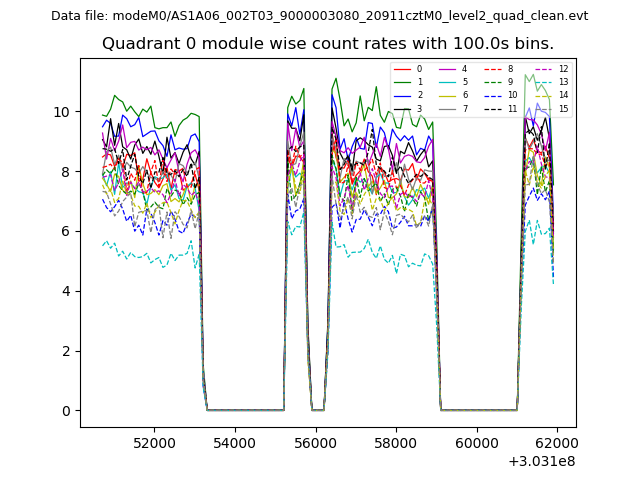 |
 |
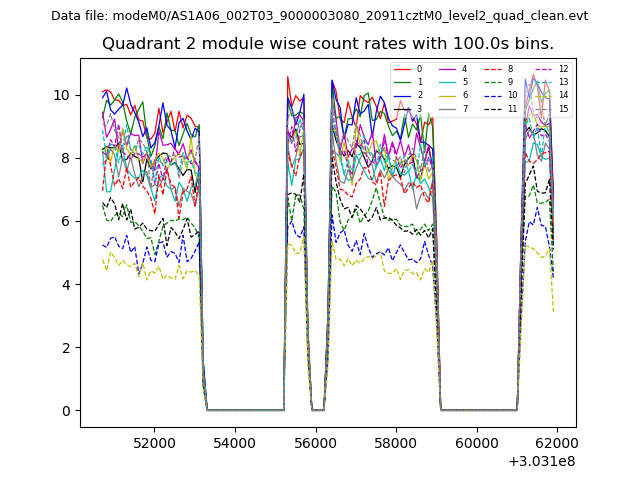
| Module-wise count rates for Quadrant B Data is divided into 100 sec bins |
 |
 |
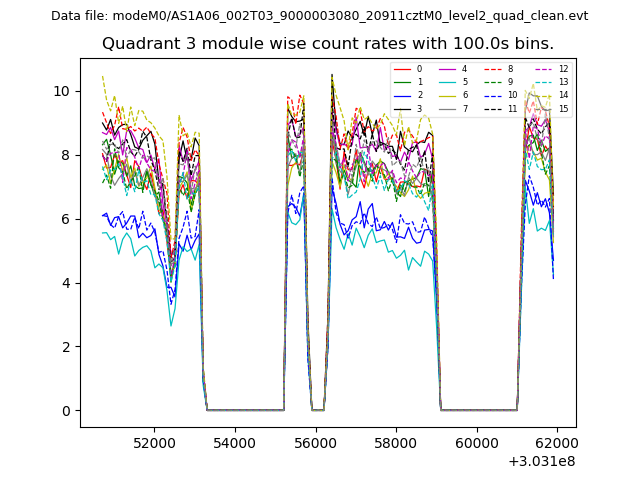
| Module-wise count rates for Quadrant C Data is divided into 100 sec bins |
 |
 |
| Module-wise count rates for Quadrant D Data is divided into 100 sec bins |
 |
 |
| Parameter | Plot |
|---|---|
| CZT HV Monitor | 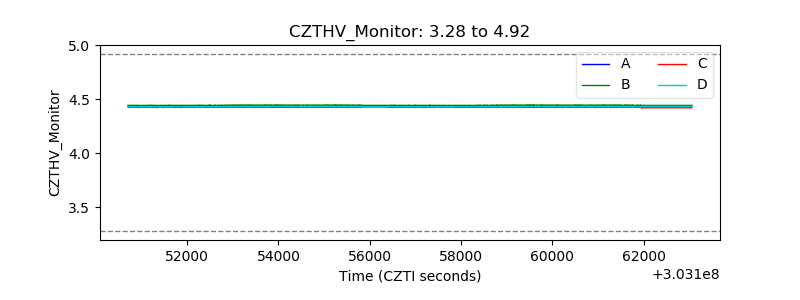 |
| D_VDD | 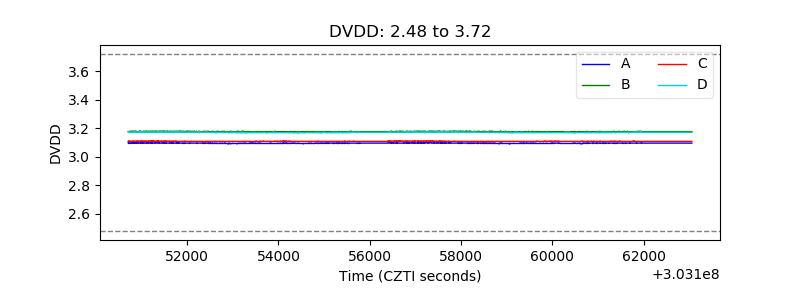 |
| Temperature 1 | 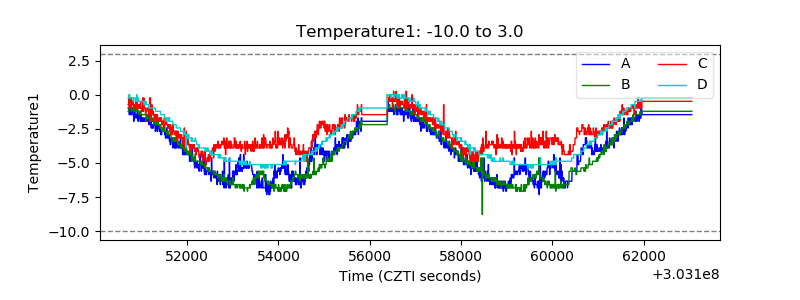 |
| Veto HV Monitor |  |
| Veto LLD | 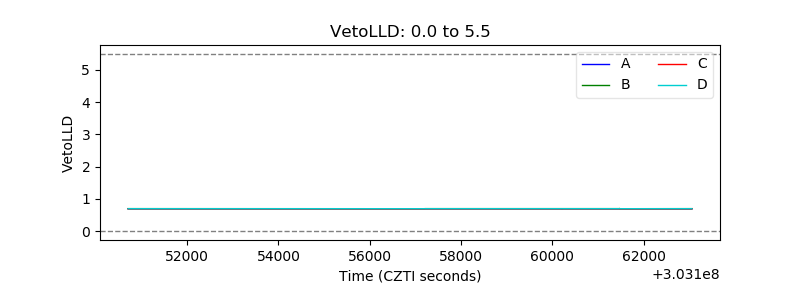 |
| Alpha Counter | 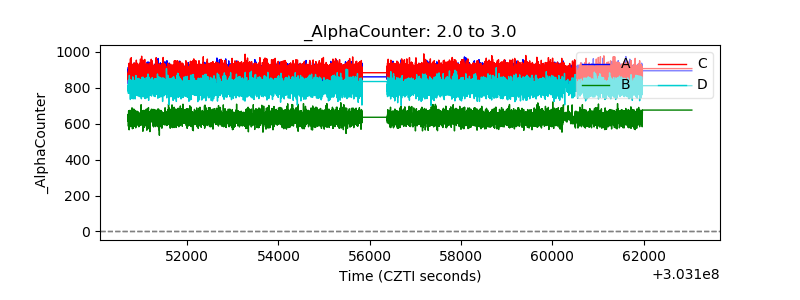 |
| _CPM_Rate | 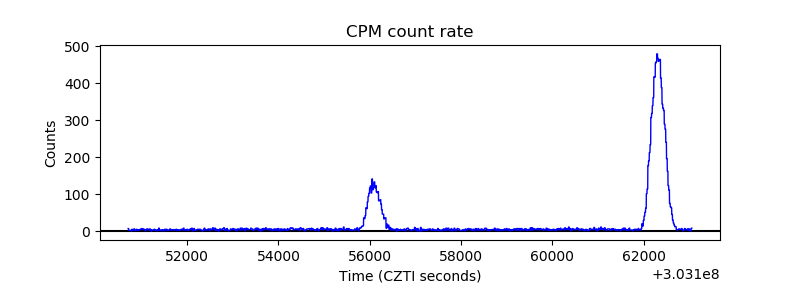 |
| CZT Counter | 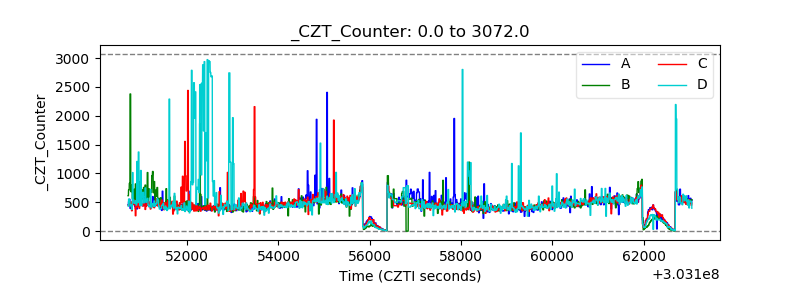 |
| +2.5 Volts monitor |  |
| +5 Volts monitor |  |
| _ROLL_ROT | 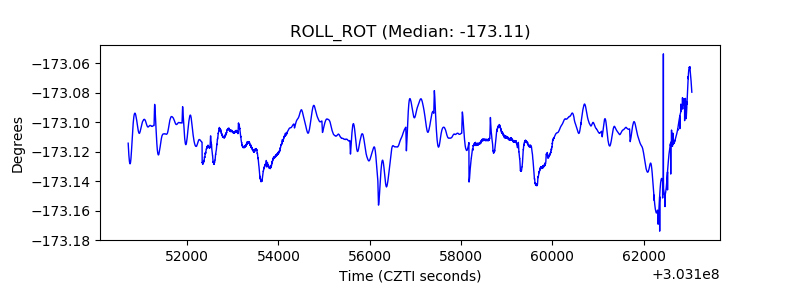 |
| _Roll_DEC | 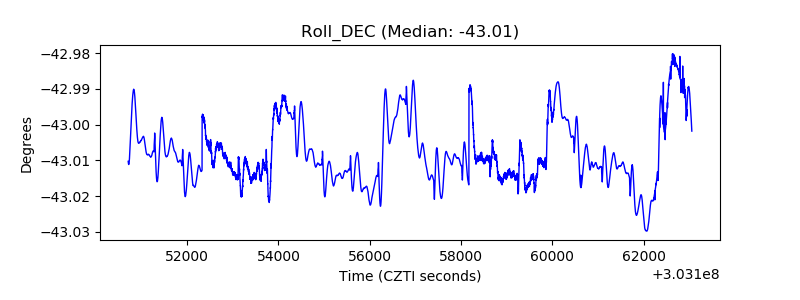 |
| _Roll_RA | 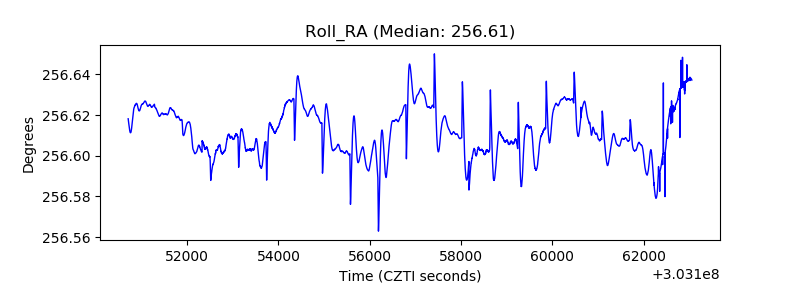 |
| Veto Counter | 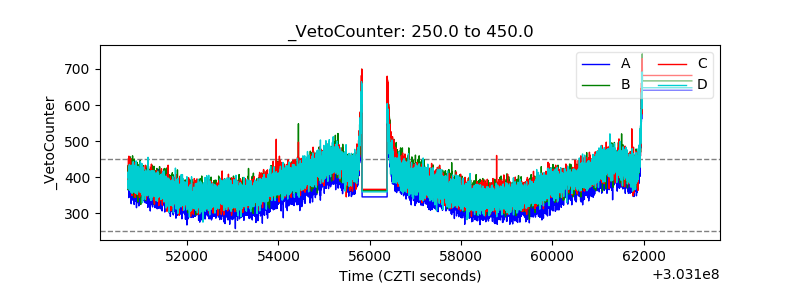 |