| Param | Original file | Final file |
|---|---|---|
| Filename | modeM0/AS1A06_002T03_9000003080_20914cztM0_level2.evt | modeM0/AS1A06_002T03_9000003080_20914cztM0_level2_quad_clean.evt |
| Size (bytes) | 773,660,160 | 138,340,800 |
| Size | 737.8 MB | 131.9 MB |
| Events in quadrant A | 5,457,534 | 871,696 |
| Events in quadrant B | 5,550,433 | 876,364 |
| Events in quadrant C | 5,427,577 | 851,904 |
| Events in quadrant D | 6,243,878 | 822,508 |
| Mode M9 | |||
|---|---|---|---|
| Quadrant | BADHDUFLAG | Total packets | Discarded packets |
| A | 0 | 12 | 0 |
| B | 0 | 12 | 0 |
| C | 0 | 12 | 0 |
| D | 0 | 12 | 0 |
| Mode M0 | |||
|---|---|---|---|
| Quadrant | BADHDUFLAG | Total packets | Discarded packets |
| A | 0 | 23687 | 4 |
| B | 0 | 23779 | 19 |
| C | 0 | 23474 | 12 |
| D | 0 | 25992 | 8 |
| Mode SS | |||
|---|---|---|---|
| Quadrant | BADHDUFLAG | Total packets | Discarded packets |
| A | 0 | 226 | 0 |
| B | 0 | 226 | 2 |
| C | 0 | 226 | 0 |
| D | 0 | 226 | 0 |
| Quadrant | Total seconds | Saturated seconds | Saturation percentage |
|---|---|---|---|
| A | 11088 | 81 | 0.730519% |
| B | 11084 | 105 | 0.947311% |
| C | 11085 | 170 | 1.533604% |
| D | 11087 | 293 | 2.642735% |
Noise dominated data is calculated using 1-second bins in cleaned event files. If a bin has >2000 counts, and if more than 50% of those come from <1% of pixels, then it is considered to be noise-dominated and hence unusable.
| Quadrant | # 1 sec bins | Bins with >0 counts | Bins with >2000 counts | High rate bins dominated by noise | Noise dominated (total time) | Noise dominated (detector-on time) | Marked lightcurve |
|---|---|---|---|---|---|---|---|
| A | 12349 | 11091 | 23 | 23 | 0.19% | 0.21% | 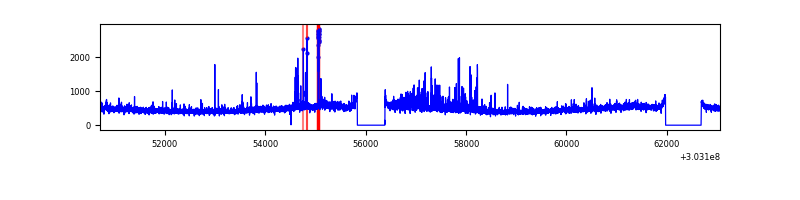 |
| B | 12349 | 11091 | 18 | 18 | 0.15% | 0.16% | 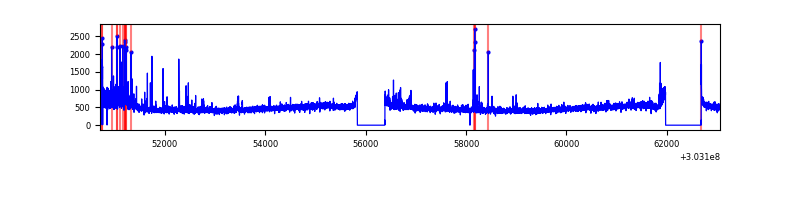 |
| C | 12350 | 11092 | 41 | 41 | 0.33% | 0.37% | 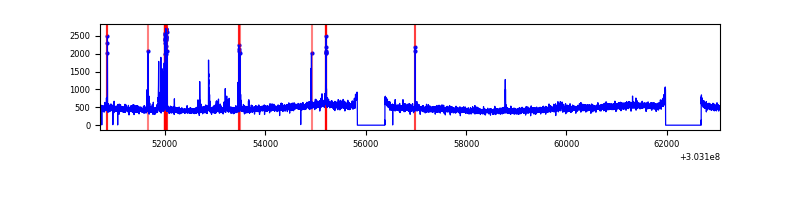 |
| D | 12350 | 11092 | 282 | 282 | 2.28% | 2.54% | 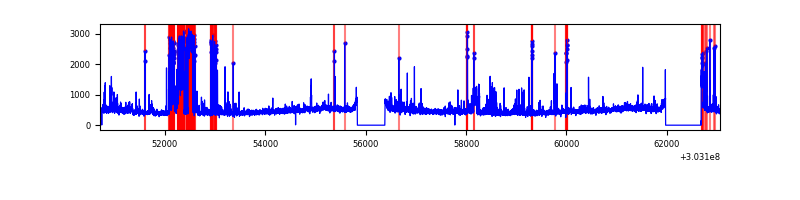 |
Top three noisy pixels from each quadrant. If the there are fewer than three noisy pixels in the level2.evt file, extra rows are filled as -1
| Pixel properties | Quadrant properties | ||||||
|---|---|---|---|---|---|---|---|
| Quadrant | DetID | PixID | Counts | Sigma | Mean | Median | Sigma |
| A | 6 | 16 | 298696 | 1116.9 | 1316 | 1289 | 266.3 |
| A | 15 | 174 | 58082 | 213.28 | 1316 | 1289 | 266.3 |
| A | 5 | 16 | 43637 | 159.04 | 1316 | 1289 | 266.3 |
| B | 7 | 220 | 186074 | 733.69 | 1315 | 1281 | 251.9 |
| B | 0 | 228 | 61422 | 238.78 | 1315 | 1281 | 251.9 |
| B | 0 | 190 | 40137 | 154.27 | 1315 | 1281 | 251.9 |
| C | 9 | 54 | 271897 | 921.78 | 1260 | 1267 | 293.6 |
| C | 14 | 238 | 198917 | 673.2 | 1260 | 1267 | 293.6 |
| C | 0 | 207 | 18813 | 59.76 | 1260 | 1267 | 293.6 |
| D | 1 | 52 | 1245293 | 4026.44 | 1270 | 1232 | 309.0 |
| D | 7 | 38 | 154278 | 495.34 | 1270 | 1232 | 309.0 |
| D | 2 | 234 | 57652 | 182.61 | 1270 | 1232 | 309.0 |
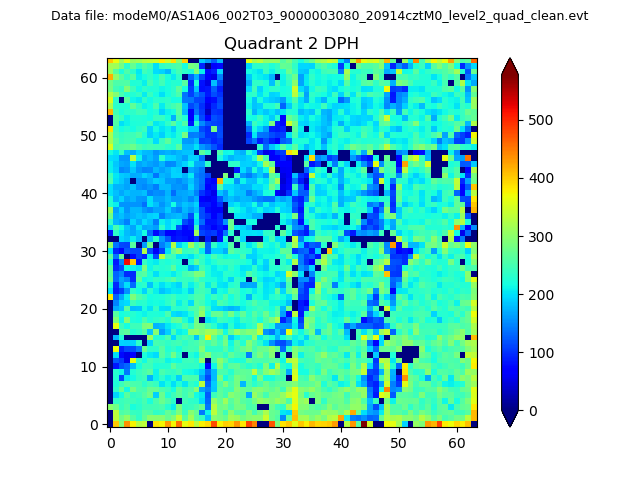
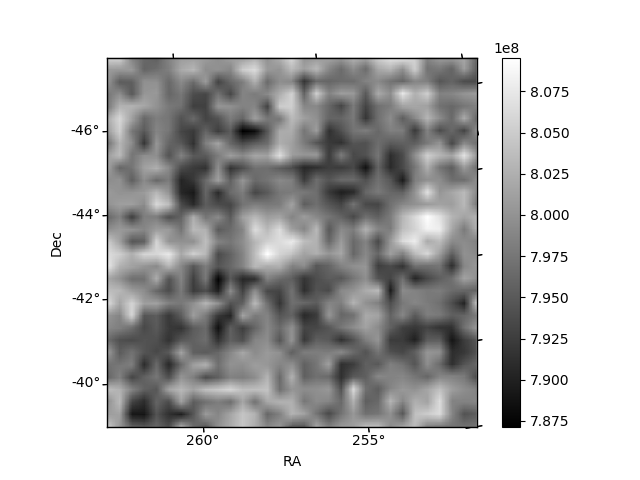
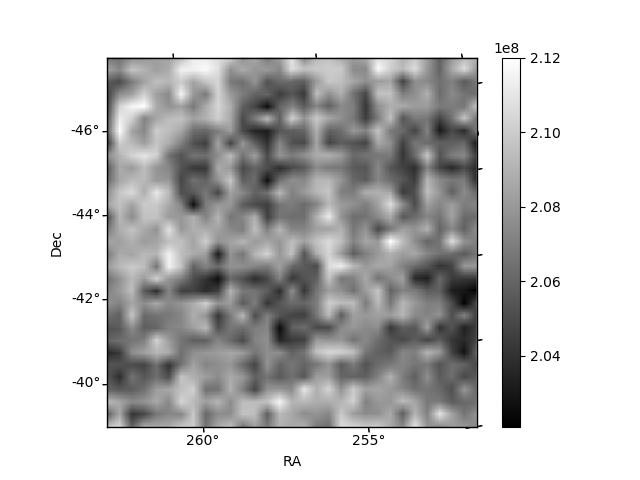
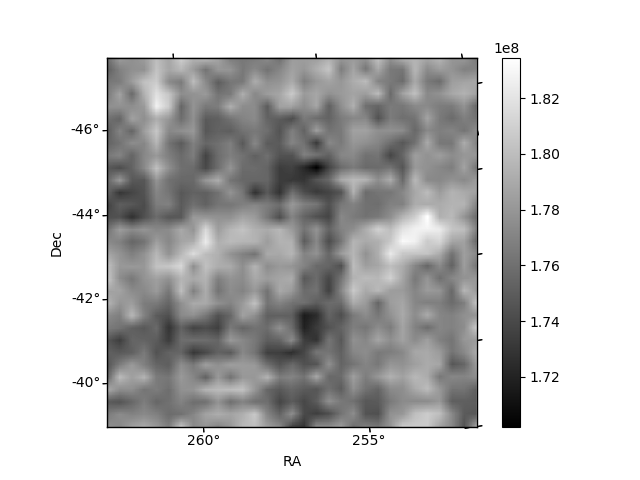
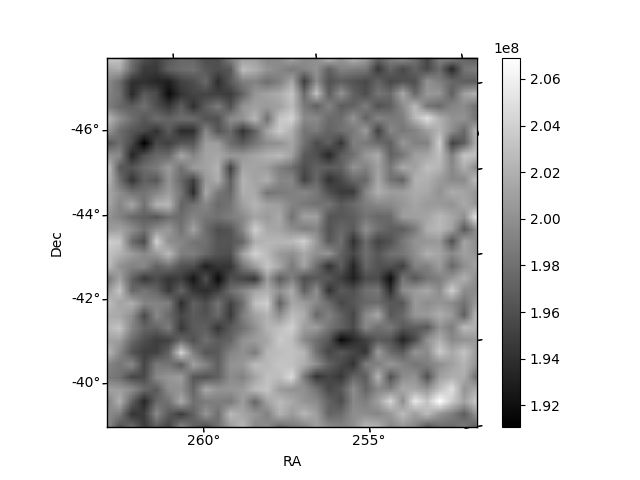
Histogram calculated using DETX and DETY for each event in the final _common_clean file
| Quadrant A | 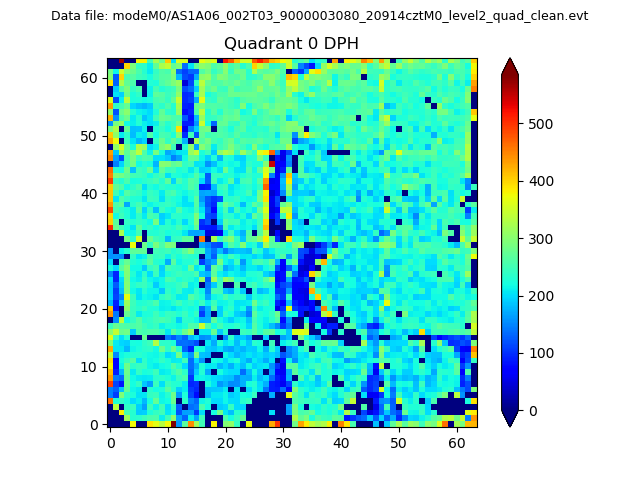 |
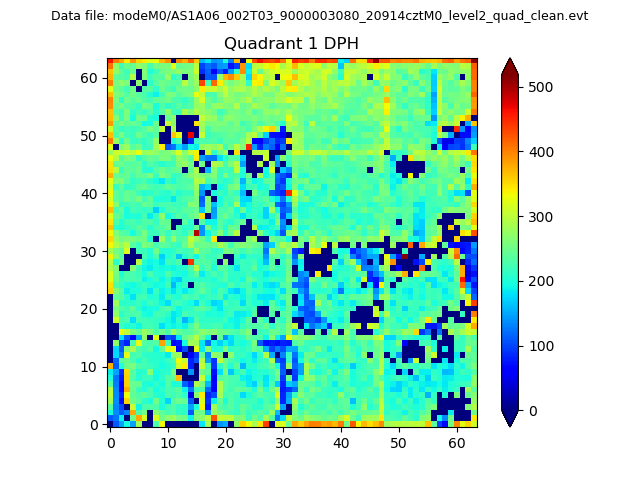 |
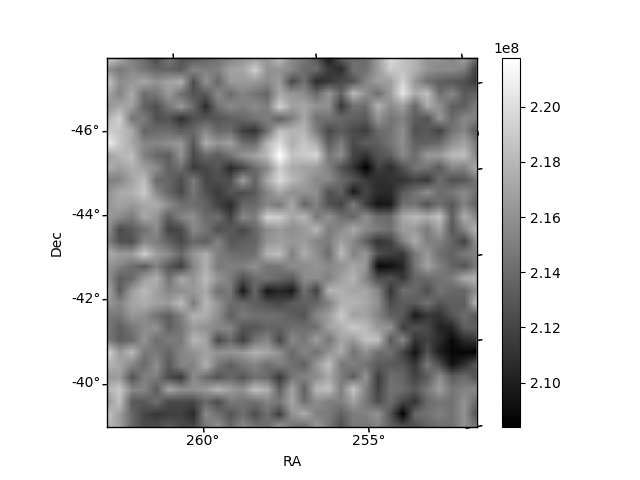
Quadrant B |
|---|---|---|---|
| Quadrant D | 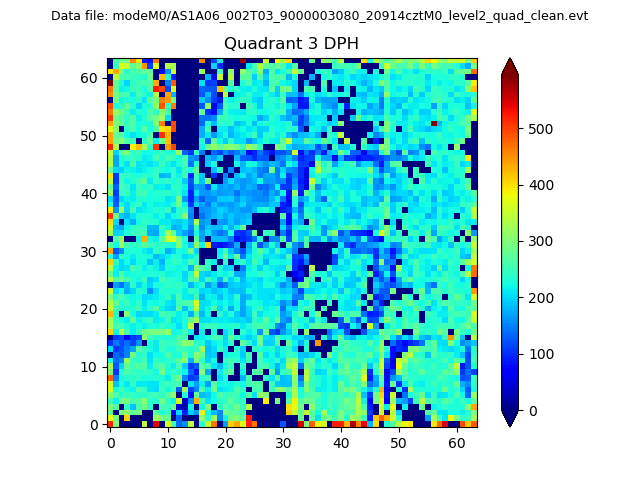 |
 |
Quadrant C |
| Plot type | Count rate plots | Images |
|---|---|---|
| Comparison with Poisson distribution Blue bars denote a histogram of data divided into 1 sec bins. Red curve is a Poisson curve with rate = median count rate of data. |
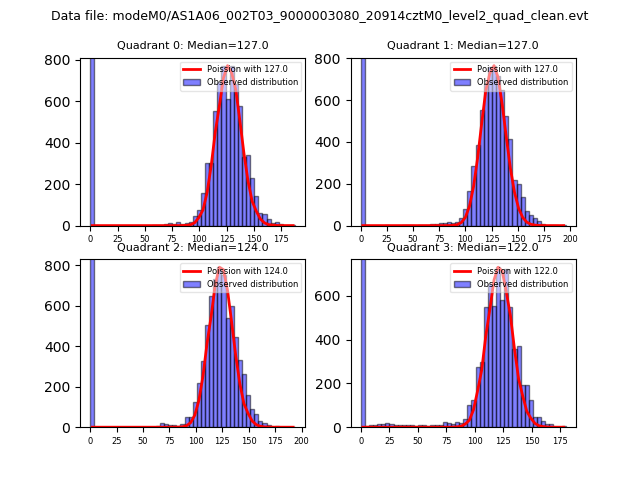 |
 |
| Quadrant-wise count rates Data is divided into 100 sec bins |
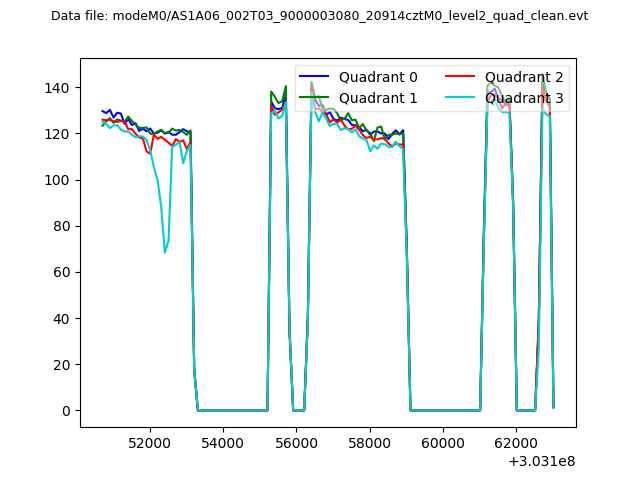 |
|
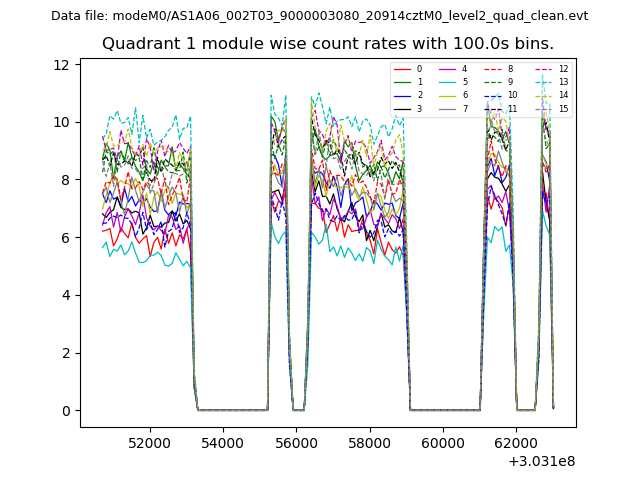
| Module-wise count rates for Quadrant A Data is divided into 100 sec bins |
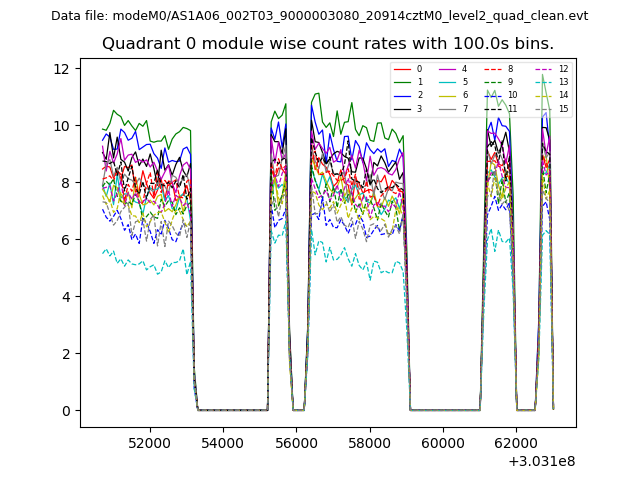 |
 |
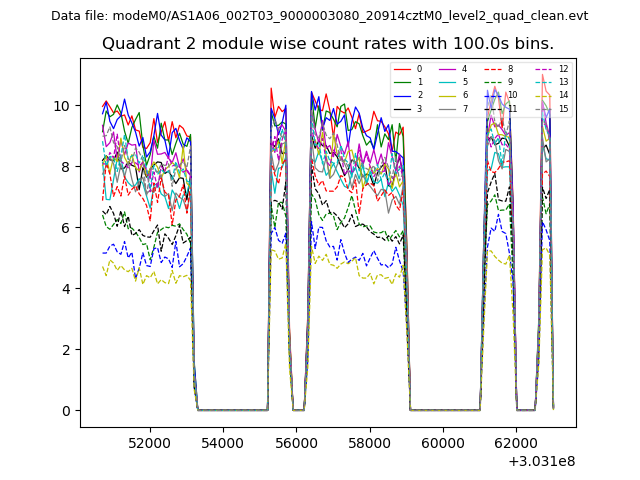
| Module-wise count rates for Quadrant B Data is divided into 100 sec bins |
 |
 |
| Module-wise count rates for Quadrant C Data is divided into 100 sec bins |
 |
 |
| Module-wise count rates for Quadrant D Data is divided into 100 sec bins |
 |
 |
| Parameter | Plot |
|---|---|
| CZT HV Monitor | 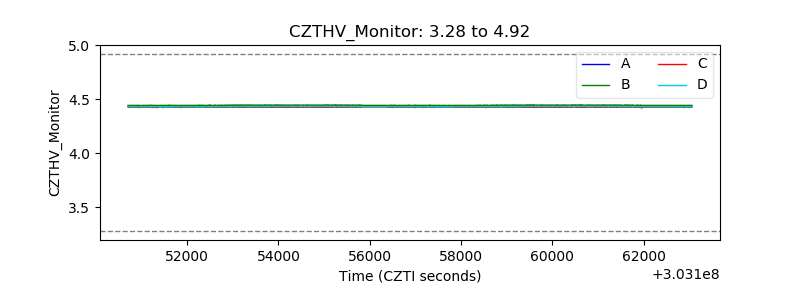 |
| D_VDD | 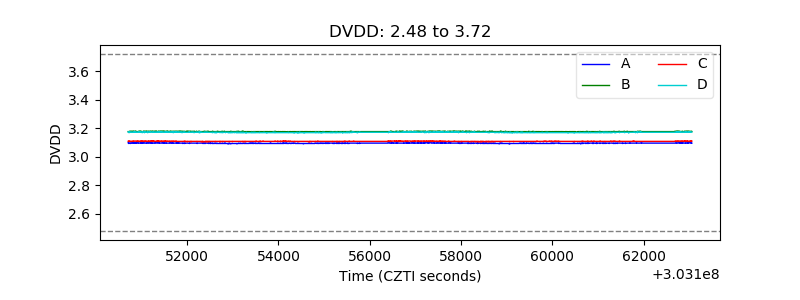 |
| Temperature 1 | 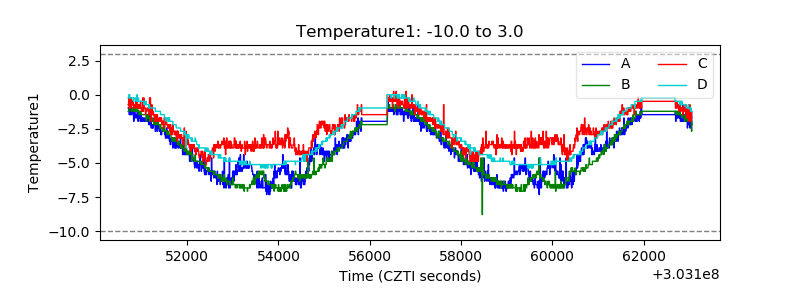 |
| Veto HV Monitor | 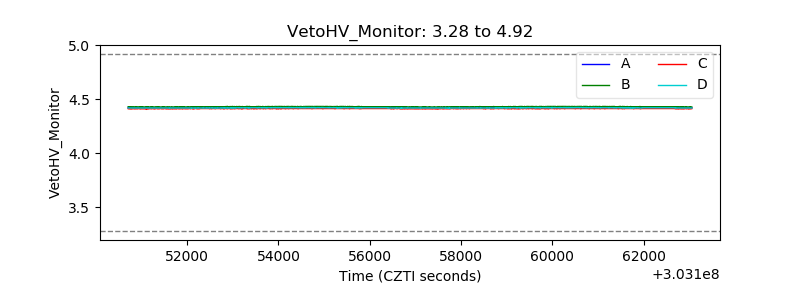 |
| Veto LLD | 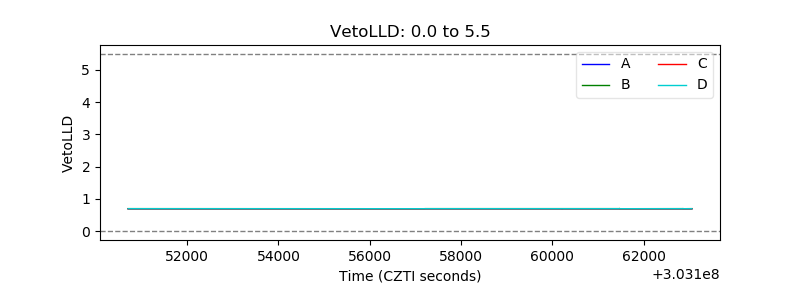 |
| Alpha Counter | 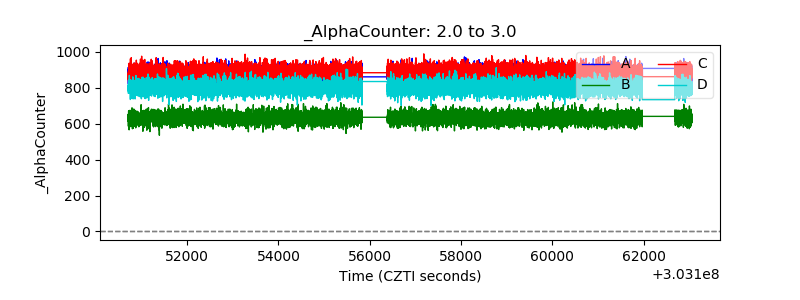 |
| _CPM_Rate | 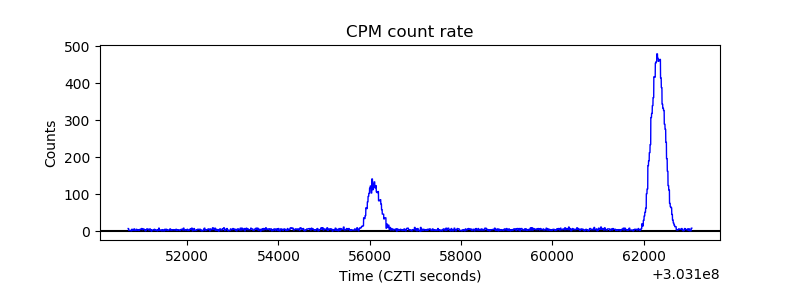 |
| CZT Counter | 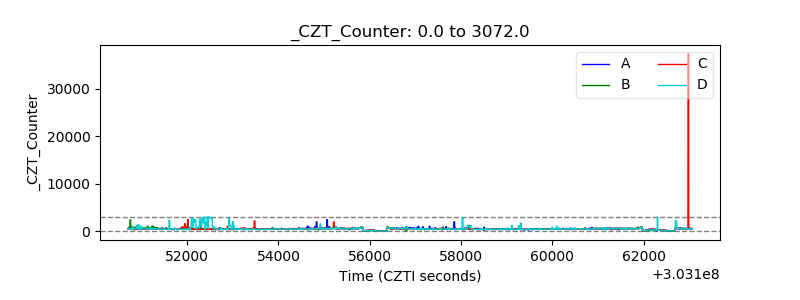 |
| +2.5 Volts monitor |  |
| +5 Volts monitor |  |
| _ROLL_ROT | 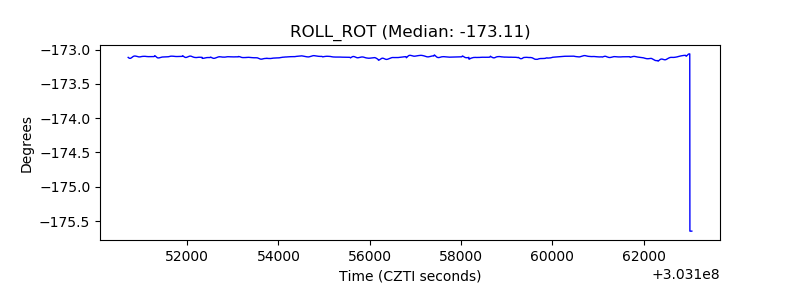 |
| _Roll_DEC | 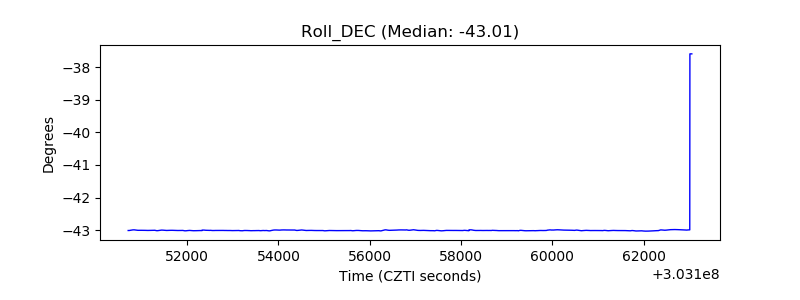 |
| _Roll_RA | 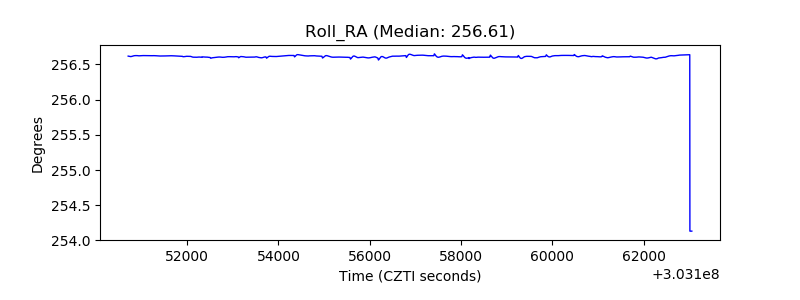 |
| Veto Counter | 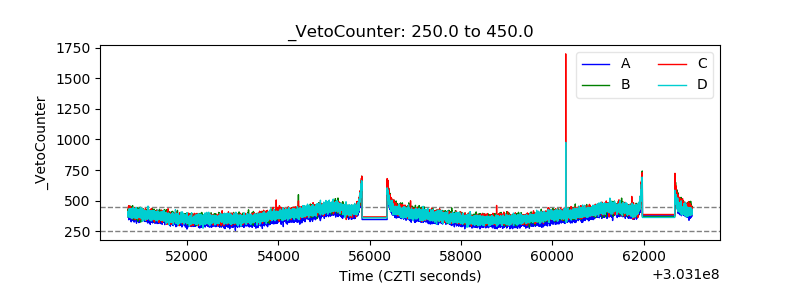 |