| Param | Original file | Final file |
|---|---|---|
| Filename | modeM0/AS1C04_001T01_9000003082cztM0_level2.fits | modeM0/AS1C04_001T01_9000003082cztM0_level2_quad_clean.evt |
| Size (bytes) | 842,820,480 | 1,116,768,960 |
| Size | 803.8 MB | 1.0 GB |
| Events in quadrant A | 5,191,630 | 7,315,341 |
| Events in quadrant B | 4,922,136 | 7,180,754 |
| Events in quadrant C | 5,005,342 | 6,883,477 |
| Events in quadrant D | 4,384,682 | 6,426,227 |
| Mode SS | |||
|---|---|---|---|
| Quadrant | BADHDUFLAG | Total packets | Discarded packets |
| A | 0 | 1798 | 0 |
| B | 0 | 1806 | 0 |
| C | 0 | 1804 | 0 |
| D | 0 | 1804 | 0 |
| Mode M9 | |||
|---|---|---|---|
| Quadrant | BADHDUFLAG | Total packets | Discarded packets |
| A | 0 | 139 | 0 |
| B | 0 | 140 | 0 |
| C | 0 | 140 | 0 |
| D | 0 | 140 | 0 |
| Mode M0 | |||
|---|---|---|---|
| Quadrant | BADHDUFLAG | Total packets | Discarded packets |
| A | 0 | 193736 | 0 |
| B | 0 | 195015 | 0 |
| C | 0 | 180363 | 0 |
| D | 0 | 194199 | 0 |
| Quadrant | Total seconds | Saturated seconds | Saturation percentage |
|---|---|---|---|
| A | 87995 | 1158 | 1.315984% |
| B | 87758 | 1516 | 1.727478% |
| C | 87751 | 1181 | 1.345854% |
| D | 87626 | 1392 | 1.588570% |
Noise dominated data is calculated using 1-second bins in cleaned event files. If a bin has >2000 counts, and if more than 50% of those come from <1% of pixels, then it is considered to be noise-dominated and hence unusable.
| Quadrant | # 1 sec bins | Bins with >0 counts | Bins with >2000 counts | High rate bins dominated by noise | Noise dominated (total time) | Noise dominated (detector-on time) | Marked lightcurve |
|---|---|---|---|---|---|---|---|
| A | 103082 | 88152 | 0 | 0 | 0.00% | 0.00% |  |
| B | 103081 | 87884 | 0 | 0 | 0.00% | 0.00% | 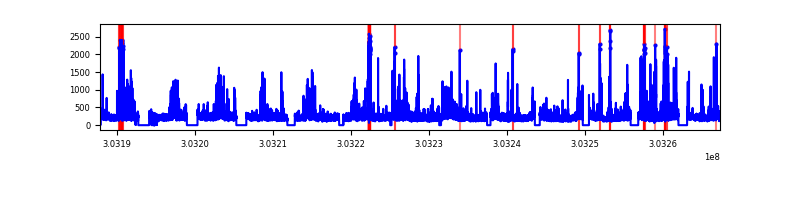 |
| C | 103081 | 87887 | 0 | 0 | 0.00% | 0.00% | 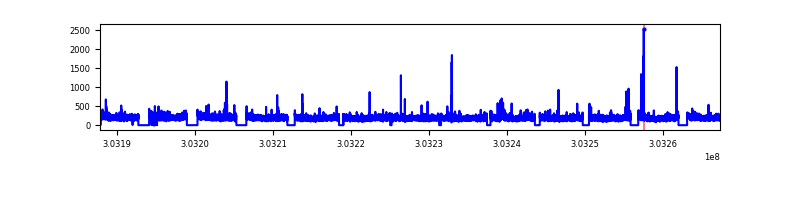 |
| D | 103082 | 87720 | 0 | 0 | 0.00% | 0.00% |  |
Top three noisy pixels from each quadrant. If the there are fewer than three noisy pixels in the level2.evt file, extra rows are filled as -1
| Pixel properties | Quadrant properties | ||||||
|---|---|---|---|---|---|---|---|
| Quadrant | DetID | PixID | Counts | Sigma | Mean | Median | Sigma |
| A | 0 | 29 | 5241 | 11.98 | 1354 | 1279 | 330.8 |
| A | 7 | 110 | 4182 | 8.78 | 1354 | 1279 | 330.8 |
| A | 0 | 30 | 4093 | 8.51 | 1354 | 1279 | 330.8 |
| B | 2 | 9 | 3974 | 10.77 | 1303 | 1248 | 253.0 |
| B | 2 | 8 | 3384 | 8.44 | 1303 | 1248 | 253.0 |
| B | 14 | 254 | 3306 | 8.13 | 1303 | 1248 | 253.0 |
| C | 12 | 250 | 3491 | 6.68 | 1322 | 1239 | 337.2 |
| C | 12 | 241 | 3490 | 6.68 | 1322 | 1239 | 337.2 |
| C | 12 | 249 | 3431 | 6.5 | 1322 | 1239 | 337.2 |
| D | 3 | 14 | 3242 | 6.28 | 1254 | 1145 | 333.7 |
| D | 6 | 231 | 3167 | 6.06 | 1254 | 1145 | 333.7 |
| D | 15 | 46 | 3108 | 5.88 | 1254 | 1145 | 333.7 |
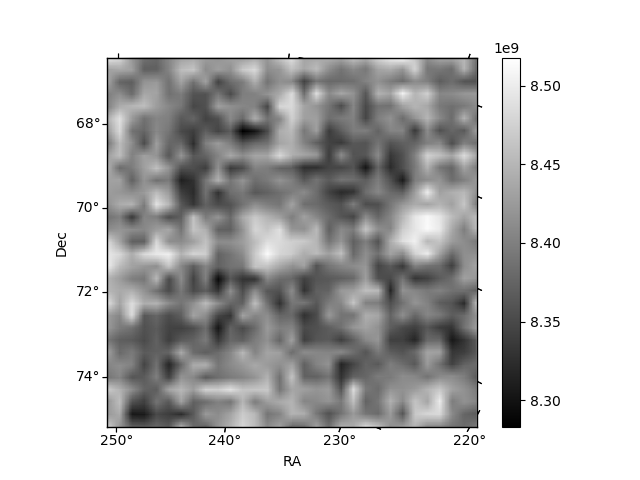
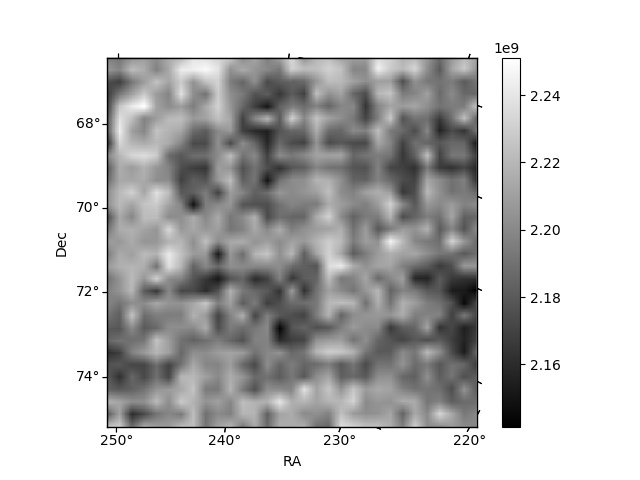
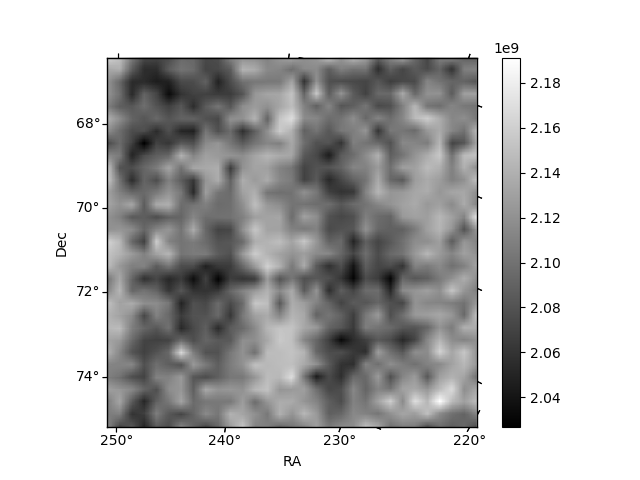
Histogram calculated using DETX and DETY for each event in the final _common_clean file
| Quadrant A |  |
 |
Quadrant B |
|---|---|---|---|
| Quadrant D | 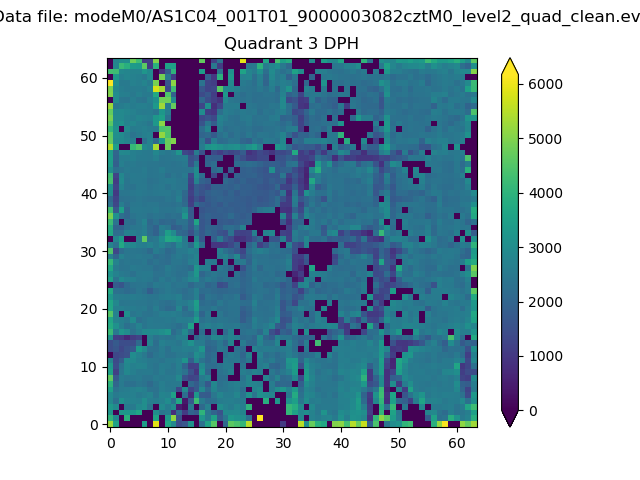 |
 |
Quadrant C |
| Plot type | Count rate plots | Images |
|---|---|---|
| Comparison with Poisson distribution Blue bars denote a histogram of data divided into 1 sec bins. Red curve is a Poisson curve with rate = median count rate of data. |
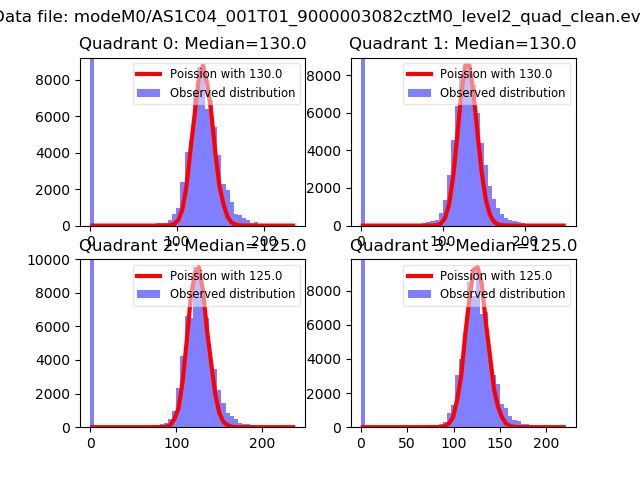 |
 |
| Quadrant-wise count rates Data is divided into 100 sec bins |
 |
|
| Module-wise count rates for Quadrant A Data is divided into 100 sec bins |
 |
 |
| Module-wise count rates for Quadrant B Data is divided into 100 sec bins |
 |
 |
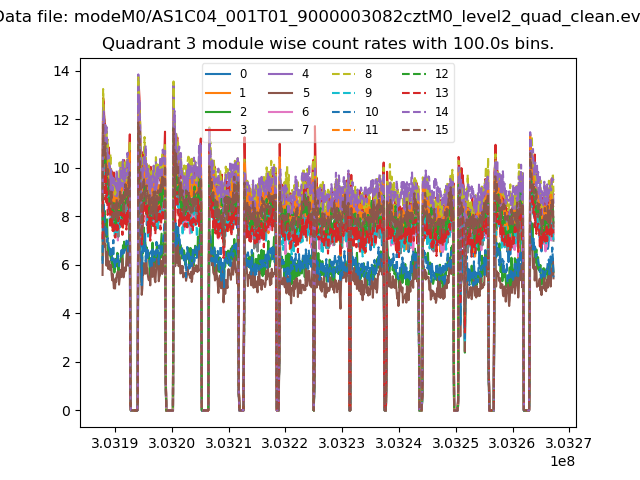
| Module-wise count rates for Quadrant C Data is divided into 100 sec bins |
 |
 |
| Module-wise count rates for Quadrant D Data is divided into 100 sec bins |
 |
 |
| Parameter | Plot |
|---|---|
| CZT HV Monitor | 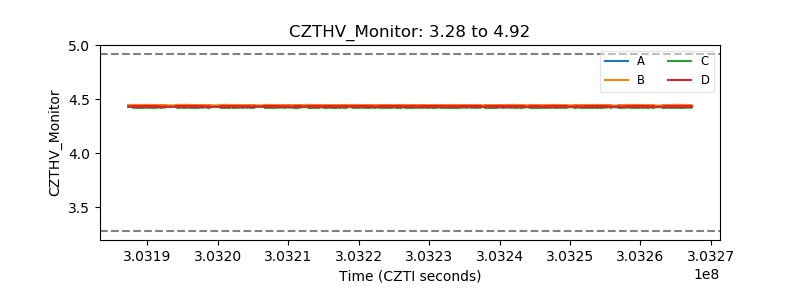 |
| D_VDD |  |
| Temperature 1 |  |
| Veto HV Monitor | 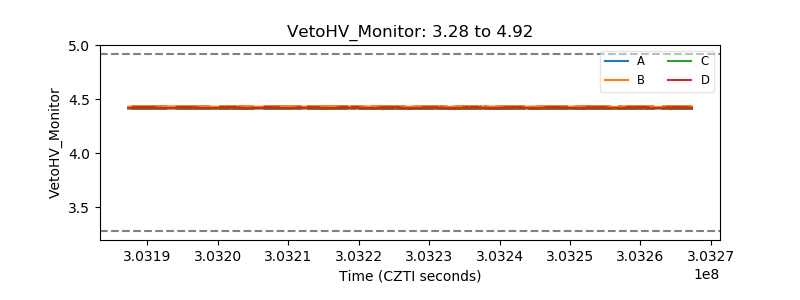 |
| Veto LLD |  |
| Alpha Counter | 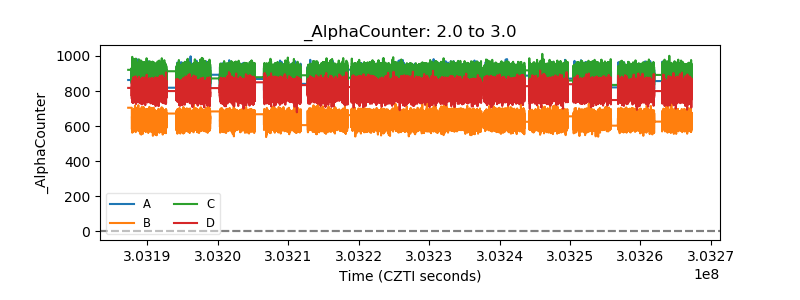 |
| _CPM_Rate |  |
| CZT Counter |  |
| +2.5 Volts monitor |  |
| +5 Volts monitor |  |
| _ROLL_ROT | 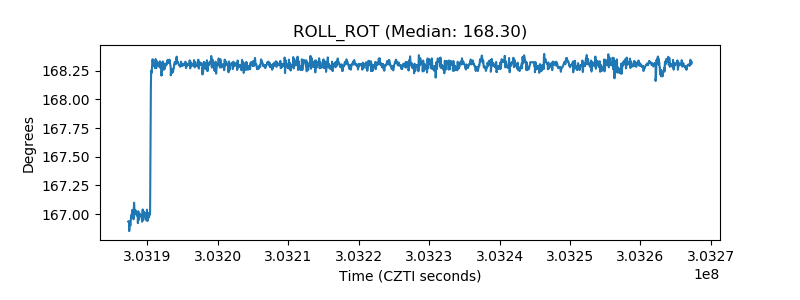 |
| _Roll_DEC |  |
| _Roll_RA |  |
| Veto Counter |  |