| Param | Original file | Final file |
|---|---|---|
| Filename | modeM0/AS1C04_001T01_9000003082_20911cztM0_level2.evt | modeM0/AS1C04_001T01_9000003082_20911cztM0_level2_quad_clean.evt |
| Size (bytes) | 534,752,640 | 149,489,280 |
| Size | 510.0 MB | 142.6 MB |
| Events in quadrant A | 3,815,564 | 1,009,665 |
| Events in quadrant B | 4,022,777 | 1,004,888 |
| Events in quadrant C | 3,637,669 | 993,652 |
| Events in quadrant D | 4,177,013 | 965,049 |
| Mode SS | |||
|---|---|---|---|
| Quadrant | BADHDUFLAG | Total packets | Discarded packets |
| A | 0 | 211 | 51 |
| B | 0 | 207 | 47 |
| C | 0 | 208 | 47 |
| D | 0 | 206 | 36 |
| Mode M9 | |||
|---|---|---|---|
| Quadrant | BADHDUFLAG | Total packets | Discarded packets |
| A | 0 | 20 | 5 |
| B | 0 | 20 | 6 |
| C | 0 | 20 | 5 |
| D | 0 | 20 | 6 |
| Mode M0 | |||
|---|---|---|---|
| Quadrant | BADHDUFLAG | Total packets | Discarded packets |
| A | 0 | 21338 | 4541 |
| B | 0 | 22332 | 4799 |
| C | 0 | 20826 | 4521 |
| D | 0 | 24261 | 6017 |
| Quadrant | Total seconds | Saturated seconds | Saturation percentage |
|---|---|---|---|
| A | 7984 | 35 | 0.438377% |
| B | 7949 | 71 | 0.893194% |
| C | 8017 | 60 | 0.748410% |
| D | 7916 | 167 | 2.109651% |
Noise dominated data is calculated using 1-second bins in cleaned event files. If a bin has >2000 counts, and if more than 50% of those come from <1% of pixels, then it is considered to be noise-dominated and hence unusable.
| Quadrant | # 1 sec bins | Bins with >0 counts | Bins with >2000 counts | High rate bins dominated by noise | Noise dominated (total time) | Noise dominated (detector-on time) | Marked lightcurve |
|---|---|---|---|---|---|---|---|
| A | 12106 | 8410 | 18 | 18 | 0.15% | 0.21% | 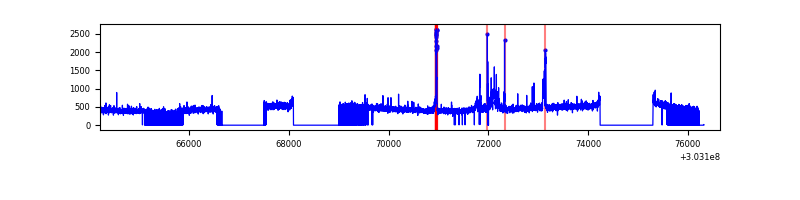 |
| B | 12329 | 8356 | 12 | 12 | 0.10% | 0.14% | 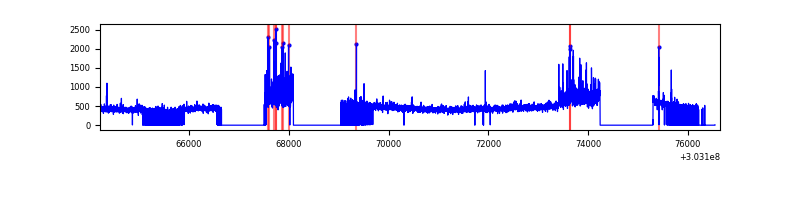 |
| C | 12385 | 8428 | 0 | 0 | 0.00% | 0.00% | 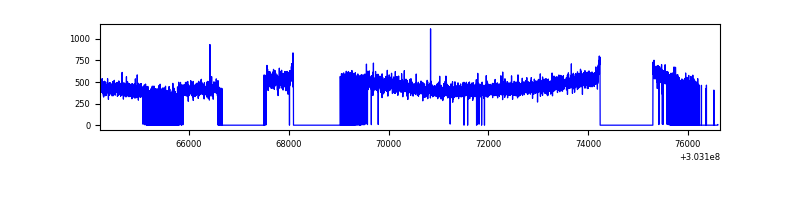 |
| D | 12426 | 8291 | 111 | 111 | 0.89% | 1.34% | 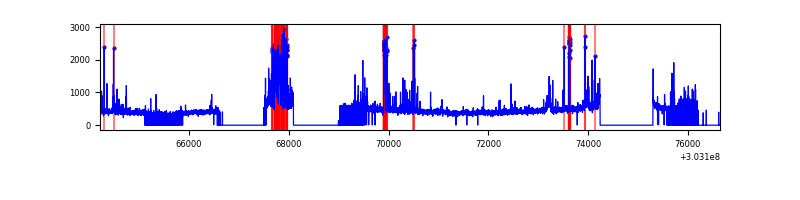 |
Top three noisy pixels from each quadrant. If the there are fewer than three noisy pixels in the level2.evt file, extra rows are filled as -1
| Pixel properties | Quadrant properties | ||||||
|---|---|---|---|---|---|---|---|
| Quadrant | DetID | PixID | Counts | Sigma | Mean | Median | Sigma |
| A | 15 | 174 | 198101 | 1067.92 | 925 | 907 | 184.7 |
| A | 5 | 16 | 32766 | 172.53 | 925 | 907 | 184.7 |
| A | 6 | 16 | 25279 | 131.99 | 925 | 907 | 184.7 |
| B | 7 | 220 | 258292 | 1478.38 | 916 | 895 | 174.1 |
| B | 0 | 219 | 52944 | 298.95 | 916 | 895 | 174.1 |
| B | 0 | 229 | 27117 | 150.61 | 916 | 895 | 174.1 |
| C | 14 | 238 | 141314 | 674.18 | 895 | 898 | 208.3 |
| C | 13 | 61 | 6153 | 25.23 | 895 | 898 | 208.3 |
| C | 10 | 91 | 4674 | 18.13 | 895 | 898 | 208.3 |
| D | 1 | 52 | 633840 | 2953.67 | 889 | 862 | 214.3 |
| D | 1 | 20 | 128007 | 593.3 | 889 | 862 | 214.3 |
| D | 2 | 234 | 35341 | 160.89 | 889 | 862 | 214.3 |
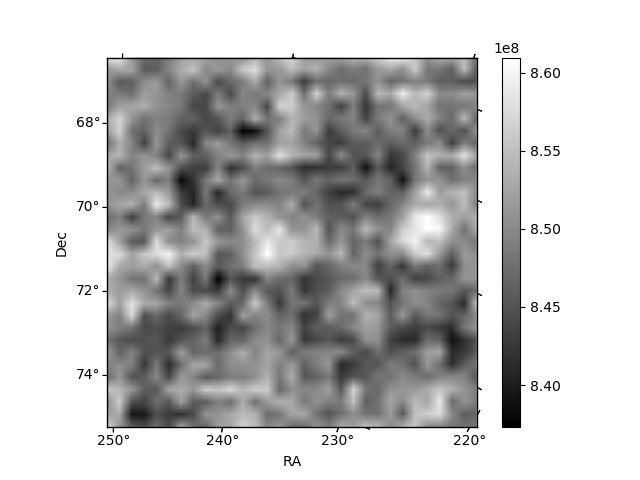
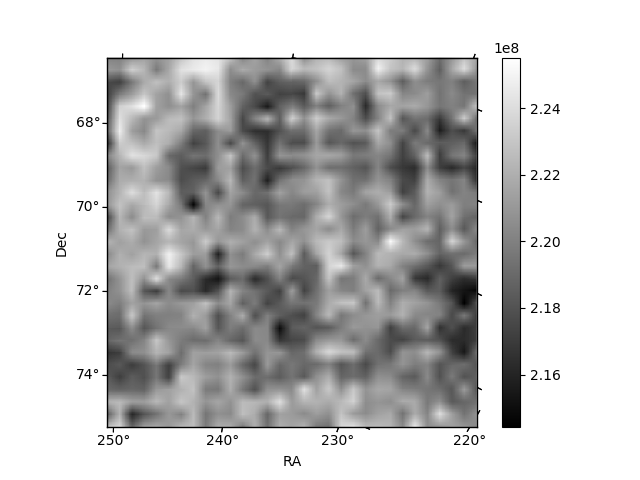
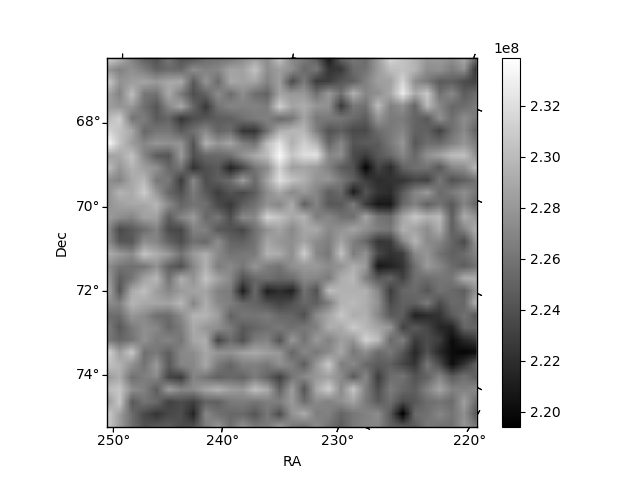
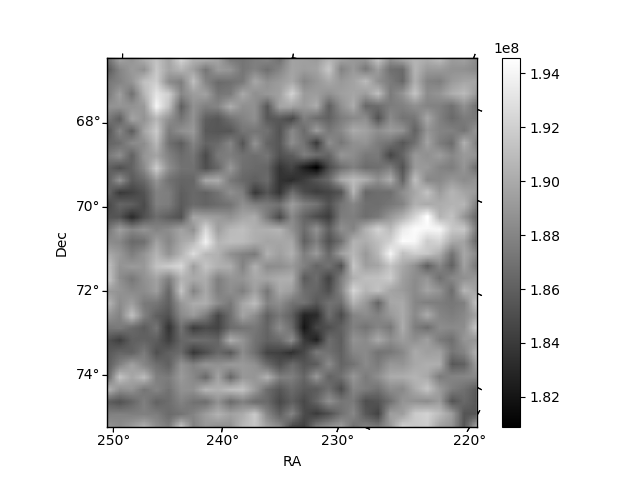
Histogram calculated using DETX and DETY for each event in the final _common_clean file
| Quadrant A | 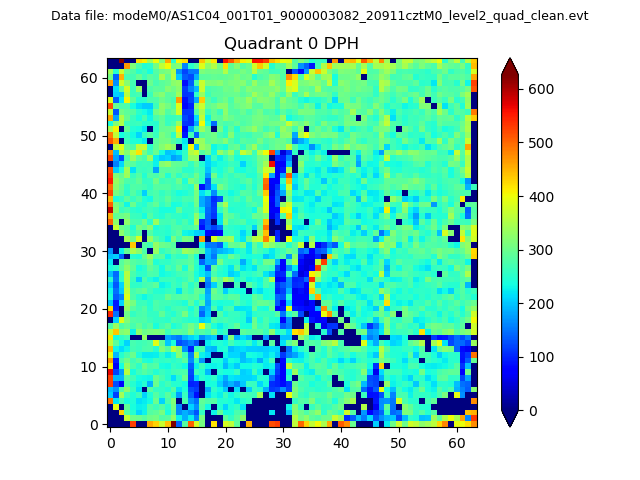 |
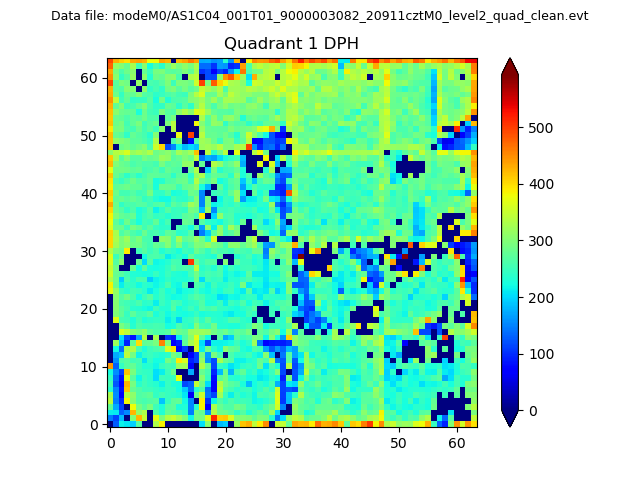 |
Quadrant B |
|---|---|---|---|
| Quadrant D | 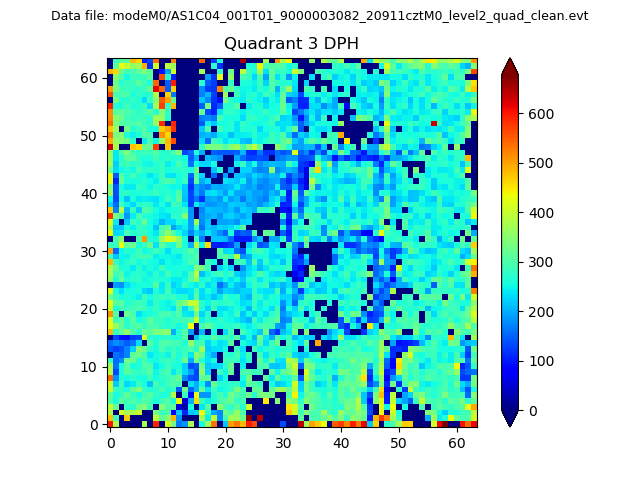 |
 |
Quadrant C |
| Plot type | Count rate plots | Images |
|---|---|---|
| Comparison with Poisson distribution Blue bars denote a histogram of data divided into 1 sec bins. Red curve is a Poisson curve with rate = median count rate of data. |
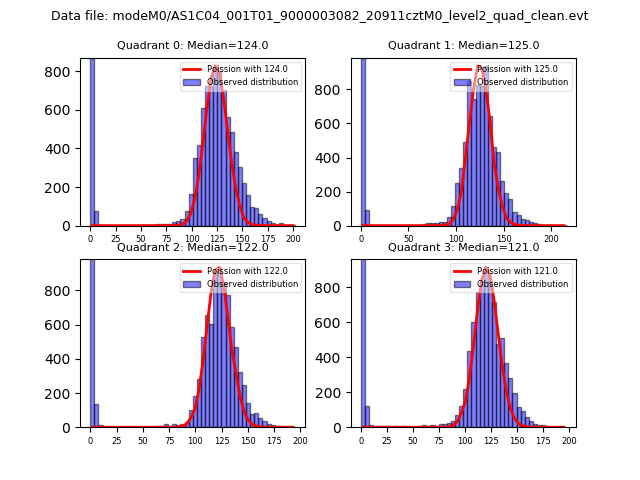 |
 |
| Quadrant-wise count rates Data is divided into 100 sec bins |
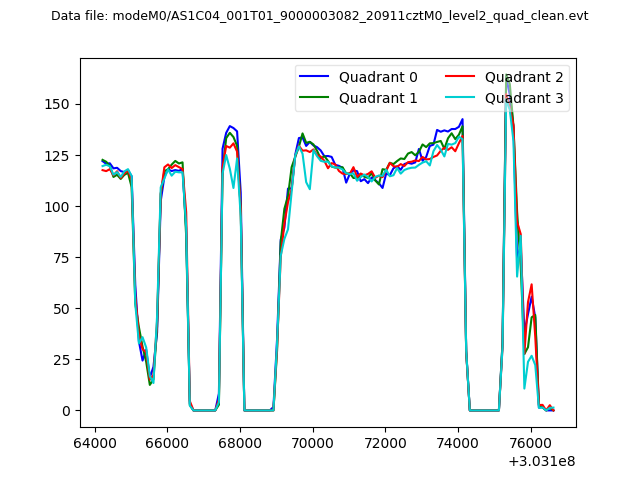 |
|
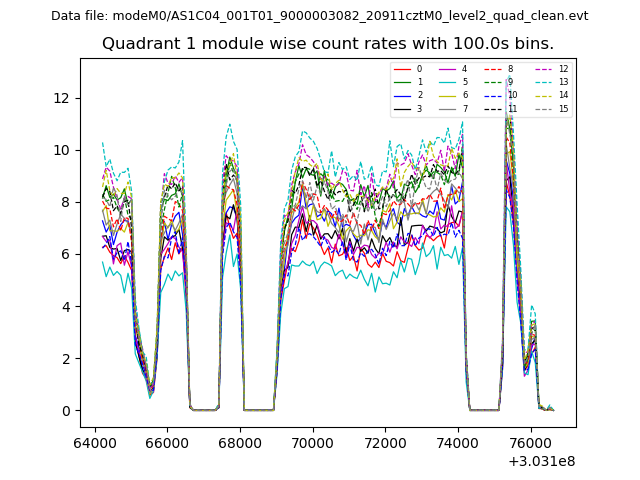
| Module-wise count rates for Quadrant A Data is divided into 100 sec bins |
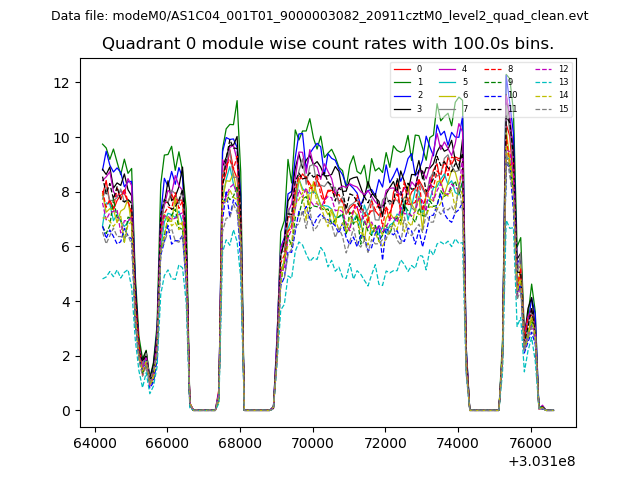 |
 |
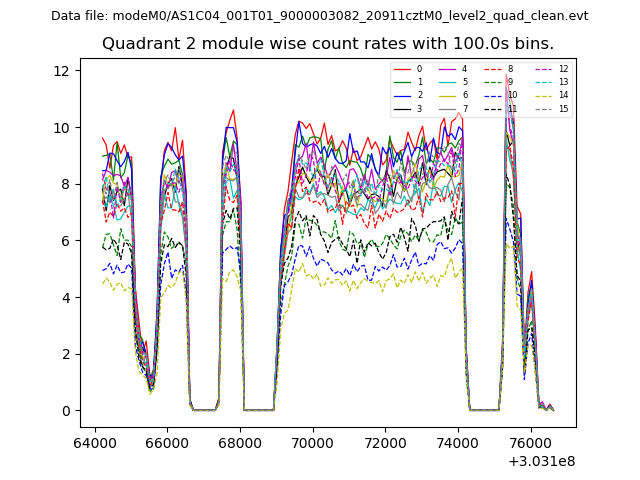
| Module-wise count rates for Quadrant B Data is divided into 100 sec bins |
 |
 |
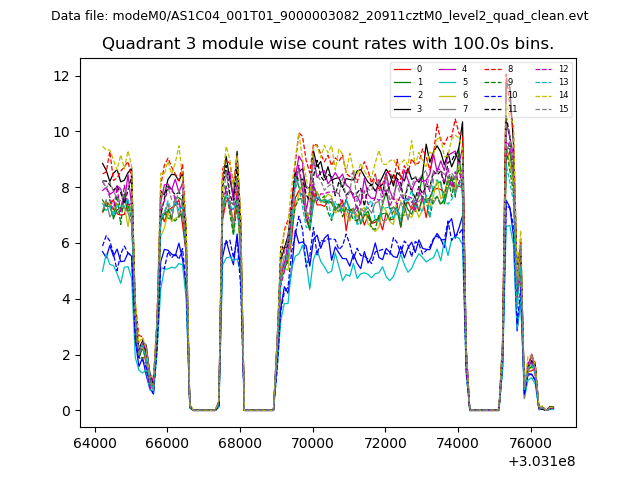
| Module-wise count rates for Quadrant C Data is divided into 100 sec bins |
 |
 |
| Module-wise count rates for Quadrant D Data is divided into 100 sec bins |
 |
 |
| Parameter | Plot |
|---|---|
| CZT HV Monitor | 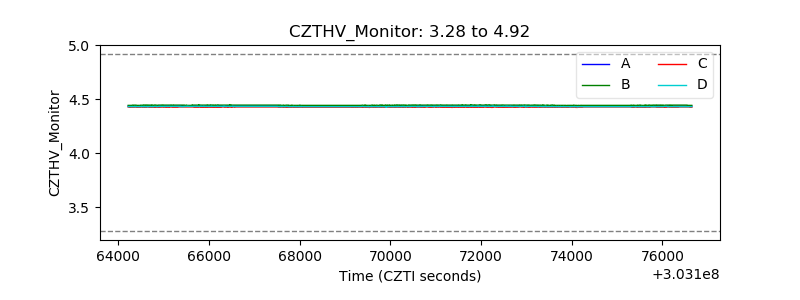 |
| D_VDD | 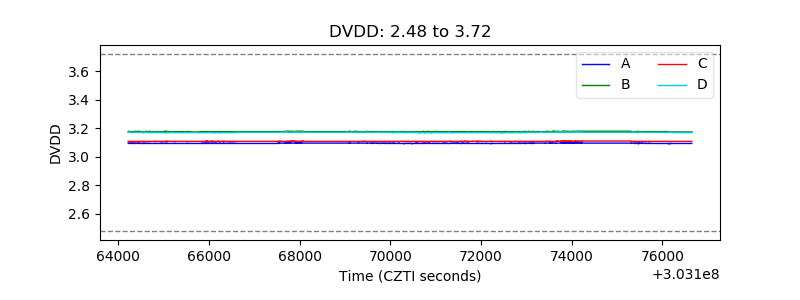 |
| Temperature 1 | 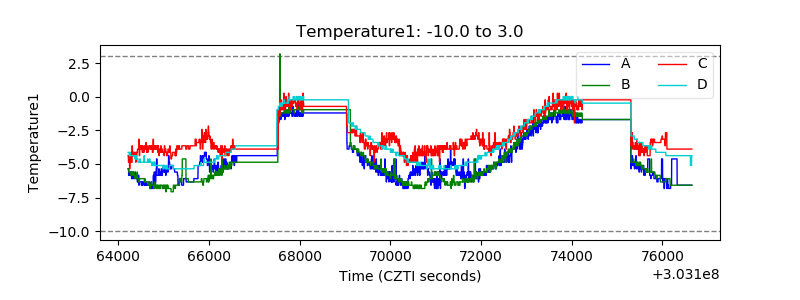 |
| Veto HV Monitor | 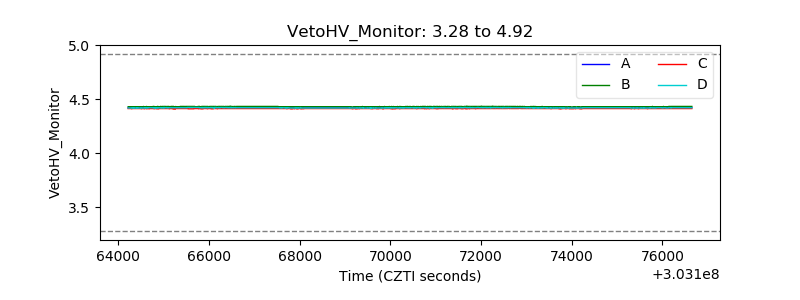 |
| Veto LLD | 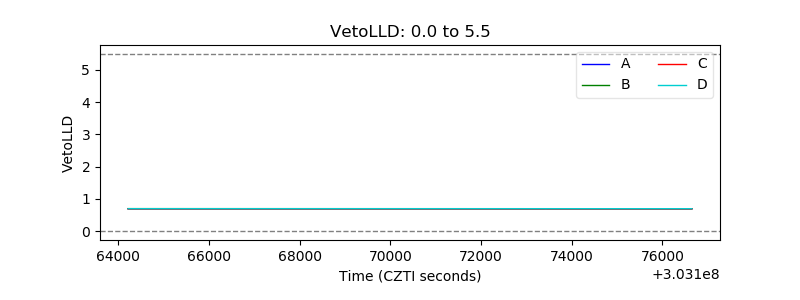 |
| Alpha Counter | 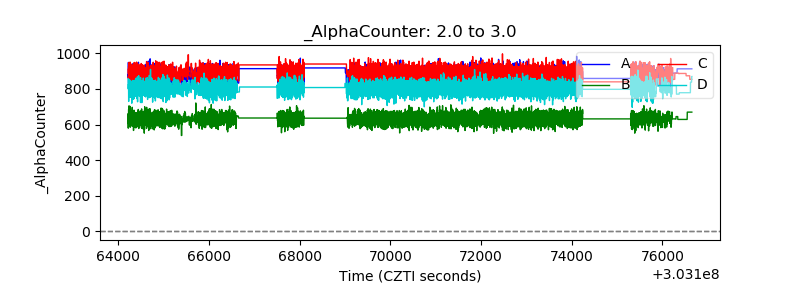 |
| _CPM_Rate | 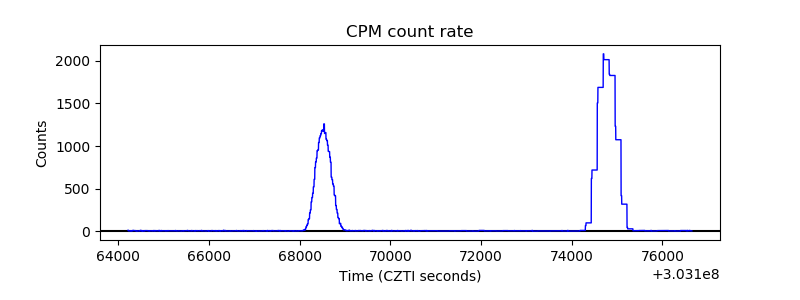 |
| CZT Counter |  |
| +2.5 Volts monitor |  |
| +5 Volts monitor |  |
| _ROLL_ROT | 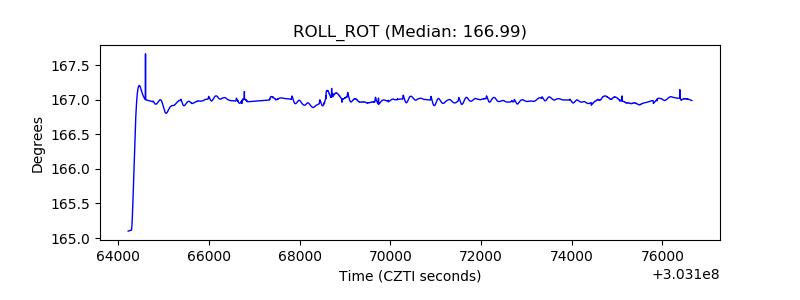 |
| _Roll_DEC | 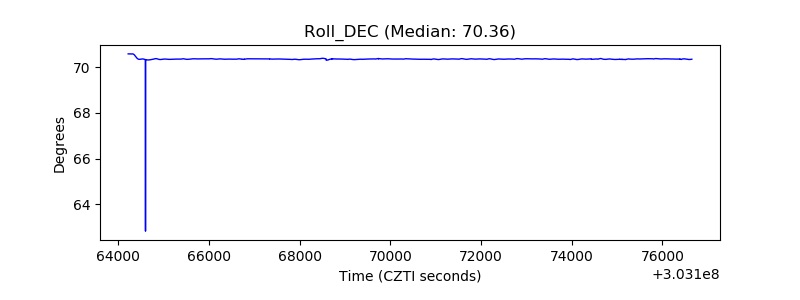 |
| _Roll_RA | 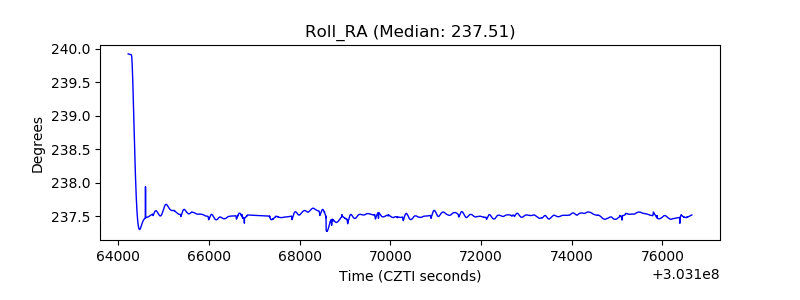 |
| Veto Counter | 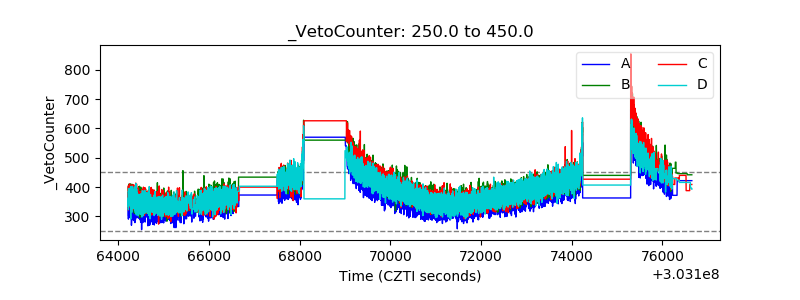 |