| Param | Original file | Final file |
|---|---|---|
| Filename | modeM0/AS1C04_001T01_9000003082_20913cztM0_level2.evt | modeM0/AS1C04_001T01_9000003082_20913cztM0_level2_quad_clean.evt |
| Size (bytes) | 383,725,440 | 113,451,840 |
| Size | 365.9 MB | 108.2 MB |
| Events in quadrant A | 2,681,947 | 770,947 |
| Events in quadrant B | 2,989,319 | 778,824 |
| Events in quadrant C | 2,736,150 | 752,921 |
| Events in quadrant D | 2,821,144 | 730,315 |
| Mode SS | |||
|---|---|---|---|
| Quadrant | BADHDUFLAG | Total packets | Discarded packets |
| A | 0 | 134 | 14 |
| B | 0 | 134 | 16 |
| C | 0 | 133 | 17 |
| D | 0 | 133 | 13 |
| Mode M9 | |||
|---|---|---|---|
| Quadrant | BADHDUFLAG | Total packets | Discarded packets |
| A | 0 | 19 | 3 |
| B | 0 | 19 | 1 |
| C | 0 | 20 | 3 |
| D | 0 | 20 | 4 |
| Mode M0 | |||
|---|---|---|---|
| Quadrant | BADHDUFLAG | Total packets | Discarded packets |
| A | 0 | 13537 | 1686 |
| B | 0 | 14426 | 1748 |
| C | 0 | 13654 | 1679 |
| D | 0 | 14859 | 2584 |
| Quadrant | Total seconds | Saturated seconds | Saturation percentage |
|---|---|---|---|
| A | 5771 | 27 | 0.467857% |
| B | 5774 | 53 | 0.917908% |
| C | 5780 | 49 | 0.847751% |
| D | 5716 | 28 | 0.489853% |
Noise dominated data is calculated using 1-second bins in cleaned event files. If a bin has >2000 counts, and if more than 50% of those come from <1% of pixels, then it is considered to be noise-dominated and hence unusable.
| Quadrant | # 1 sec bins | Bins with >0 counts | Bins with >2000 counts | High rate bins dominated by noise | Noise dominated (total time) | Noise dominated (detector-on time) | Marked lightcurve |
|---|---|---|---|---|---|---|---|
| A | 7748 | 5862 | 0 | 0 | 0.00% | 0.00% | 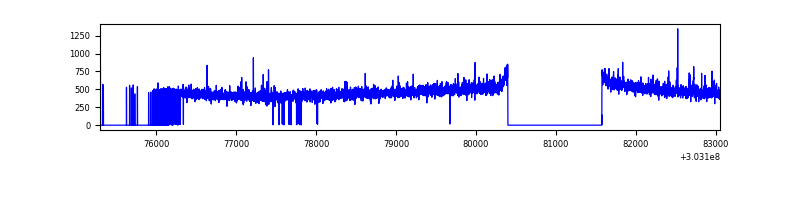 |
| B | 7753 | 5856 | 15 | 15 | 0.19% | 0.26% | 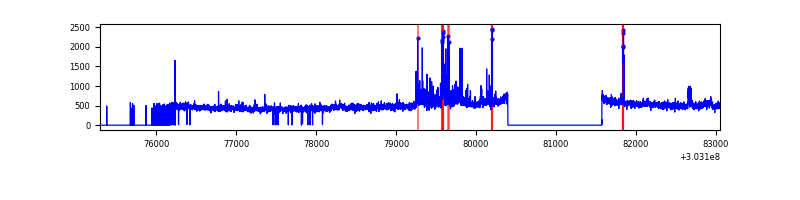 |
| C | 7745 | 5876 | 11 | 11 | 0.14% | 0.19% | 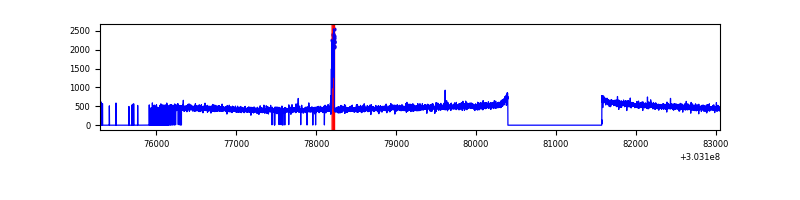 |
| D | 7753 | 5790 | 13 | 13 | 0.17% | 0.22% | 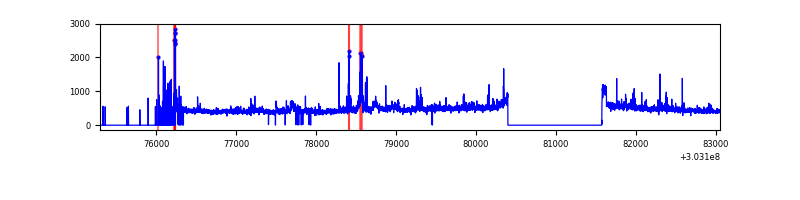 |
Top three noisy pixels from each quadrant. If the there are fewer than three noisy pixels in the level2.evt file, extra rows are filled as -1
| Pixel properties | Quadrant properties | ||||||
|---|---|---|---|---|---|---|---|
| Quadrant | DetID | PixID | Counts | Sigma | Mean | Median | Sigma |
| A | 6 | 16 | 37945 | 270.18 | 687 | 673 | 137.9 |
| A | 0 | 226 | 5998 | 38.6 | 687 | 673 | 137.9 |
| A | 3 | 137 | 5481 | 34.85 | 687 | 673 | 137.9 |
| B | 7 | 220 | 105536 | 818.4 | 685 | 669 | 128.1 |
| B | 0 | 219 | 43949 | 337.77 | 685 | 669 | 128.1 |
| B | 0 | 229 | 35410 | 271.13 | 685 | 669 | 128.1 |
| C | 14 | 238 | 105212 | 679.58 | 660 | 665 | 153.8 |
| C | 9 | 54 | 49503 | 317.46 | 660 | 665 | 153.8 |
| C | 7 | 247 | 5282 | 30.01 | 660 | 665 | 153.8 |
| D | 1 | 20 | 240275 | 1497.44 | 658 | 640 | 160.0 |
| D | 13 | 174 | 43104 | 265.35 | 658 | 640 | 160.0 |
| D | 7 | 38 | 25544 | 155.62 | 658 | 640 | 160.0 |
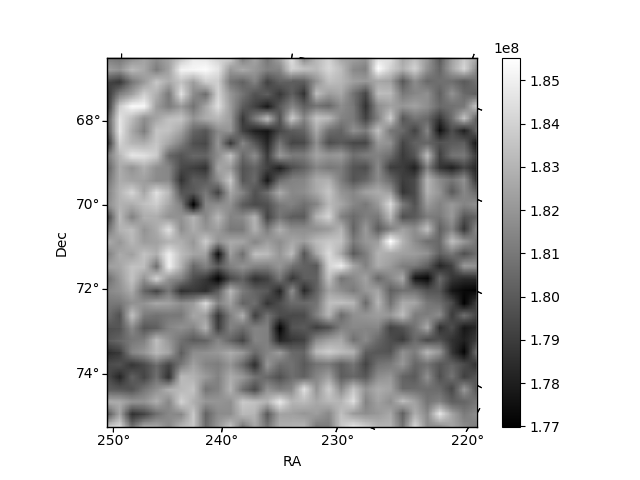
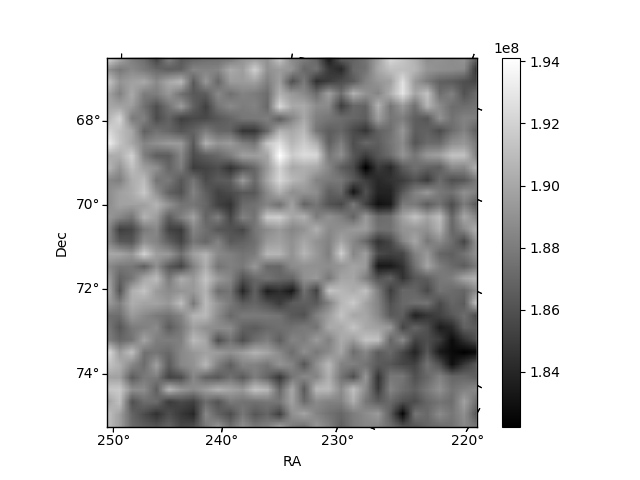
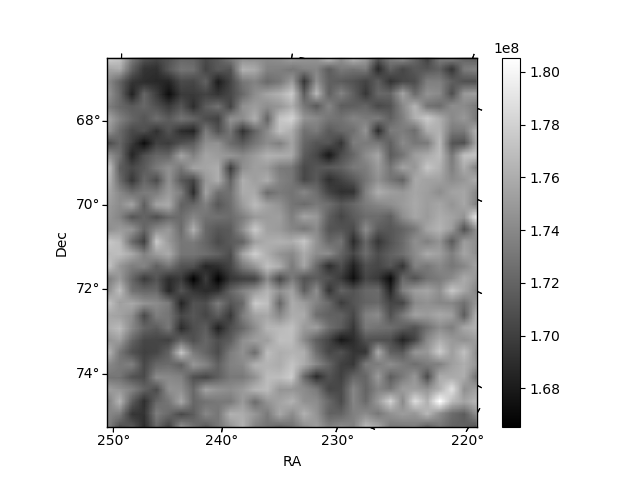
Histogram calculated using DETX and DETY for each event in the final _common_clean file
| Quadrant A | 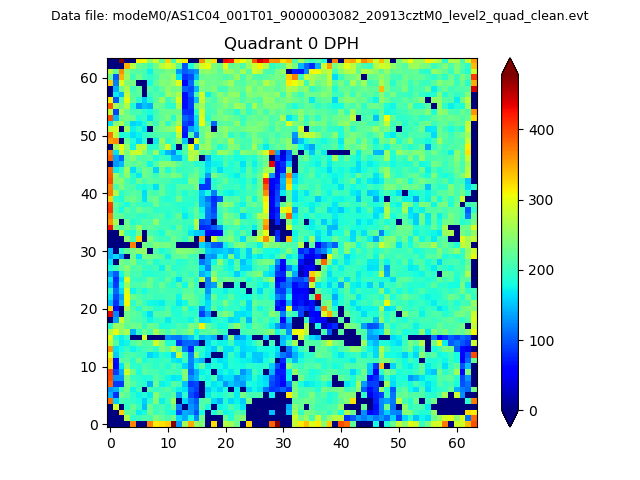 |
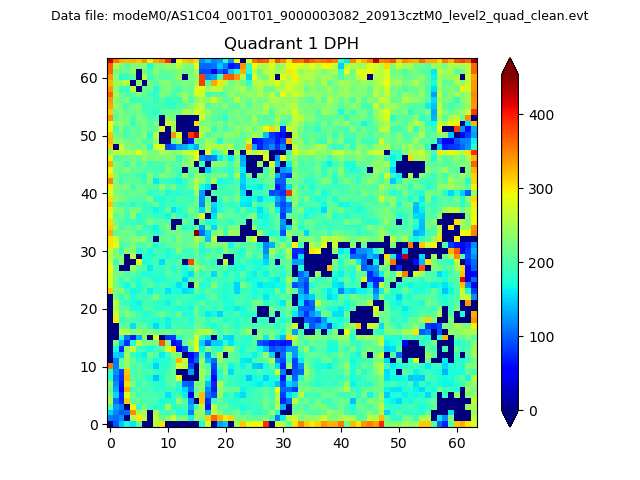 |
Quadrant B |
|---|---|---|---|
| Quadrant D | 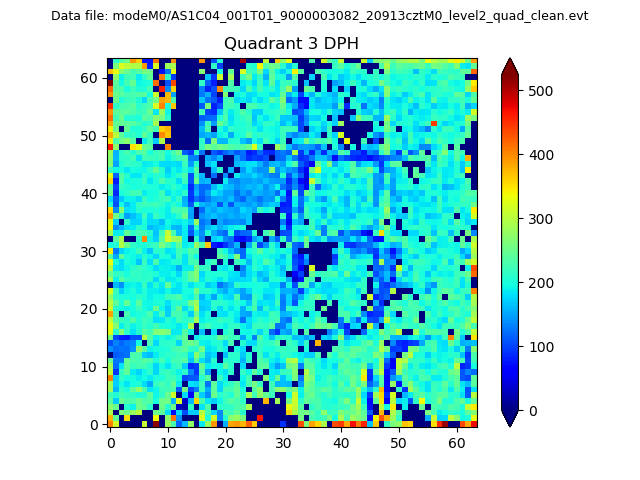 |
 |
Quadrant C |
| Plot type | Count rate plots | Images |
|---|---|---|
| Comparison with Poisson distribution Blue bars denote a histogram of data divided into 1 sec bins. Red curve is a Poisson curve with rate = median count rate of data. |
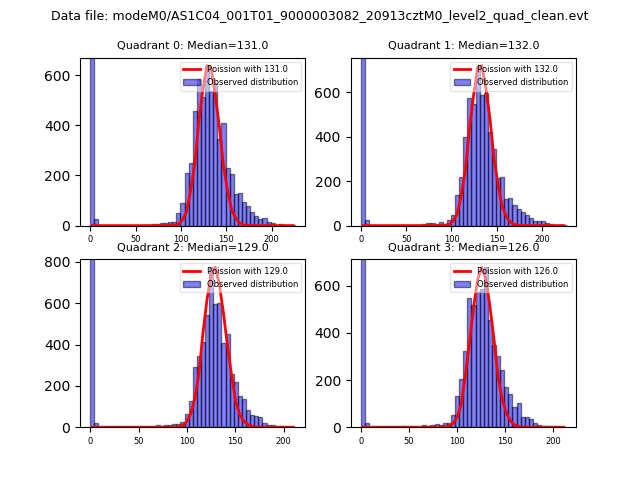 |
 |
| Quadrant-wise count rates Data is divided into 100 sec bins |
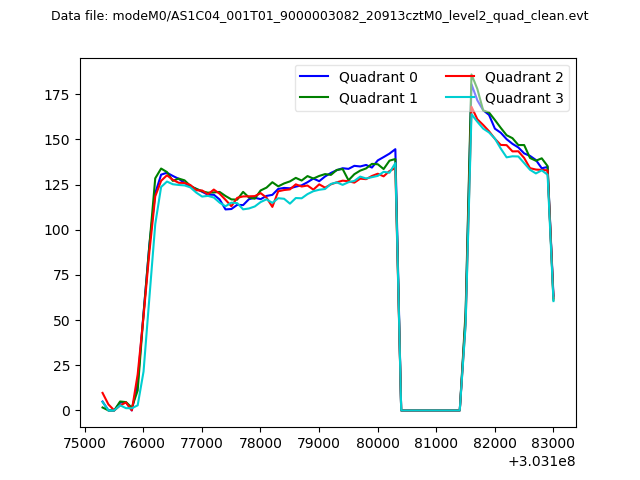 |
|
| Module-wise count rates for Quadrant A Data is divided into 100 sec bins |
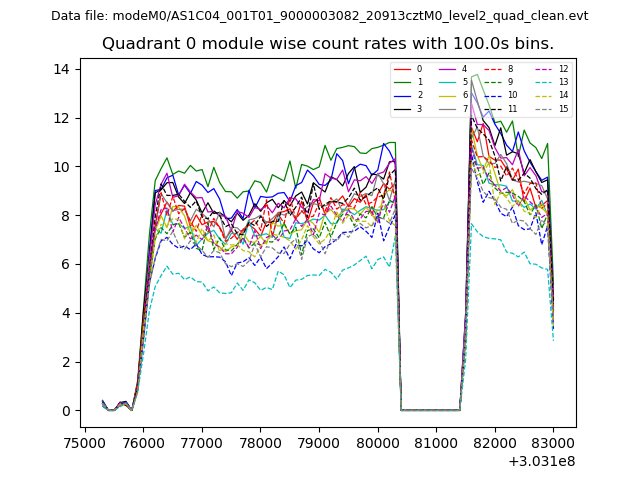 |
 |
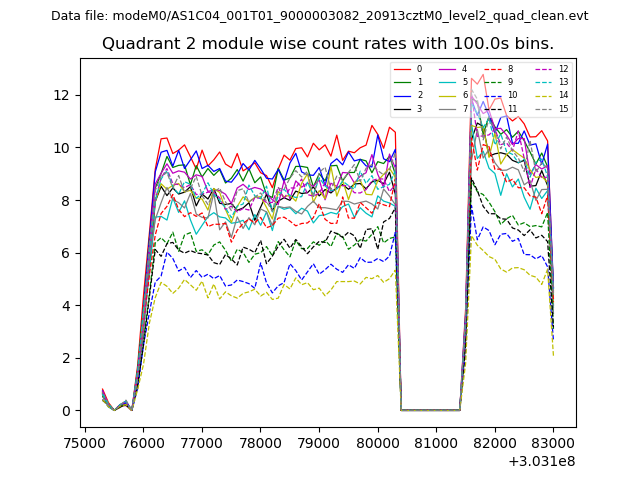
| Module-wise count rates for Quadrant B Data is divided into 100 sec bins |
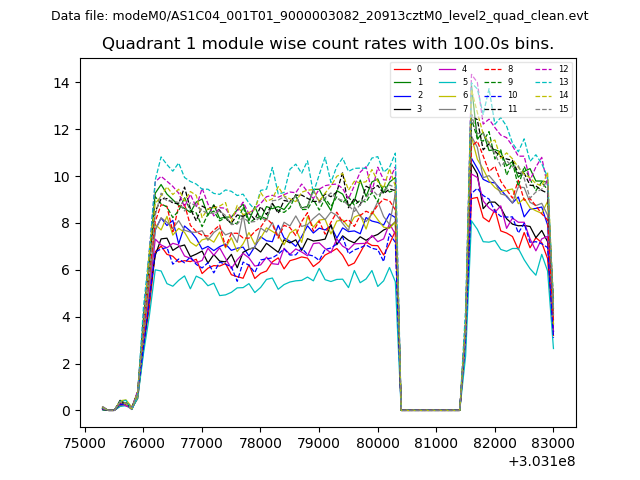 |
 |
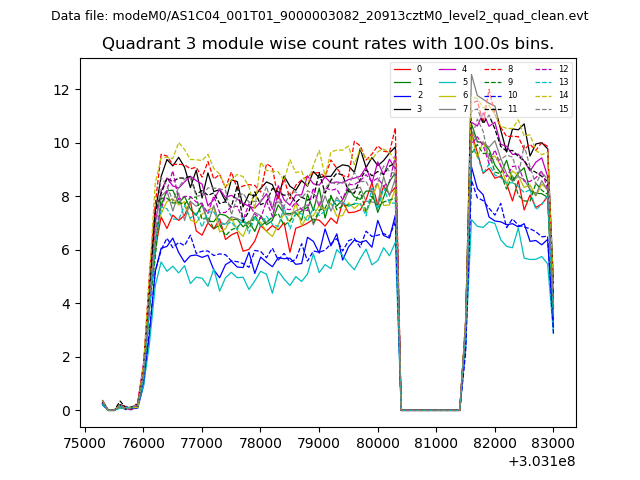
| Module-wise count rates for Quadrant C Data is divided into 100 sec bins |
 |
 |
| Module-wise count rates for Quadrant D Data is divided into 100 sec bins |
 |
 |
| Parameter | Plot |
|---|---|
| CZT HV Monitor |  |
| D_VDD | 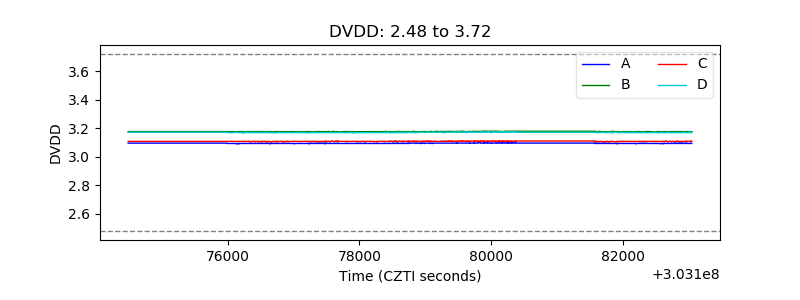 |
| Temperature 1 |  |
| Veto HV Monitor | 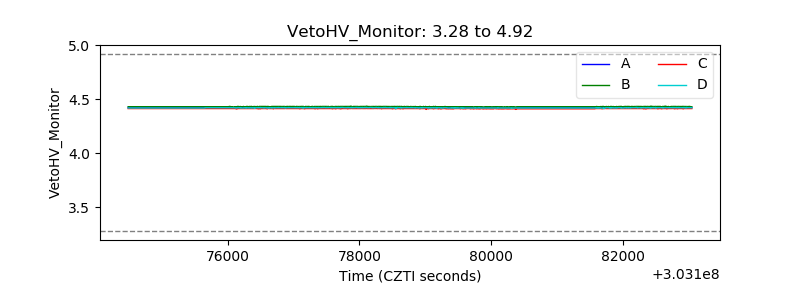 |
| Veto LLD | 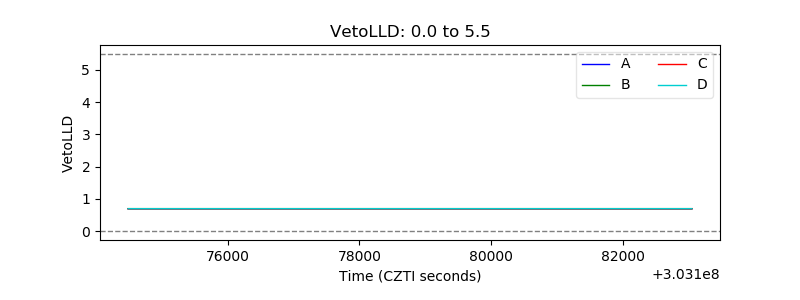 |
| Alpha Counter |  |
| _CPM_Rate |  |
| CZT Counter |  |
| +2.5 Volts monitor |  |
| +5 Volts monitor |  |
| _ROLL_ROT | 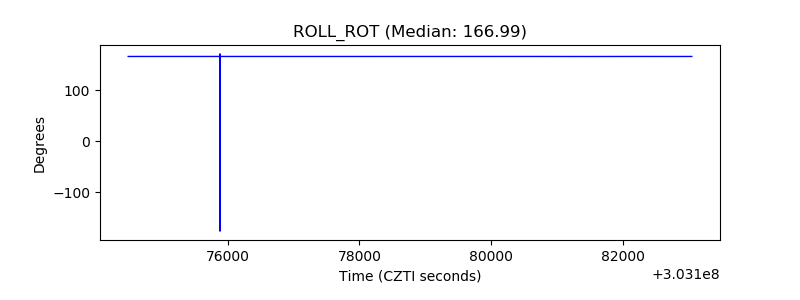 |
| _Roll_DEC | 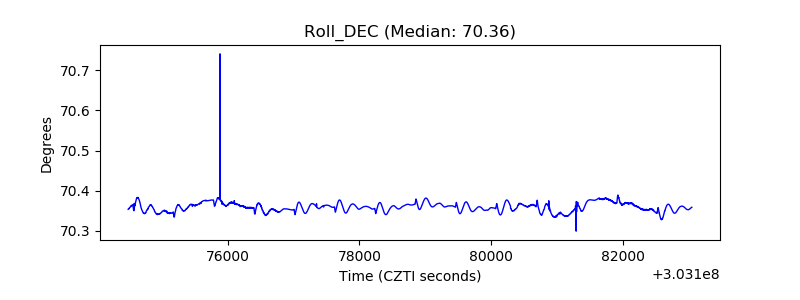 |
| _Roll_RA | 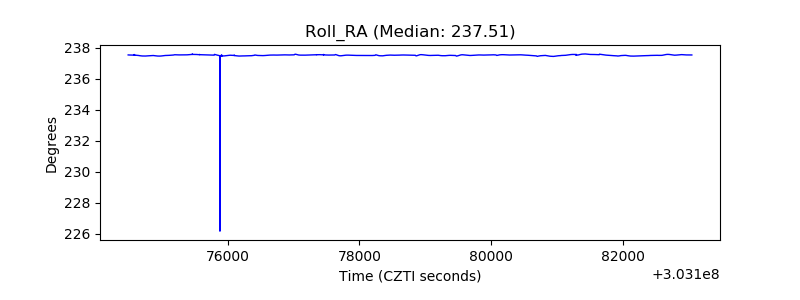 |
| Veto Counter | 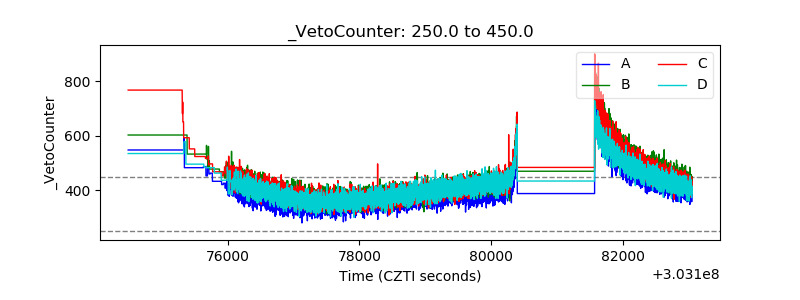 |