| Param | Original file | Final file |
|---|---|---|
| Filename | modeM0/AS1C04_001T01_9000003082_20914cztM0_level2.evt | modeM0/AS1C04_001T01_9000003082_20914cztM0_level2_quad_clean.evt |
| Size (bytes) | 1,268,458,560 | 367,680,960 |
| Size | 1.2 GB | 350.6 MB |
| Events in quadrant A | 9,015,669 | 2,498,997 |
| Events in quadrant B | 9,630,864 | 2,502,969 |
| Events in quadrant C | 8,765,987 | 2,436,198 |
| Events in quadrant D | 9,720,472 | 2,393,657 |
| Mode SS | |||
|---|---|---|---|
| Quadrant | BADHDUFLAG | Total packets | Discarded packets |
| A | 0 | 418 | 34 |
| B | 0 | 414 | 19 |
| C | 0 | 414 | 28 |
| D | 0 | 416 | 30 |
| Mode M9 | |||
|---|---|---|---|
| Quadrant | BADHDUFLAG | Total packets | Discarded packets |
| A | 0 | 44 | 8 |
| B | 0 | 44 | 7 |
| C | 0 | 43 | 5 |
| D | 0 | 44 | 7 |
| Mode M0 | |||
|---|---|---|---|
| Quadrant | BADHDUFLAG | Total packets | Discarded packets |
| A | 0 | 42349 | 2701 |
| B | 0 | 44880 | 3526 |
| C | 0 | 41729 | 2776 |
| D | 0 | 45678 | 3230 |
| Quadrant | Total seconds | Saturated seconds | Saturation percentage |
|---|---|---|---|
| A | 18994 | 98 | 0.515952% |
| B | 18890 | 188 | 0.995236% |
| C | 18973 | 151 | 0.795868% |
| D | 18931 | 285 | 1.505467% |
Noise dominated data is calculated using 1-second bins in cleaned event files. If a bin has >2000 counts, and if more than 50% of those come from <1% of pixels, then it is considered to be noise-dominated and hence unusable.
| Quadrant | # 1 sec bins | Bins with >0 counts | Bins with >2000 counts | High rate bins dominated by noise | Noise dominated (total time) | Noise dominated (detector-on time) | Marked lightcurve |
|---|---|---|---|---|---|---|---|
| A | 25143 | 19276 | 24 | 24 | 0.10% | 0.12% | 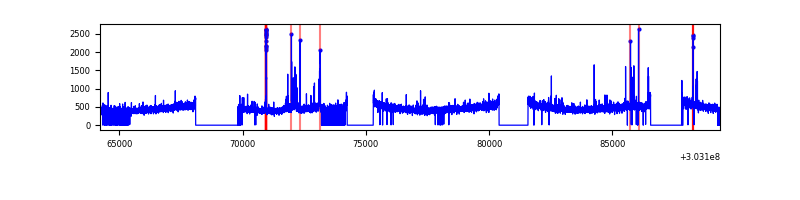 |
| B | 25144 | 19165 | 37 | 37 | 0.15% | 0.19% | 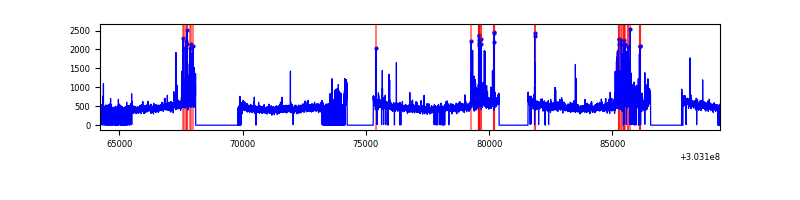 |
| C | 25143 | 19280 | 10 | 10 | 0.04% | 0.05% | 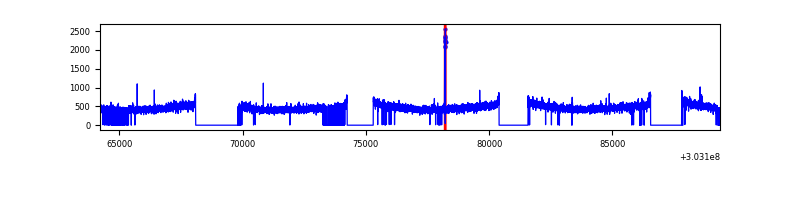 |
| D | 25143 | 19221 | 181 | 181 | 0.72% | 0.94% | 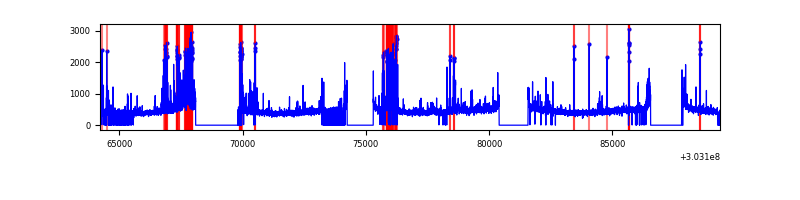 |
Top three noisy pixels from each quadrant. If the there are fewer than three noisy pixels in the level2.evt file, extra rows are filled as -1
| Pixel properties | Quadrant properties | ||||||
|---|---|---|---|---|---|---|---|
| Quadrant | DetID | PixID | Counts | Sigma | Mean | Median | Sigma |
| A | 15 | 174 | 208244 | 462.25 | 2247 | 2204 | 445.7 |
| A | 6 | 16 | 86183 | 188.41 | 2247 | 2204 | 445.7 |
| A | 5 | 16 | 75356 | 164.12 | 2247 | 2204 | 445.7 |
| B | 7 | 220 | 465075 | 1125.96 | 2222 | 2170 | 411.1 |
| B | 0 | 219 | 167307 | 401.68 | 2222 | 2170 | 411.1 |
| B | 0 | 229 | 57516 | 134.62 | 2222 | 2170 | 411.1 |
| C | 14 | 238 | 342912 | 690.9 | 2145 | 2156 | 493.2 |
| C | 9 | 54 | 49247 | 95.48 | 2145 | 2156 | 493.2 |
| C | 13 | 61 | 15021 | 26.08 | 2145 | 2156 | 493.2 |
| D | 1 | 52 | 768752 | 1492.03 | 2158 | 2098 | 513.8 |
| D | 1 | 20 | 329808 | 637.78 | 2158 | 2098 | 513.8 |
| D | 13 | 174 | 323661 | 625.81 | 2158 | 2098 | 513.8 |
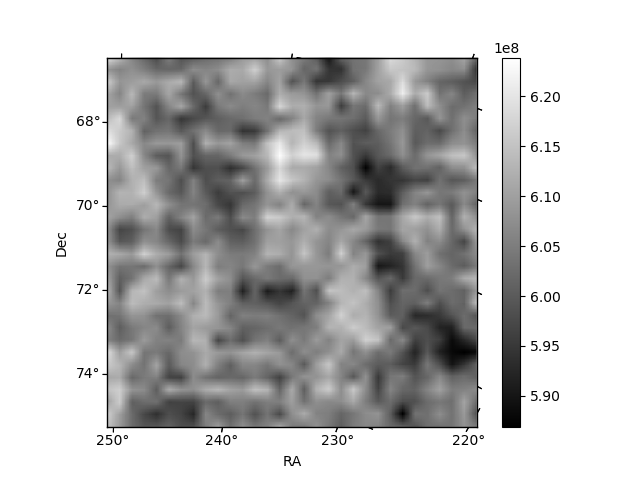
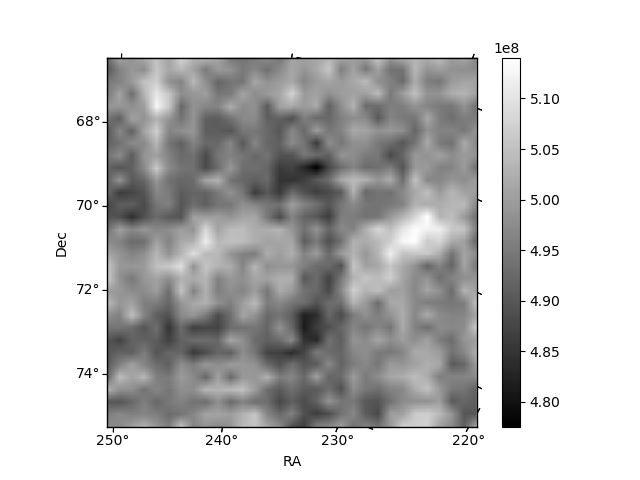
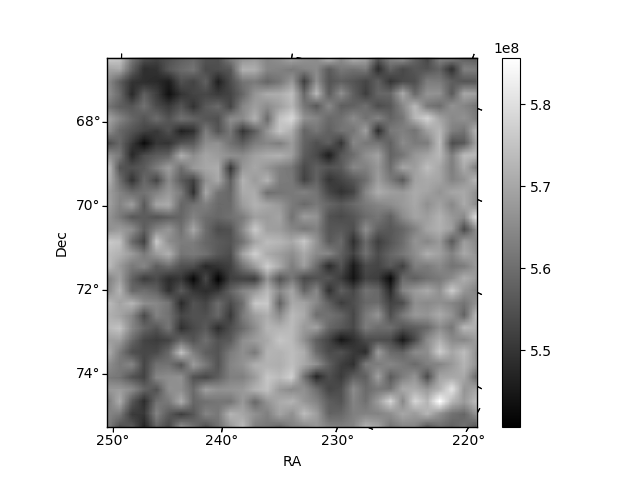
Histogram calculated using DETX and DETY for each event in the final _common_clean file
| Quadrant A | 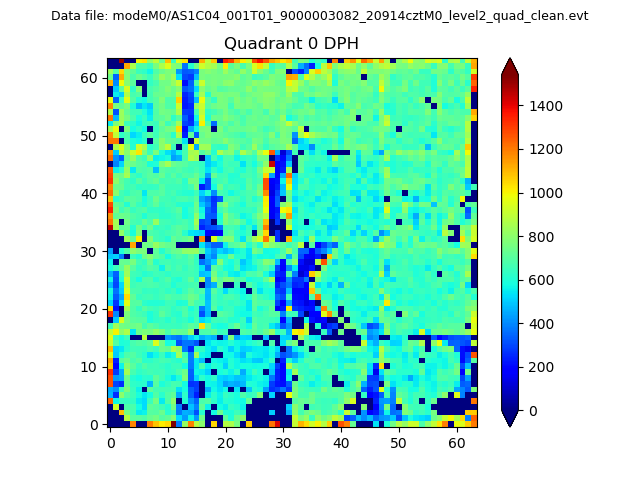 |
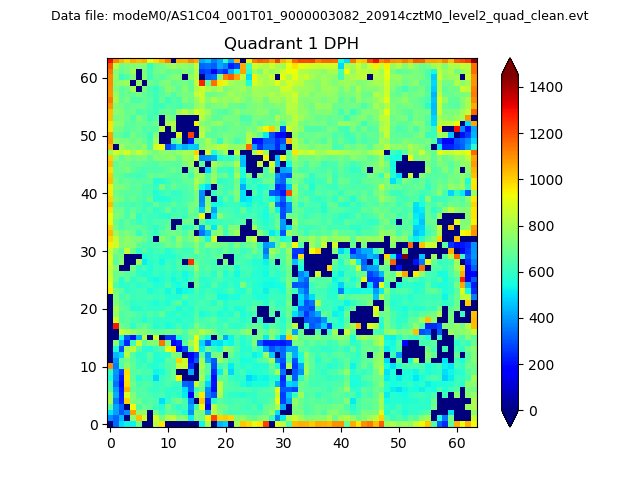 |
Quadrant B |
|---|---|---|---|
| Quadrant D | 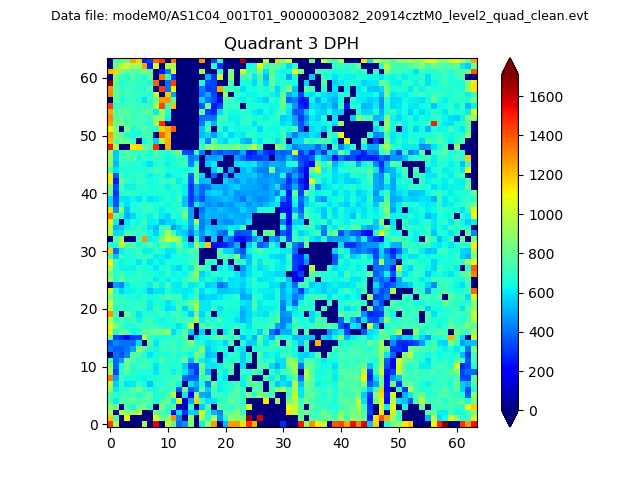 |
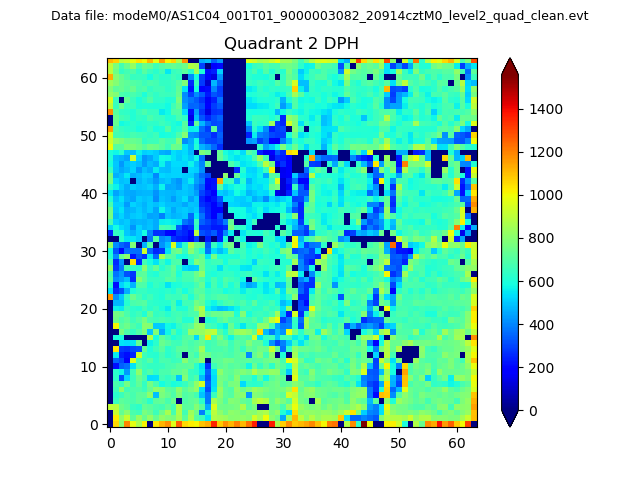 |
Quadrant C |
| Plot type | Count rate plots | Images |
|---|---|---|
| Comparison with Poisson distribution Blue bars denote a histogram of data divided into 1 sec bins. Red curve is a Poisson curve with rate = median count rate of data. |
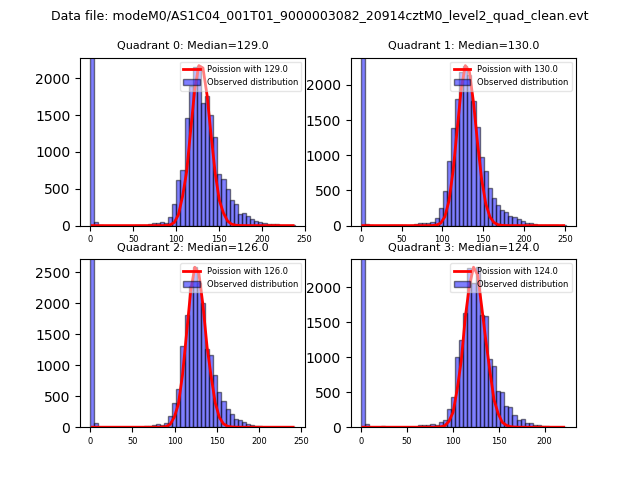 |
 |
| Quadrant-wise count rates Data is divided into 100 sec bins |
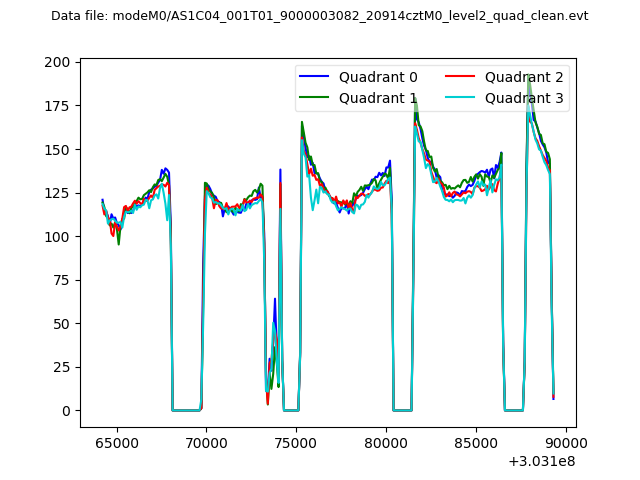 |
|
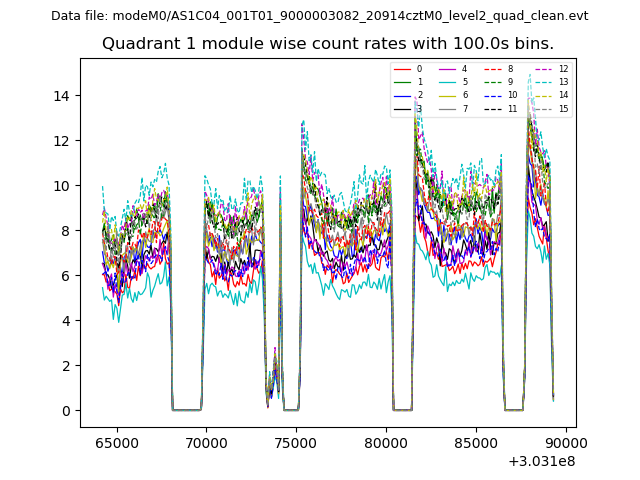
| Module-wise count rates for Quadrant A Data is divided into 100 sec bins |
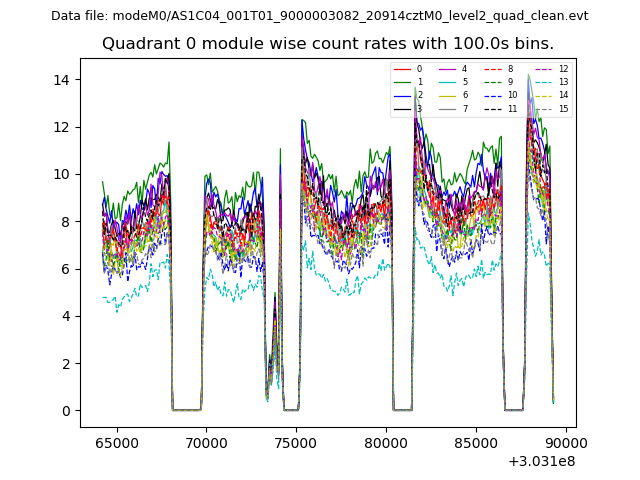 |
 |
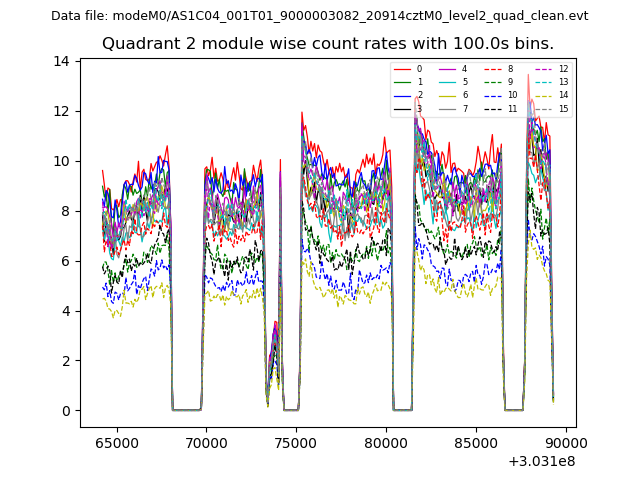
| Module-wise count rates for Quadrant B Data is divided into 100 sec bins |
 |
 |
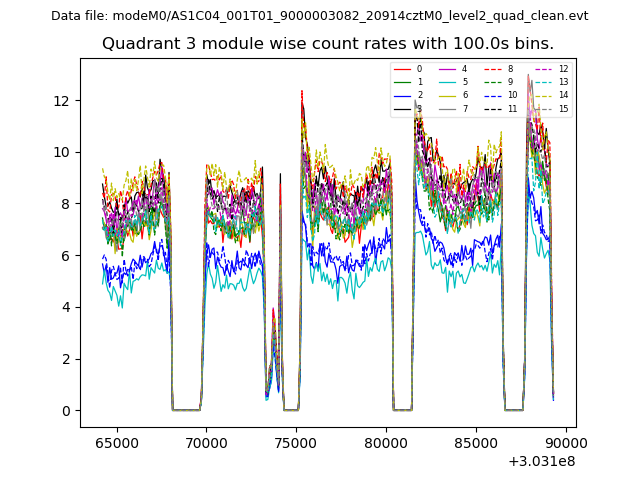
| Module-wise count rates for Quadrant C Data is divided into 100 sec bins |
 |
 |
| Module-wise count rates for Quadrant D Data is divided into 100 sec bins |
 |
 |
| Parameter | Plot |
|---|---|
| CZT HV Monitor | 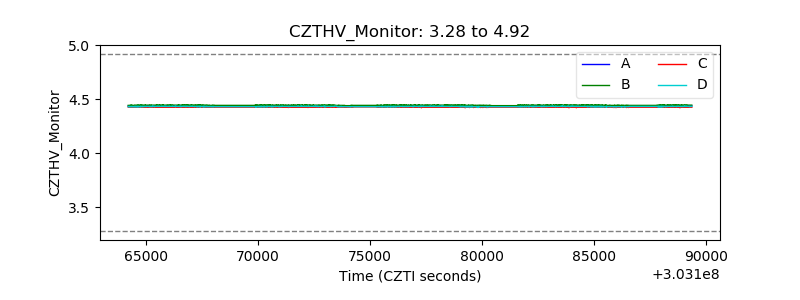 |
| D_VDD |  |
| Temperature 1 | 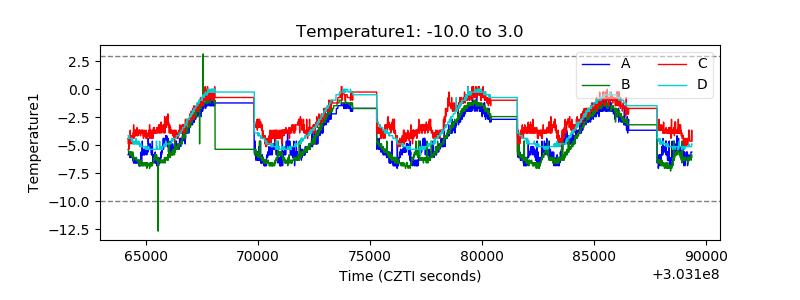 |
| Veto HV Monitor | 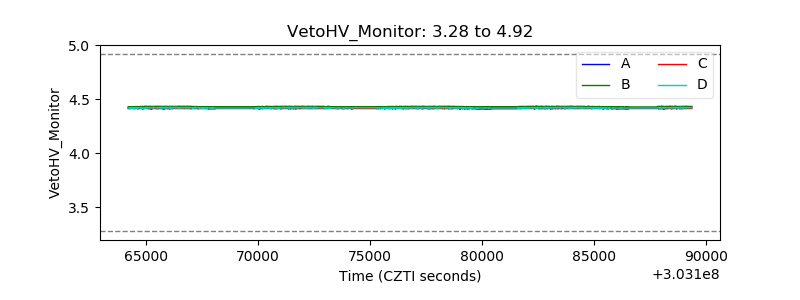 |
| Veto LLD | 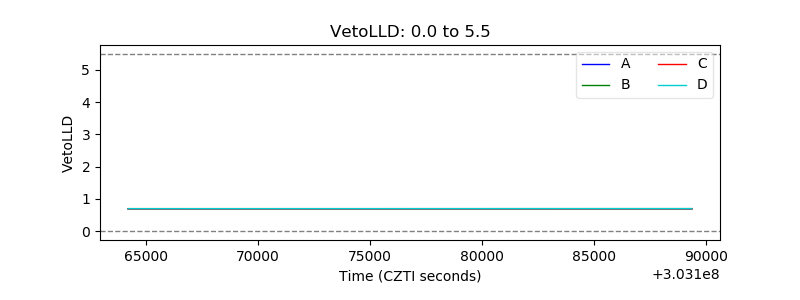 |
| Alpha Counter | 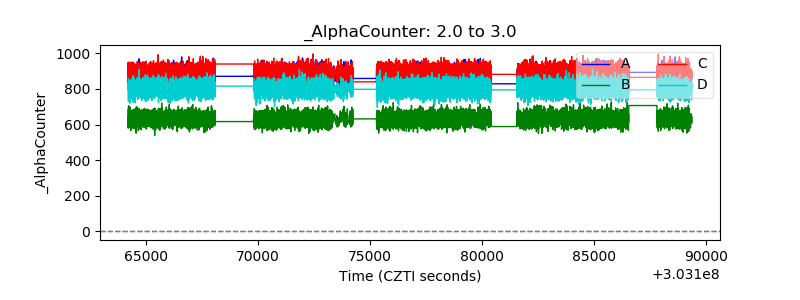 |
| _CPM_Rate | 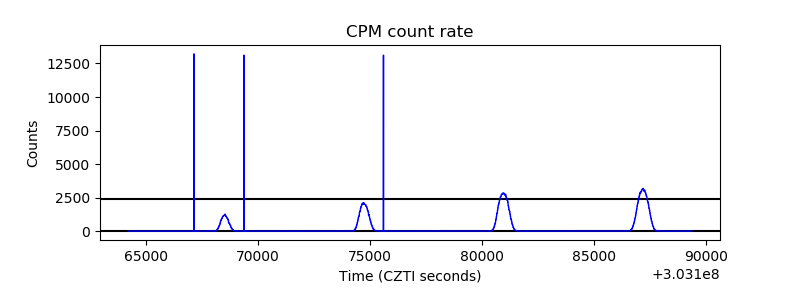 |
| CZT Counter | 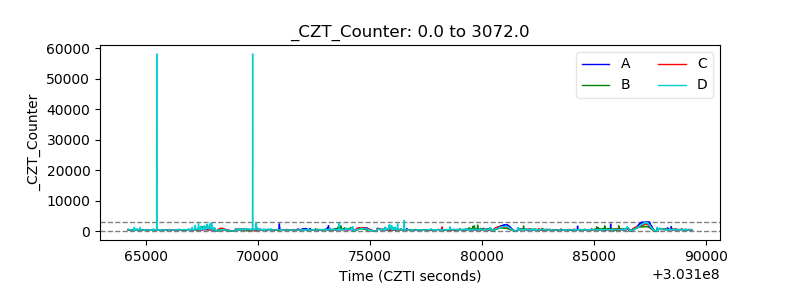 |
| +2.5 Volts monitor |  |
| +5 Volts monitor |  |
| _ROLL_ROT | 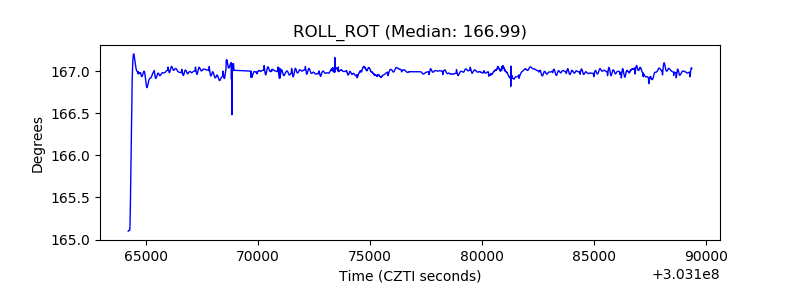 |
| _Roll_DEC | 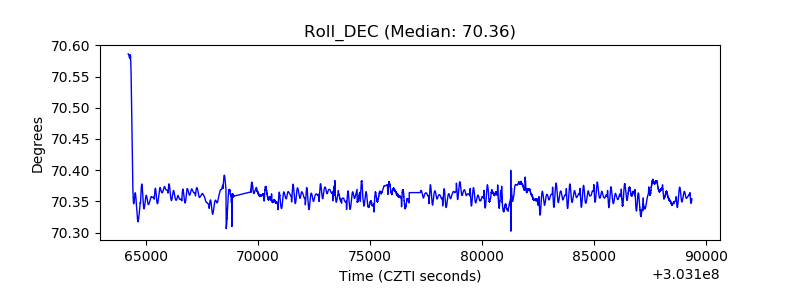 |
| _Roll_RA |  |
| Veto Counter | 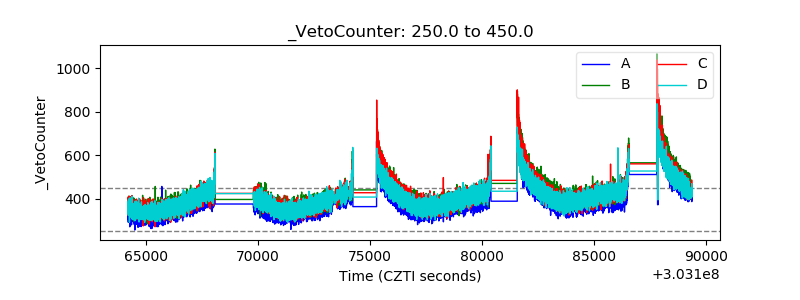 |