| Param | Original file | Final file |
|---|---|---|
| Filename | modeM0/AS1C04_001T01_9000003082_20915cztM0_level2.evt | modeM0/AS1C04_001T01_9000003082_20915cztM0_level2_quad_clean.evt |
| Size (bytes) | 440,789,760 | 133,076,160 |
| Size | 420.4 MB | 126.9 MB |
| Events in quadrant A | 3,354,397 | 919,452 |
| Events in quadrant B | 3,479,960 | 929,593 |
| Events in quadrant C | 3,061,114 | 876,568 |
| Events in quadrant D | 3,034,870 | 874,750 |
| Mode SS | |||
|---|---|---|---|
| Quadrant | BADHDUFLAG | Total packets | Discarded packets |
| A | 0 | 126 | 2 |
| B | 0 | 126 | 2 |
| C | 0 | 126 | 0 |
| D | 0 | 126 | 0 |
| Mode M9 | |||
|---|---|---|---|
| Quadrant | BADHDUFLAG | Total packets | Discarded packets |
| A | 0 | 19 | 0 |
| B | 0 | 19 | 0 |
| C | 0 | 20 | 0 |
| D | 0 | 20 | 0 |
| Mode M0 | |||
|---|---|---|---|
| Quadrant | BADHDUFLAG | Total packets | Discarded packets |
| A | 0 | 14115 | 240 |
| B | 0 | 14348 | 185 |
| C | 0 | 13100 | 172 |
| D | 0 | 13236 | 160 |
| Quadrant | Total seconds | Saturated seconds | Saturation percentage |
|---|---|---|---|
| A | 6153 | 72 | 1.170161% |
| B | 6163 | 113 | 1.833523% |
| C | 6167 | 62 | 1.005351% |
| D | 6170 | 30 | 0.486224% |
Noise dominated data is calculated using 1-second bins in cleaned event files. If a bin has >2000 counts, and if more than 50% of those come from <1% of pixels, then it is considered to be noise-dominated and hence unusable.
| Quadrant | # 1 sec bins | Bins with >0 counts | Bins with >2000 counts | High rate bins dominated by noise | Noise dominated (total time) | Noise dominated (detector-on time) | Marked lightcurve |
|---|---|---|---|---|---|---|---|
| A | 7670 | 6234 | 21 | 21 | 0.27% | 0.34% | 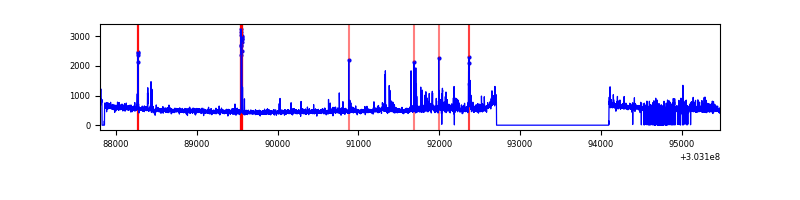 |
| B | 7669 | 6234 | 48 | 48 | 0.63% | 0.77% | 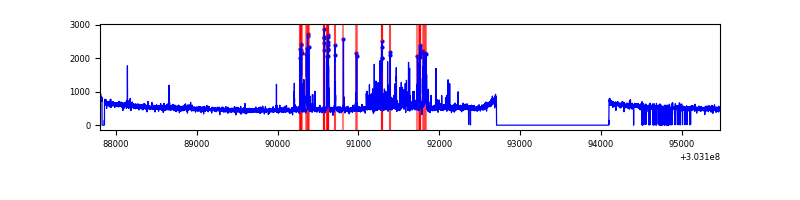 |
| C | 7669 | 6239 | 0 | 0 | 0.00% | 0.00% | 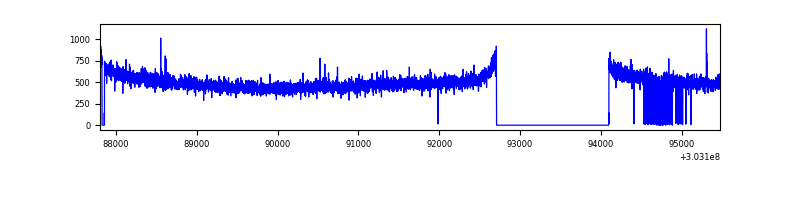 |
| D | 7669 | 6232 | 8 | 8 | 0.10% | 0.13% | 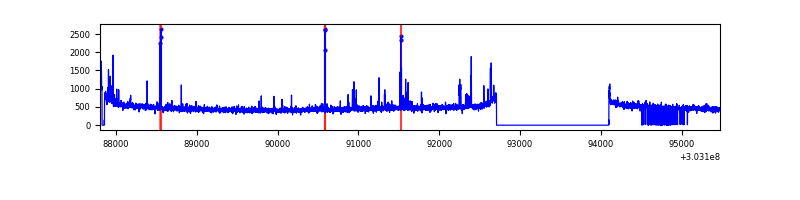 |
Top three noisy pixels from each quadrant. If the there are fewer than three noisy pixels in the level2.evt file, extra rows are filled as -1
| Pixel properties | Quadrant properties | ||||||
|---|---|---|---|---|---|---|---|
| Quadrant | DetID | PixID | Counts | Sigma | Mean | Median | Sigma |
| A | 6 | 16 | 171505 | 1074.25 | 795 | 781 | 158.9 |
| A | 5 | 16 | 116176 | 726.1 | 795 | 781 | 158.9 |
| A | 8 | 255 | 12646 | 74.66 | 795 | 781 | 158.9 |
| B | 7 | 220 | 191381 | 1302.96 | 788 | 770 | 146.3 |
| B | 3 | 64 | 140266 | 953.55 | 788 | 770 | 146.3 |
| B | 0 | 219 | 31606 | 210.79 | 788 | 770 | 146.3 |
| C | 14 | 238 | 122384 | 710.98 | 749 | 754 | 171.1 |
| C | 7 | 247 | 7643 | 40.27 | 749 | 754 | 171.1 |
| C | 13 | 61 | 5292 | 26.53 | 749 | 754 | 171.1 |
| D | 1 | 52 | 61431 | 336.53 | 764 | 743 | 180.3 |
| D | 1 | 20 | 51485 | 281.38 | 764 | 743 | 180.3 |
| D | 2 | 234 | 24527 | 131.89 | 764 | 743 | 180.3 |
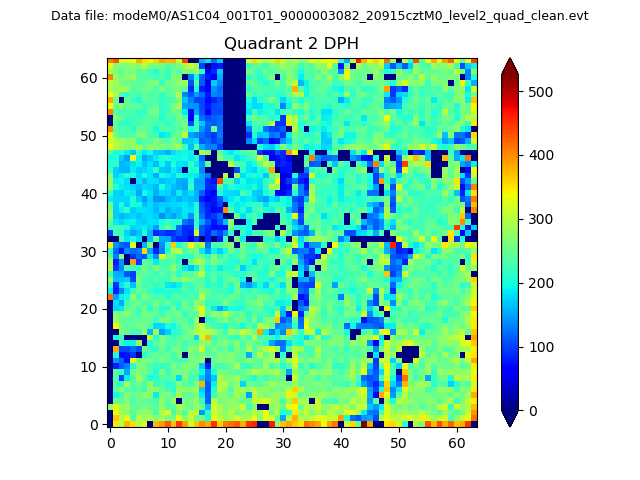
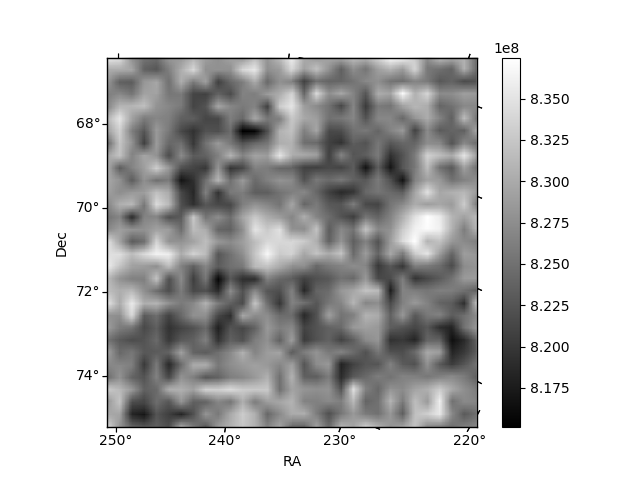
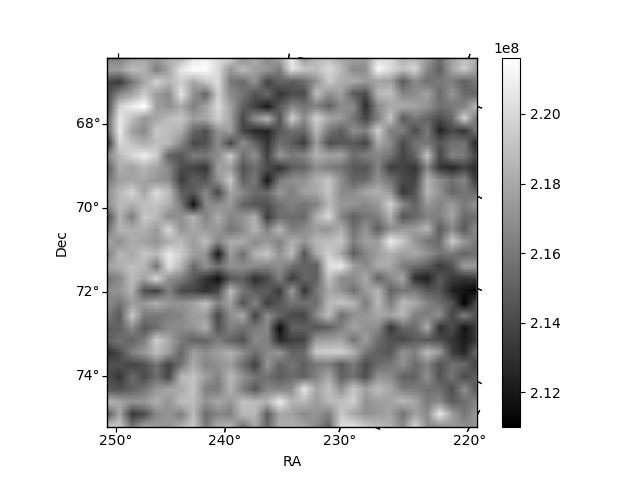
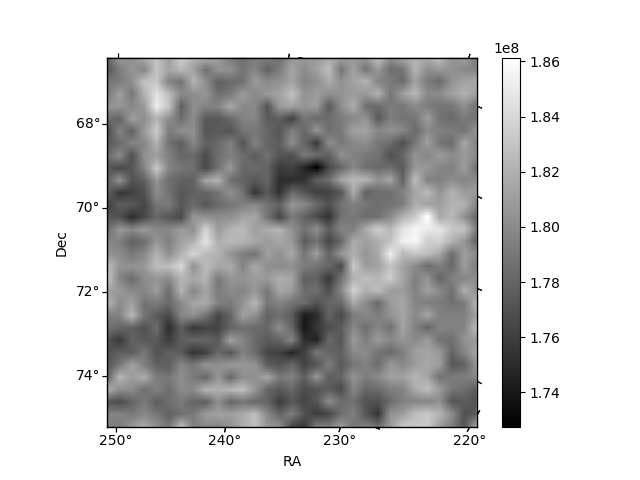
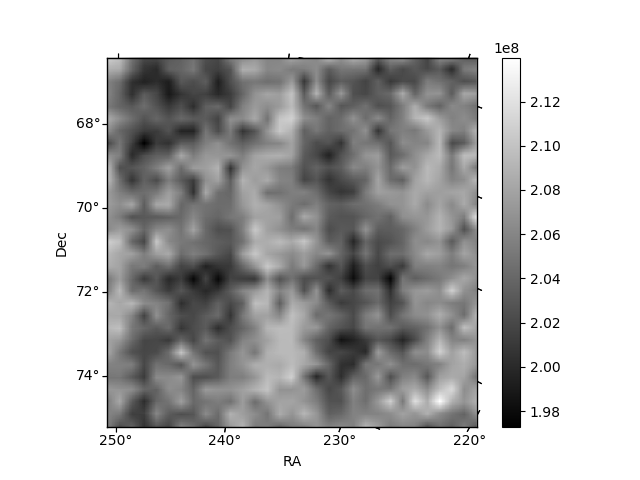
Histogram calculated using DETX and DETY for each event in the final _common_clean file
| Quadrant A | 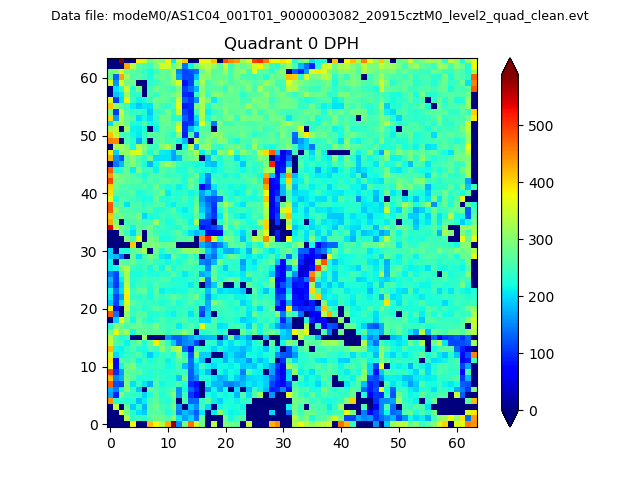 |
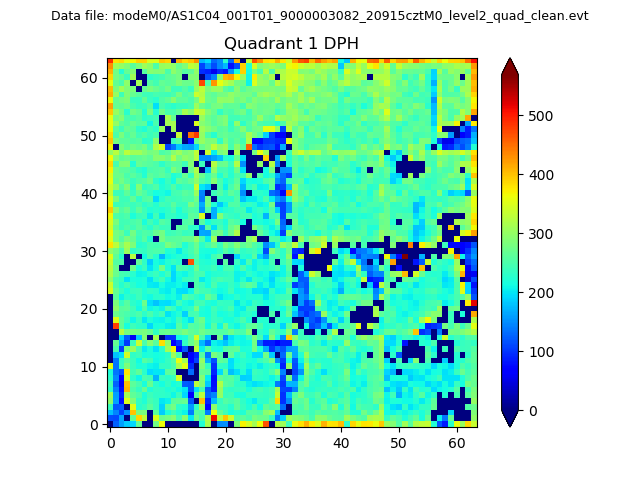 |
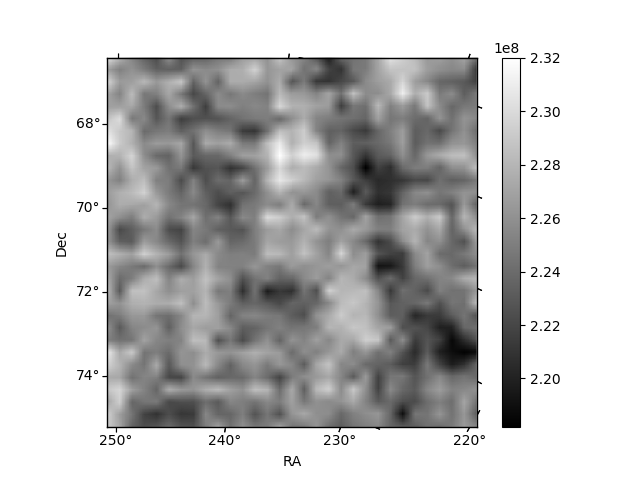
Quadrant B |
|---|---|---|---|
| Quadrant D | 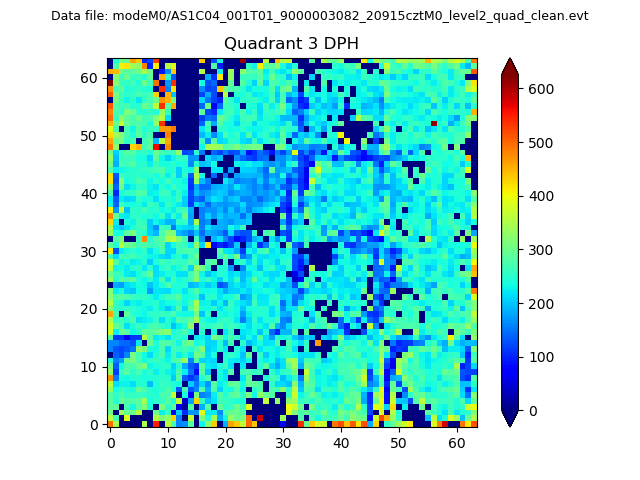 |
 |
Quadrant C |
| Plot type | Count rate plots | Images |
|---|---|---|
| Comparison with Poisson distribution Blue bars denote a histogram of data divided into 1 sec bins. Red curve is a Poisson curve with rate = median count rate of data. |
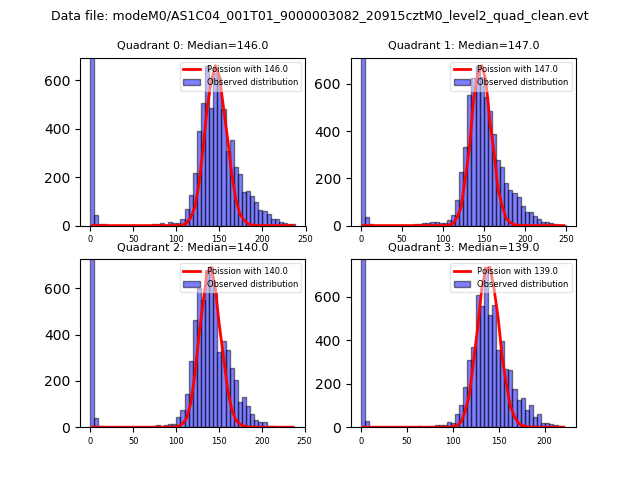 |
 |
| Quadrant-wise count rates Data is divided into 100 sec bins |
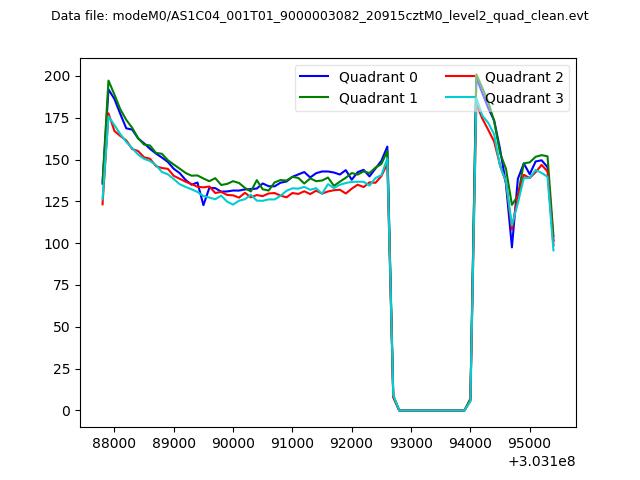 |
|
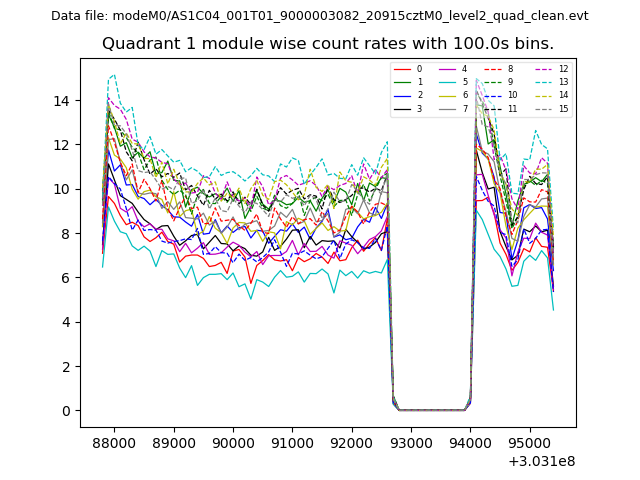
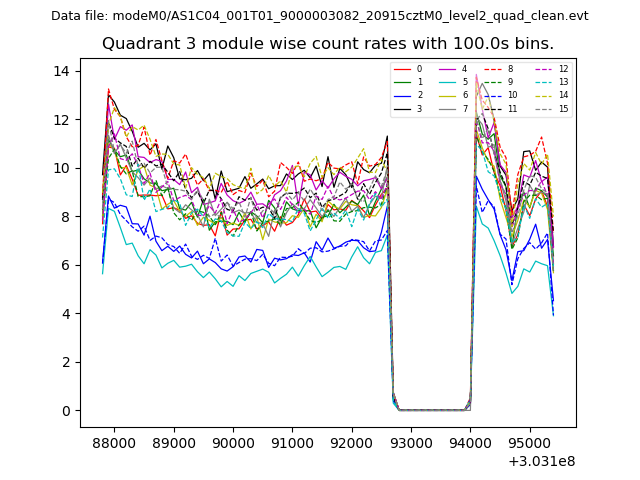
| Module-wise count rates for Quadrant A Data is divided into 100 sec bins |
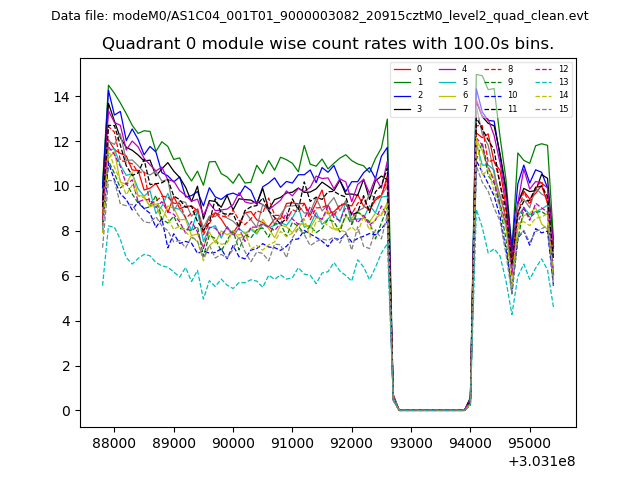 |
 |
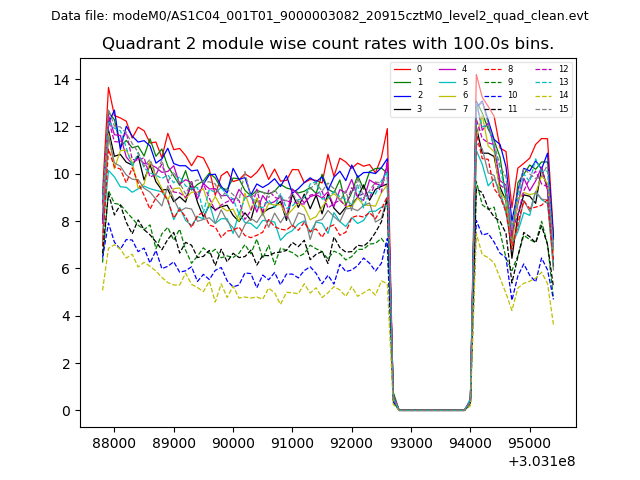
| Module-wise count rates for Quadrant B Data is divided into 100 sec bins |
 |
 |
| Module-wise count rates for Quadrant C Data is divided into 100 sec bins |
 |
 |
| Module-wise count rates for Quadrant D Data is divided into 100 sec bins |
 |
 |
| Parameter | Plot |
|---|---|
| CZT HV Monitor | 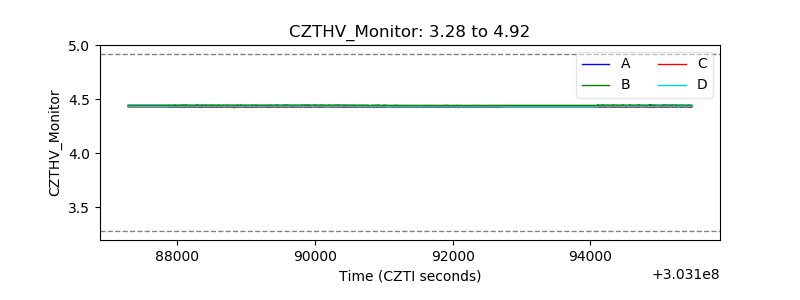 |
| D_VDD | 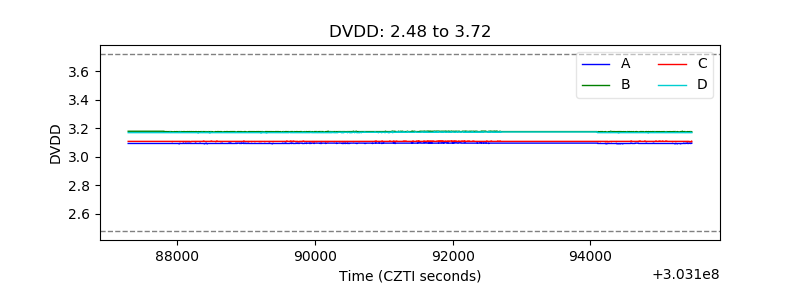 |
| Temperature 1 | 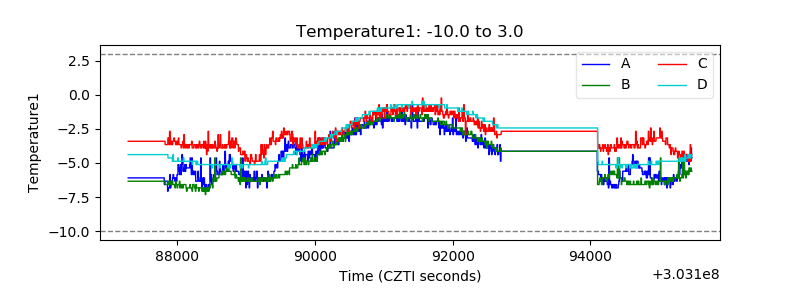 |
| Veto HV Monitor | 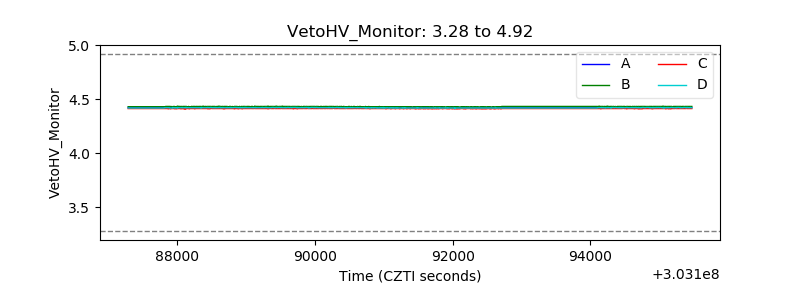 |
| Veto LLD | 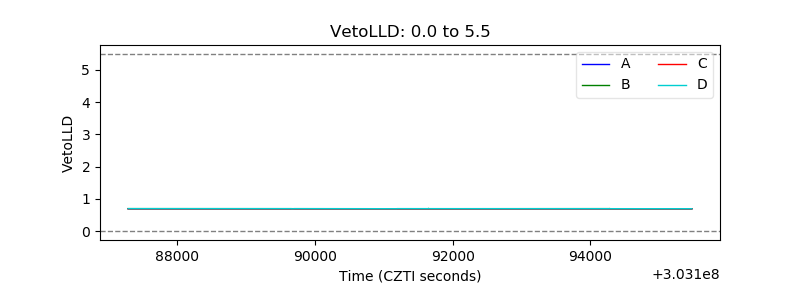 |
| Alpha Counter | 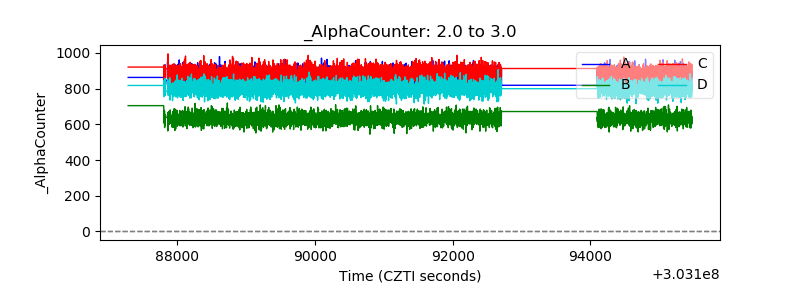 |
| _CPM_Rate | 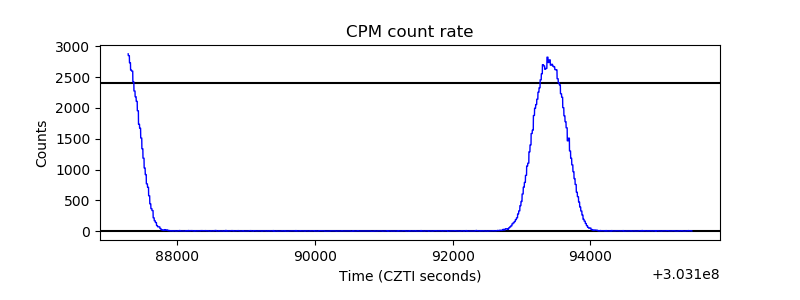 |
| CZT Counter | 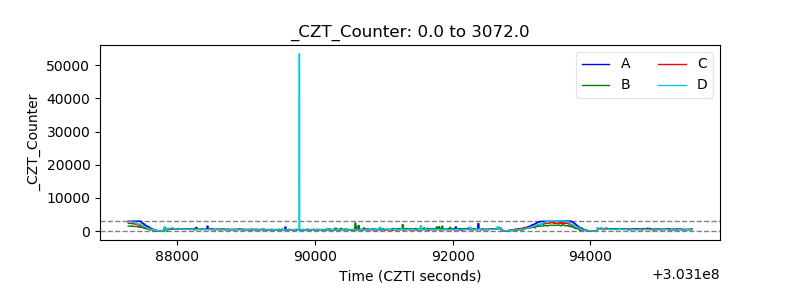 |
| +2.5 Volts monitor |  |
| +5 Volts monitor | 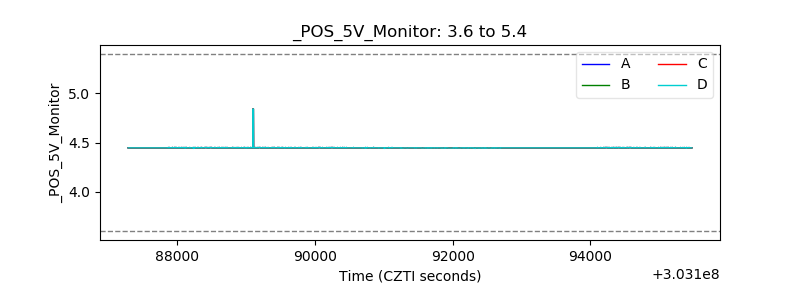 |
| _ROLL_ROT | 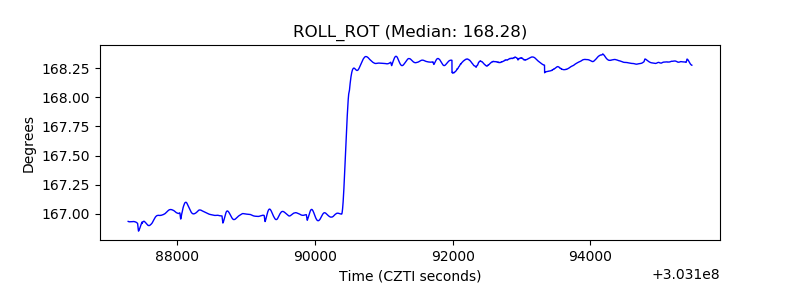 |
| _Roll_DEC | 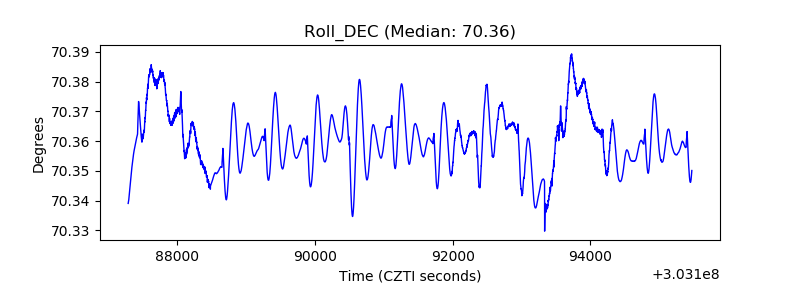 |
| _Roll_RA | 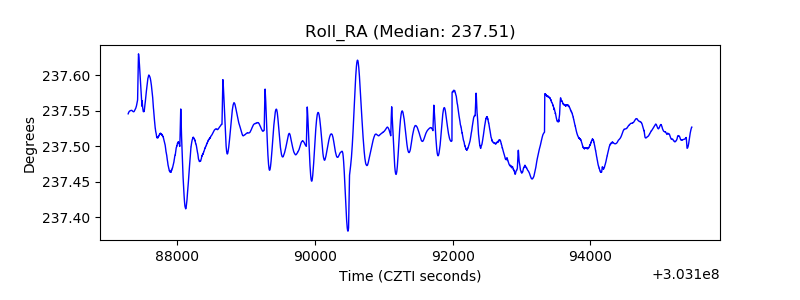 |
| Veto Counter | 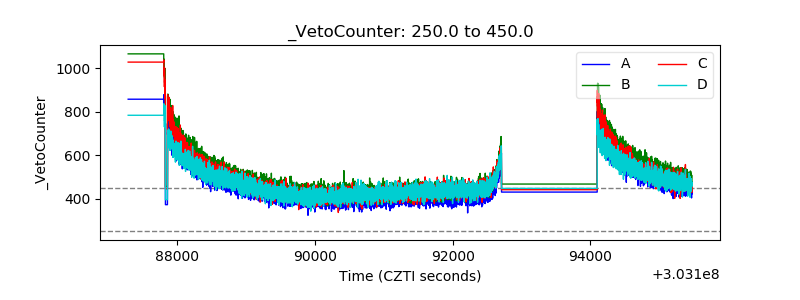 |