| Param | Original file | Final file |
|---|---|---|
| Filename | modeM0/AS1C04_001T01_9000003082_20916cztM0_level2.evt | modeM0/AS1C04_001T01_9000003082_20916cztM0_level2_quad_clean.evt |
| Size (bytes) | 50,601,600 | 15,598,080 |
| Size | 48.3 MB | 14.9 MB |
| Events in quadrant A | 395,350 | 108,202 |
| Events in quadrant B | 381,942 | 105,961 |
| Events in quadrant C | 355,987 | 101,803 |
| Events in quadrant D | 351,193 | 102,489 |
| Mode SS | |||
|---|---|---|---|
| Quadrant | BADHDUFLAG | Total packets | Discarded packets |
| A | 0 | 47 | 33 |
| B | 0 | 49 | 39 |
| C | 0 | 50 | 40 |
| D | 0 | 48 | 34 |
| Mode M9 | |||
|---|---|---|---|
| Quadrant | BADHDUFLAG | Total packets | Discarded packets |
| A | 0 | 9 | 8 |
| B | 0 | 7 | 4 |
| C | 0 | 11 | 9 |
| D | 0 | 7 | 4 |
| Mode M0 | |||
|---|---|---|---|
| Quadrant | BADHDUFLAG | Total packets | Discarded packets |
| A | 0 | 5312 | 3727 |
| B | 0 | 5681 | 4145 |
| C | 0 | 4950 | 3493 |
| D | 0 | 5161 | 3723 |
| Quadrant | Total seconds | Saturated seconds | Saturation percentage |
|---|---|---|---|
| A | 662 | 16 | 2.416918% |
| B | 645 | 17 | 2.635659% |
| C | 665 | 10 | 1.503759% |
| D | 660 | 3 | 0.454545% |
Noise dominated data is calculated using 1-second bins in cleaned event files. If a bin has >2000 counts, and if more than 50% of those come from <1% of pixels, then it is considered to be noise-dominated and hence unusable.
| Quadrant | # 1 sec bins | Bins with >0 counts | Bins with >2000 counts | High rate bins dominated by noise | Noise dominated (total time) | Noise dominated (detector-on time) | Marked lightcurve |
|---|---|---|---|---|---|---|---|
| A | 4154 | 738 | 2 | 2 | 0.05% | 0.27% | 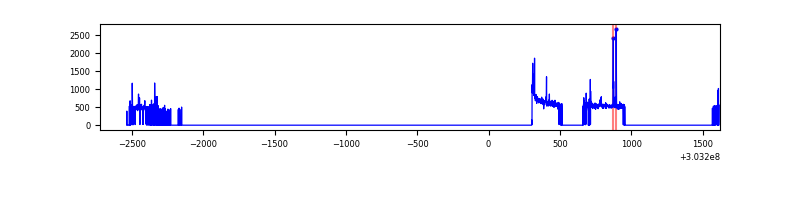 |
| B | 4146 | 714 | 0 | 0 | 0.00% | 0.00% | 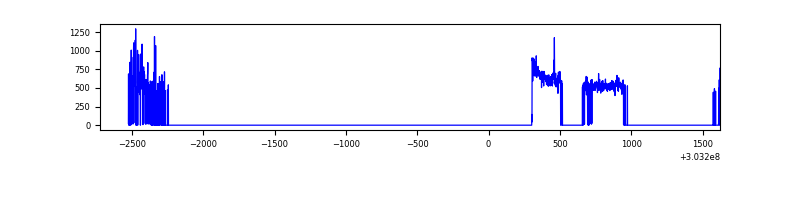 |
| C | 4346 | 753 | 0 | 0 | 0.00% | 0.00% | 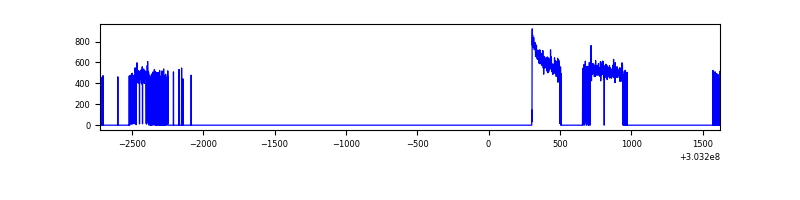 |
| D | 4227 | 735 | 0 | 0 | 0.00% | 0.00% | 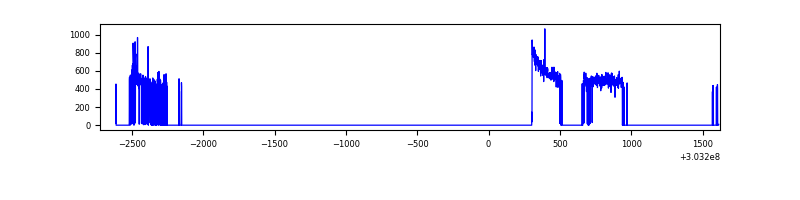 |
Top three noisy pixels from each quadrant. If the there are fewer than three noisy pixels in the level2.evt file, extra rows are filled as -1
| Pixel properties | Quadrant properties | ||||||
|---|---|---|---|---|---|---|---|
| Quadrant | DetID | PixID | Counts | Sigma | Mean | Median | Sigma |
| A | 5 | 16 | 30757 | 1482.98 | 92 | 90 | 20.7 |
| A | 6 | 16 | 5250 | 249.52 | 92 | 90 | 20.7 |
| A | 5 | 98 | 1953 | 90.09 | 92 | 90 | 20.7 |
| B | 7 | 220 | 17778 | 936.68 | 89 | 87 | 18.9 |
| B | 0 | 219 | 6848 | 357.97 | 89 | 87 | 18.9 |
| B | 4 | 216 | 2259 | 115.0 | 89 | 87 | 18.9 |
| C | 14 | 238 | 13933 | 628.57 | 87 | 87 | 22.0 |
| C | 7 | 247 | 1110 | 46.44 | 87 | 87 | 22.0 |
| C | 3 | 233 | 762 | 30.64 | 87 | 87 | 22.0 |
| D | 1 | 52 | 8565 | 361.37 | 89 | 86 | 23.5 |
| D | 3 | 238 | 2259 | 92.61 | 89 | 86 | 23.5 |
| D | 2 | 234 | 2180 | 89.24 | 89 | 86 | 23.5 |
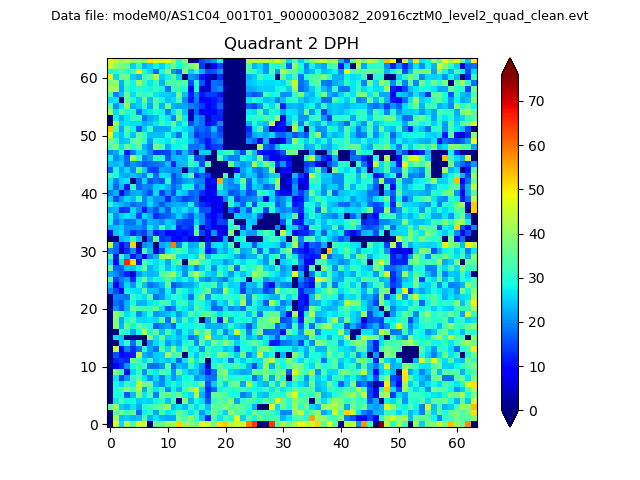
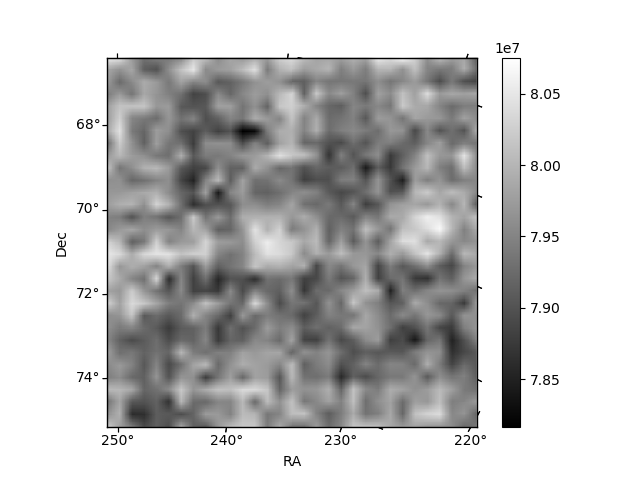
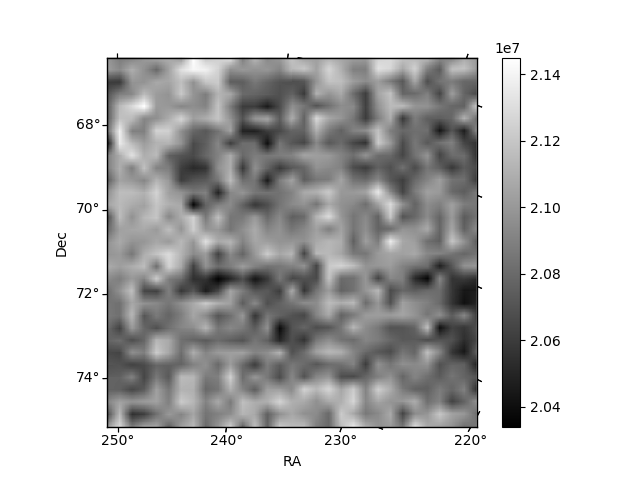
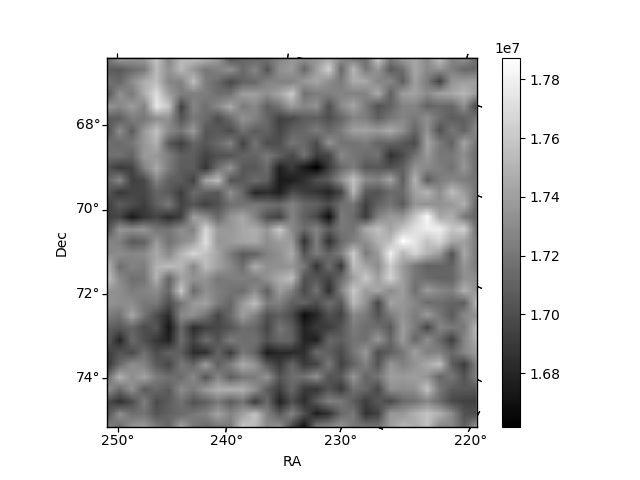
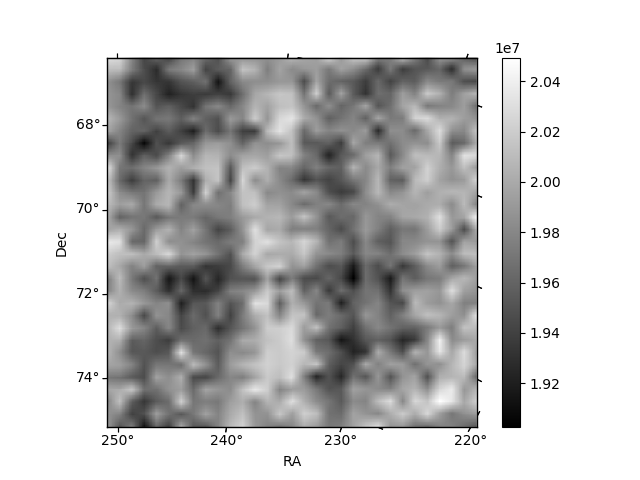
Histogram calculated using DETX and DETY for each event in the final _common_clean file
| Quadrant A | 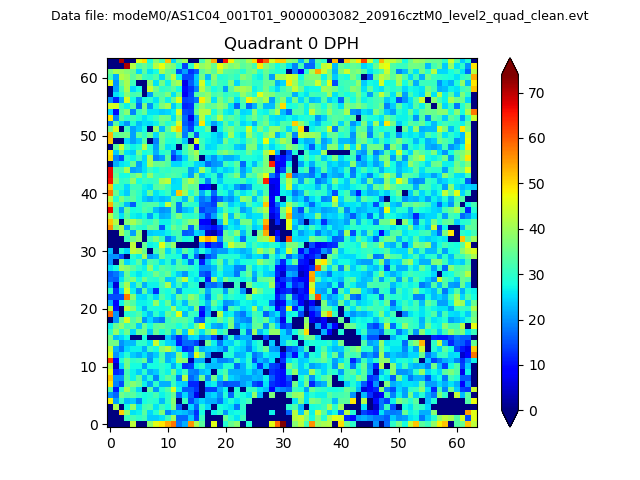 |
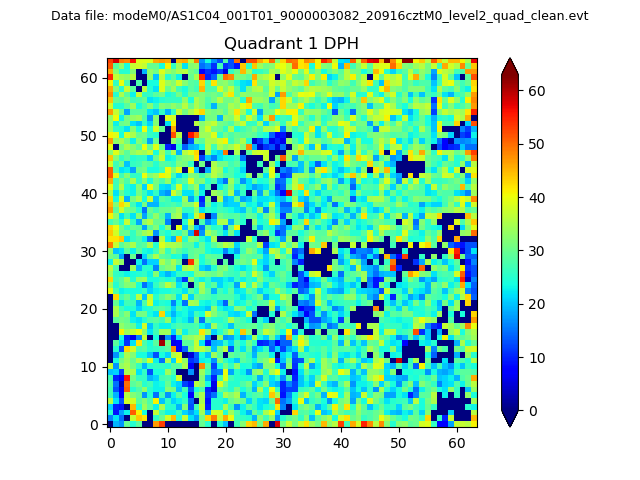 |
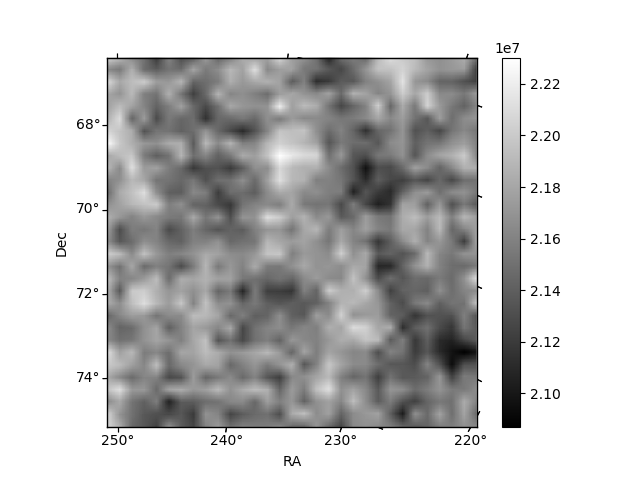
Quadrant B |
|---|---|---|---|
| Quadrant D | 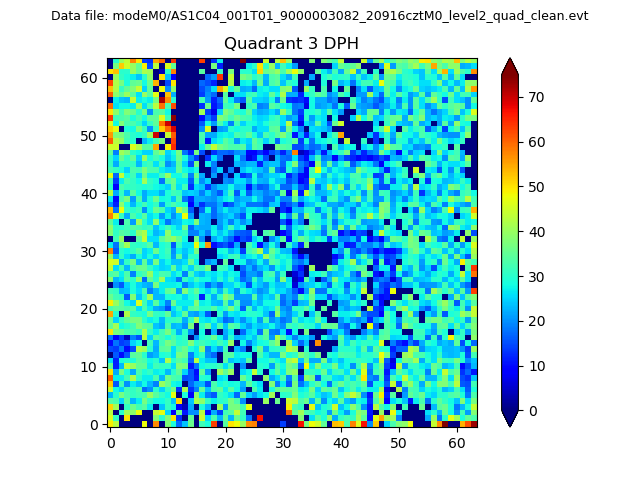 |
 |
Quadrant C |
| Plot type | Count rate plots | Images |
|---|---|---|
| Comparison with Poisson distribution Blue bars denote a histogram of data divided into 1 sec bins. Red curve is a Poisson curve with rate = median count rate of data. |
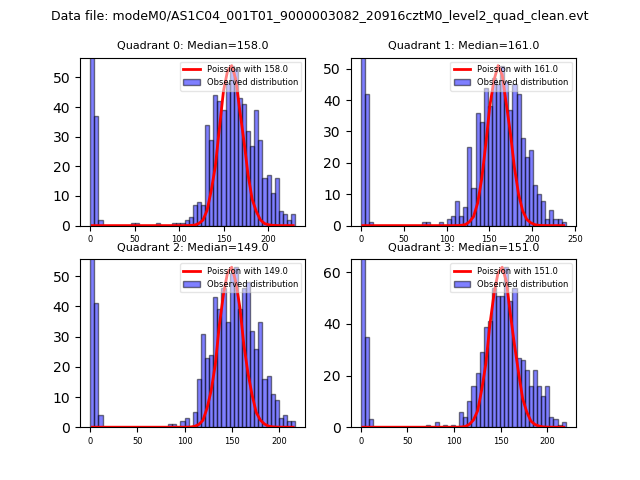 |
 |
| Quadrant-wise count rates Data is divided into 100 sec bins |
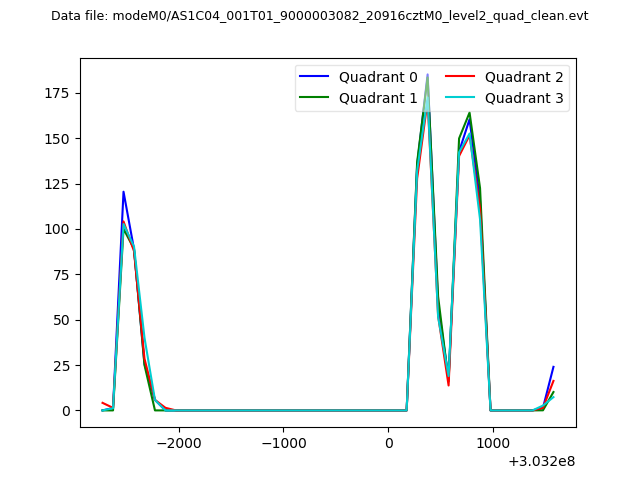 |
|
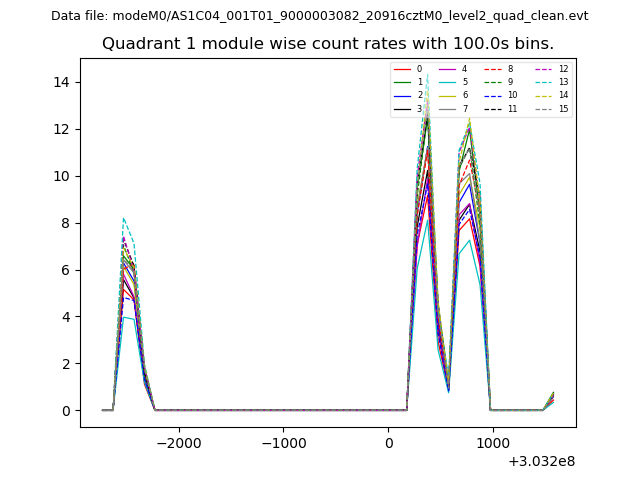
| Module-wise count rates for Quadrant A Data is divided into 100 sec bins |
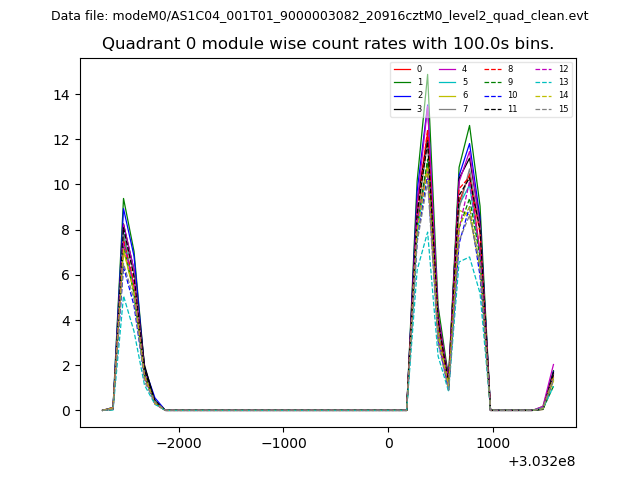 |
 |
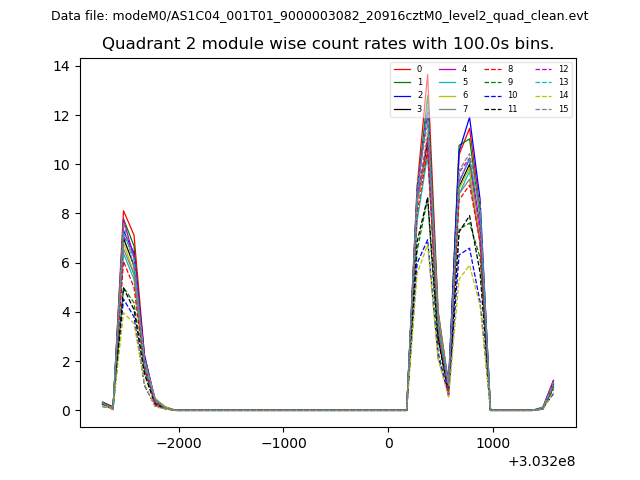
| Module-wise count rates for Quadrant B Data is divided into 100 sec bins |
 |
 |
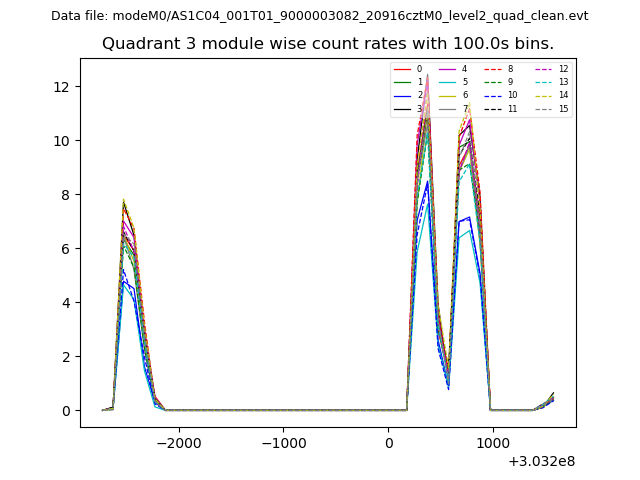
| Module-wise count rates for Quadrant C Data is divided into 100 sec bins |
 |
 |
| Module-wise count rates for Quadrant D Data is divided into 100 sec bins |
 |
 |
| Parameter | Plot |
|---|---|
| CZT HV Monitor | 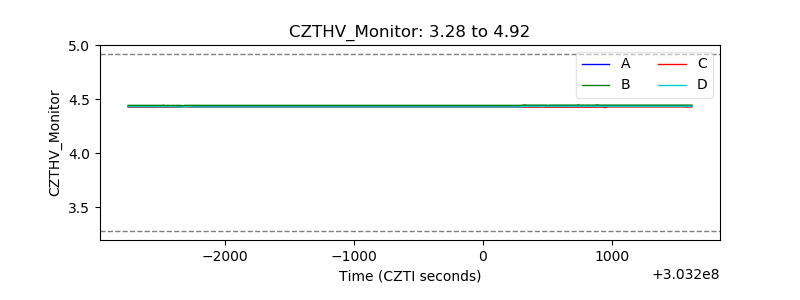 |
| D_VDD | 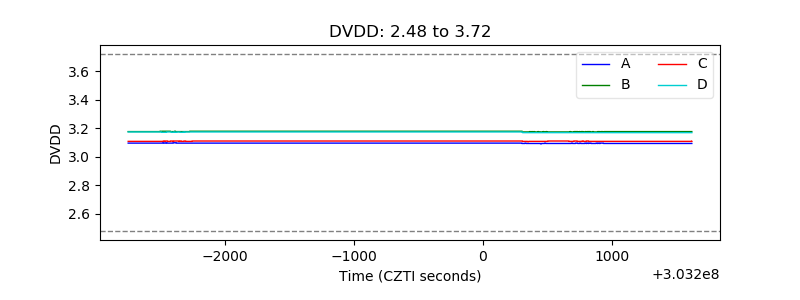 |
| Temperature 1 | 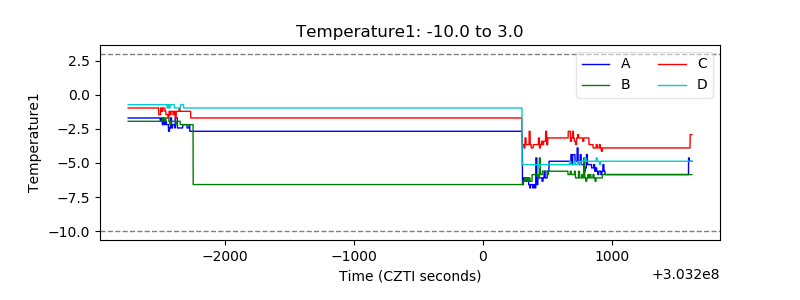 |
| Veto HV Monitor | 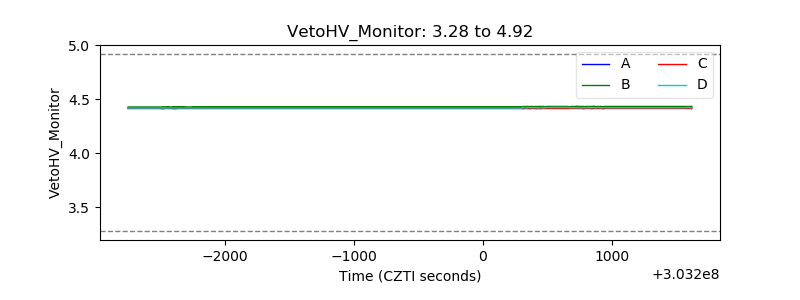 |
| Veto LLD | 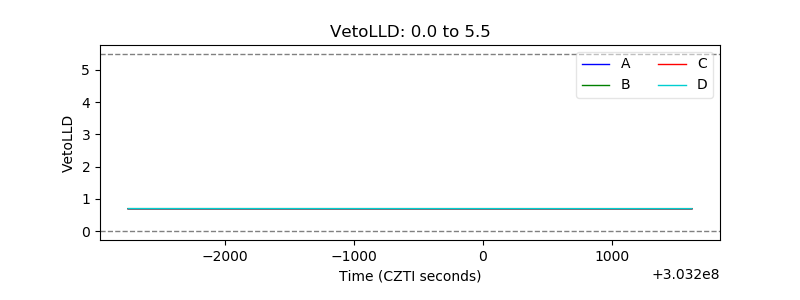 |
| Alpha Counter | 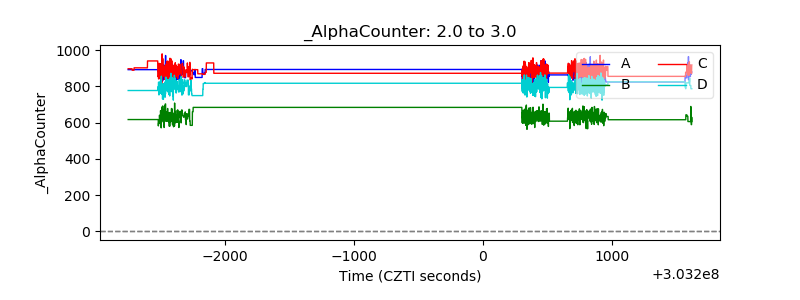 |
| _CPM_Rate | 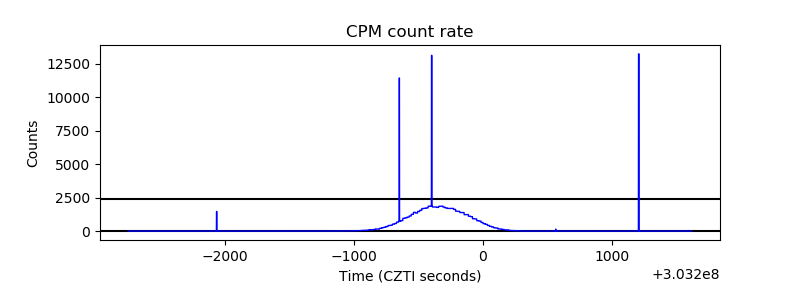 |
| CZT Counter | 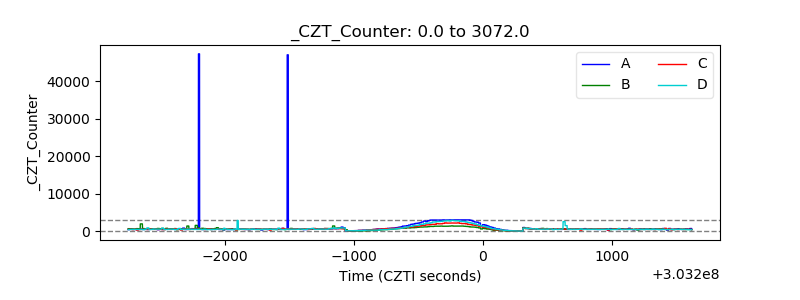 |
| +2.5 Volts monitor | 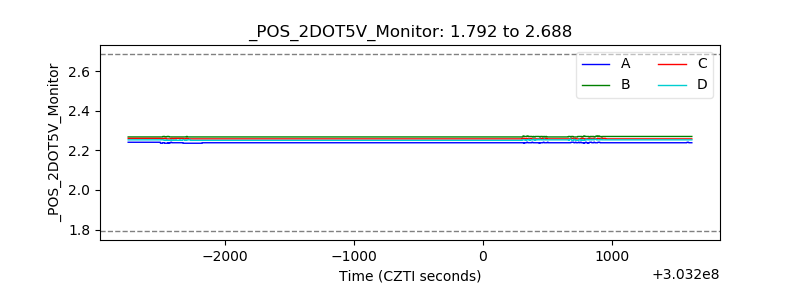 |
| +5 Volts monitor |  |
| _ROLL_ROT | 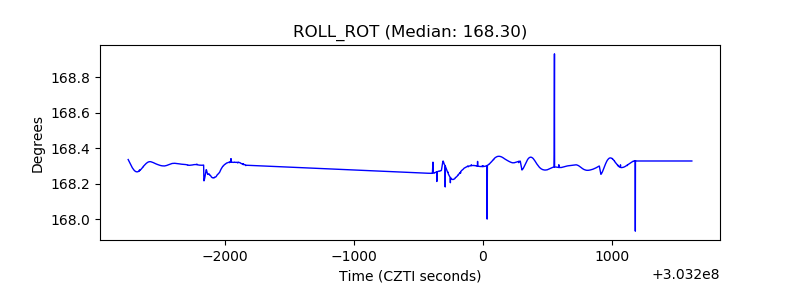 |
| _Roll_DEC | 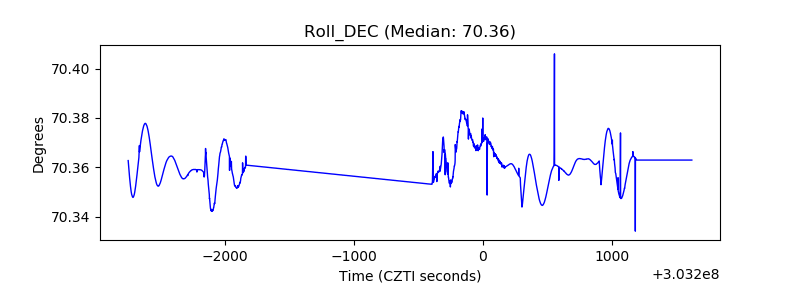 |
| _Roll_RA | 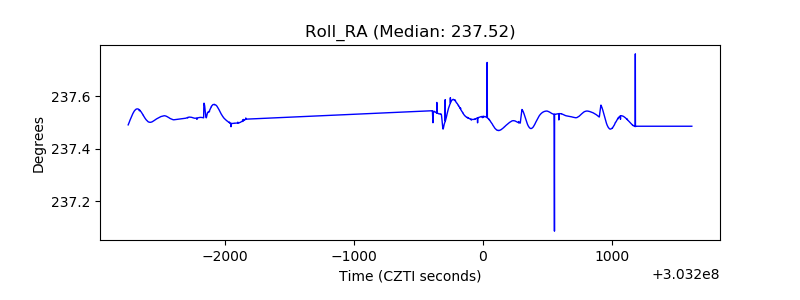 |
| Veto Counter | 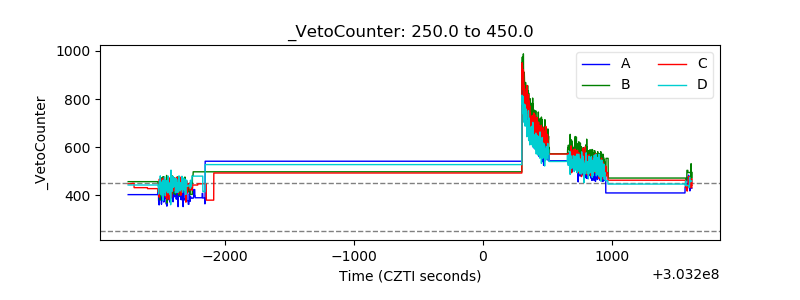 |