| Param | Original file | Final file |
|---|---|---|
| Filename | modeM0/AS1C04_001T01_9000003082_20917cztM0_level2.evt | modeM0/AS1C04_001T01_9000003082_20917cztM0_level2_quad_clean.evt |
| Size (bytes) | 745,467,840 | 212,832,000 |
| Size | 710.9 MB | 203.0 MB |
| Events in quadrant A | 6,082,389 | 1,474,002 |
| Events in quadrant B | 5,713,041 | 1,476,420 |
| Events in quadrant C | 5,017,561 | 1,396,149 |
| Events in quadrant D | 5,071,961 | 1,392,738 |
| Mode SS | |||
|---|---|---|---|
| Quadrant | BADHDUFLAG | Total packets | Discarded packets |
| A | 0 | 208 | 0 |
| B | 0 | 208 | 0 |
| C | 0 | 208 | 0 |
| D | 0 | 208 | 0 |
| Mode M9 | |||
|---|---|---|---|
| Quadrant | BADHDUFLAG | Total packets | Discarded packets |
| A | 0 | 27 | 0 |
| B | 0 | 27 | 0 |
| C | 0 | 27 | 0 |
| D | 0 | 27 | 0 |
| Mode M0 | |||
|---|---|---|---|
| Quadrant | BADHDUFLAG | Total packets | Discarded packets |
| A | 0 | 24411 | 4 |
| B | 0 | 23310 | 2 |
| C | 0 | 21210 | 2 |
| D | 0 | 21780 | 2 |
| Quadrant | Total seconds | Saturated seconds | Saturation percentage |
|---|---|---|---|
| A | 10213 | 212 | 2.075786% |
| B | 10214 | 202 | 1.977678% |
| C | 10214 | 146 | 1.429411% |
| D | 10214 | 129 | 1.262972% |
Noise dominated data is calculated using 1-second bins in cleaned event files. If a bin has >2000 counts, and if more than 50% of those come from <1% of pixels, then it is considered to be noise-dominated and hence unusable.
| Quadrant | # 1 sec bins | Bins with >0 counts | Bins with >2000 counts | High rate bins dominated by noise | Noise dominated (total time) | Noise dominated (detector-on time) | Marked lightcurve |
|---|---|---|---|---|---|---|---|
| A | 12873 | 10215 | 71 | 71 | 0.55% | 0.70% | 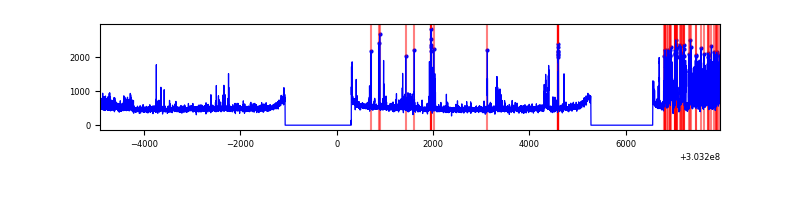 |
| B | 12873 | 10215 | 49 | 49 | 0.38% | 0.48% | 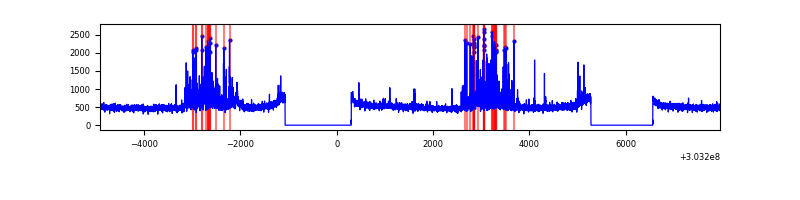 |
| C | 12873 | 10215 | 1 | 1 | 0.01% | 0.01% | 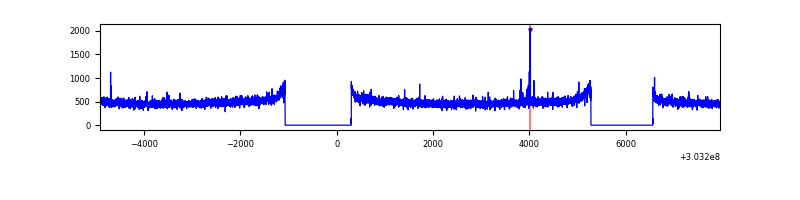 |
| D | 12873 | 10215 | 61 | 61 | 0.47% | 0.60% | 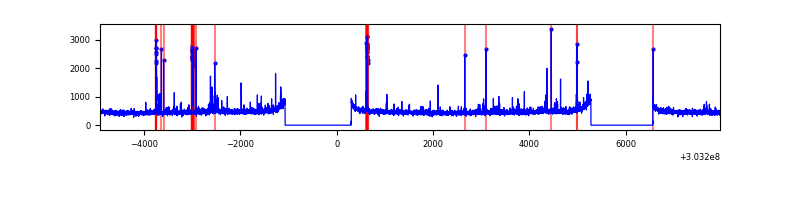 |
Top three noisy pixels from each quadrant. If the there are fewer than three noisy pixels in the level2.evt file, extra rows are filled as -1
| Pixel properties | Quadrant properties | ||||||
|---|---|---|---|---|---|---|---|
| Quadrant | DetID | PixID | Counts | Sigma | Mean | Median | Sigma |
| A | 6 | 16 | 905140 | 3545.71 | 1298 | 1275 | 254.9 |
| A | 5 | 16 | 185672 | 723.36 | 1298 | 1275 | 254.9 |
| A | 0 | 226 | 11390 | 39.68 | 1298 | 1275 | 254.9 |
| B | 7 | 220 | 468253 | 1983.96 | 1277 | 1249 | 235.4 |
| B | 0 | 219 | 61629 | 256.51 | 1277 | 1249 | 235.4 |
| B | 4 | 216 | 59624 | 247.99 | 1277 | 1249 | 235.4 |
| C | 14 | 238 | 195349 | 700.95 | 1216 | 1221 | 276.9 |
| C | 9 | 54 | 42251 | 148.15 | 1216 | 1221 | 276.9 |
| C | 7 | 247 | 22396 | 76.46 | 1216 | 1221 | 276.9 |
| D | 1 | 52 | 195793 | 648.89 | 1252 | 1215 | 299.9 |
| D | 5 | 32 | 68137 | 223.18 | 1252 | 1215 | 299.9 |
| D | 2 | 234 | 42392 | 137.32 | 1252 | 1215 | 299.9 |
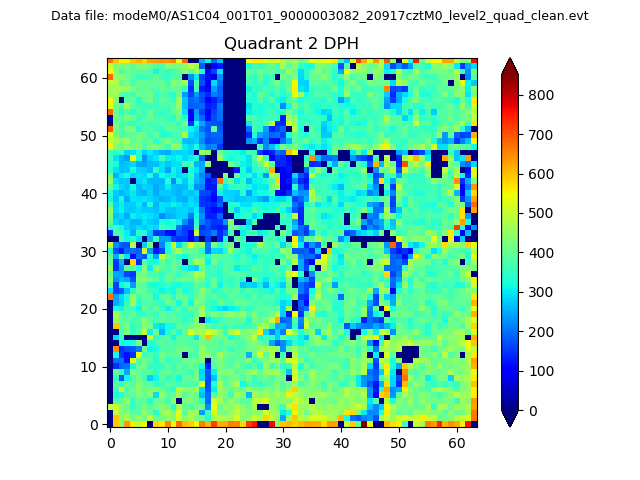
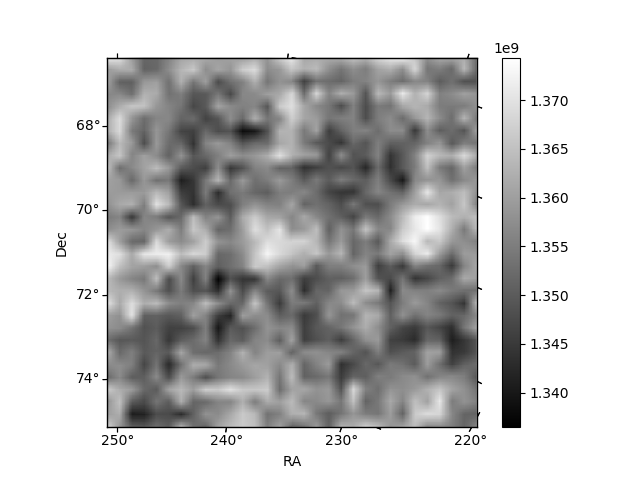
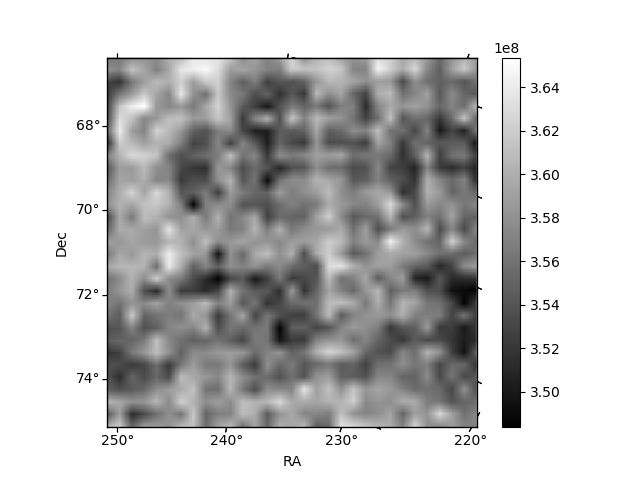
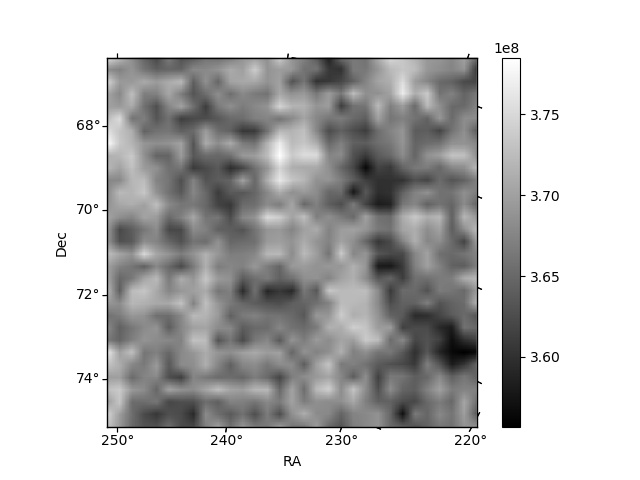
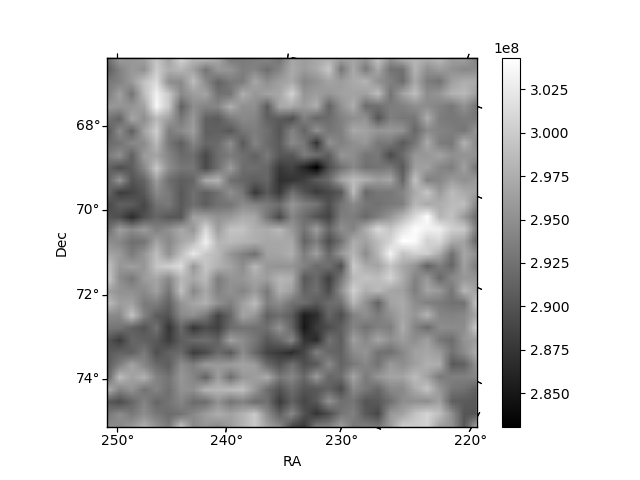
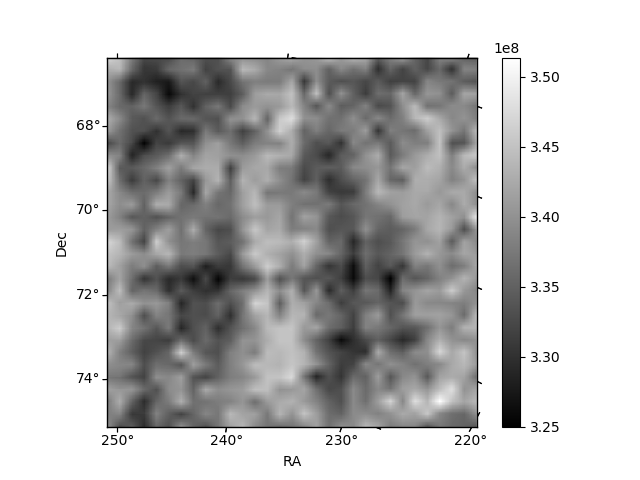
Histogram calculated using DETX and DETY for each event in the final _common_clean file
| Quadrant A | 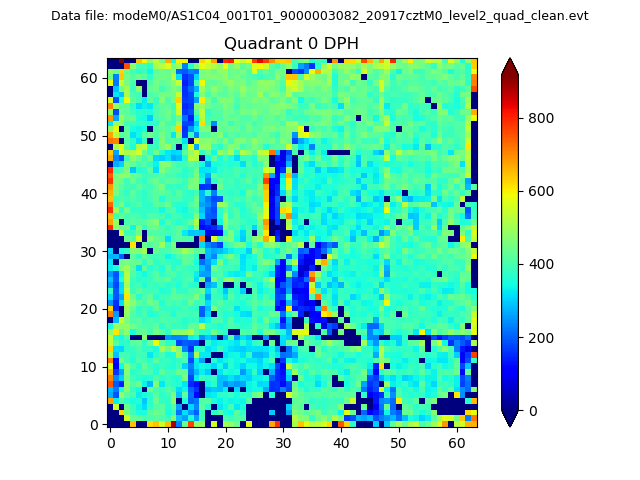 |
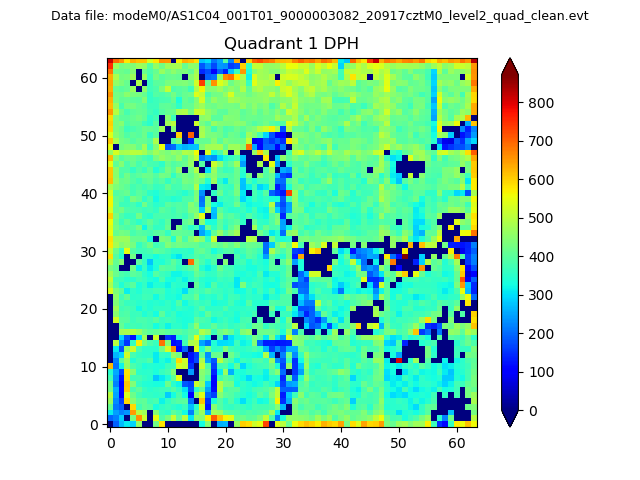 |
Quadrant B |
|---|---|---|---|
| Quadrant D | 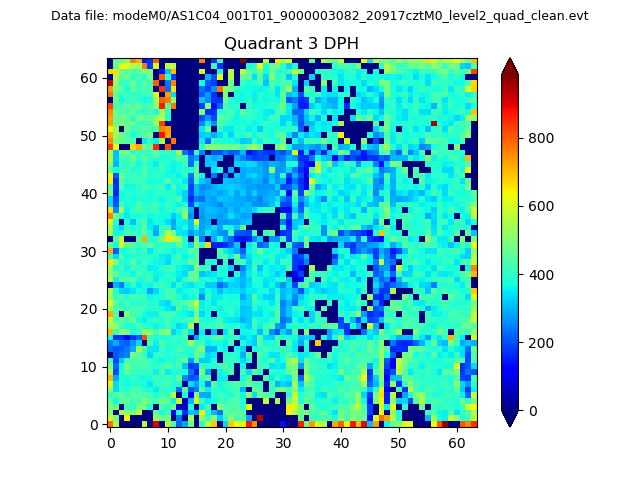 |
 |
Quadrant C |
| Plot type | Count rate plots | Images |
|---|---|---|
| Comparison with Poisson distribution Blue bars denote a histogram of data divided into 1 sec bins. Red curve is a Poisson curve with rate = median count rate of data. |
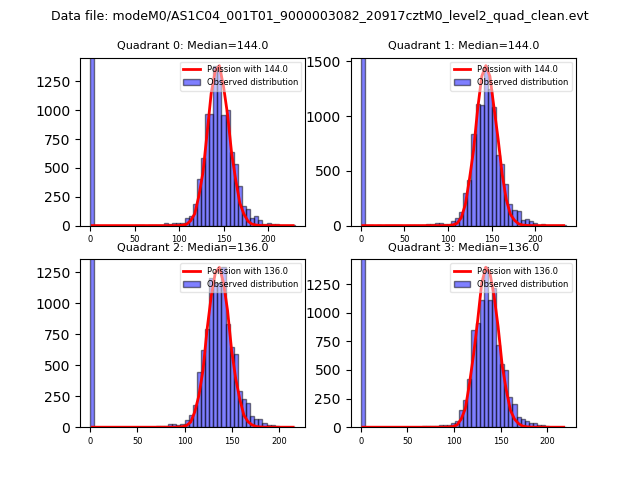 |
 |
| Quadrant-wise count rates Data is divided into 100 sec bins |
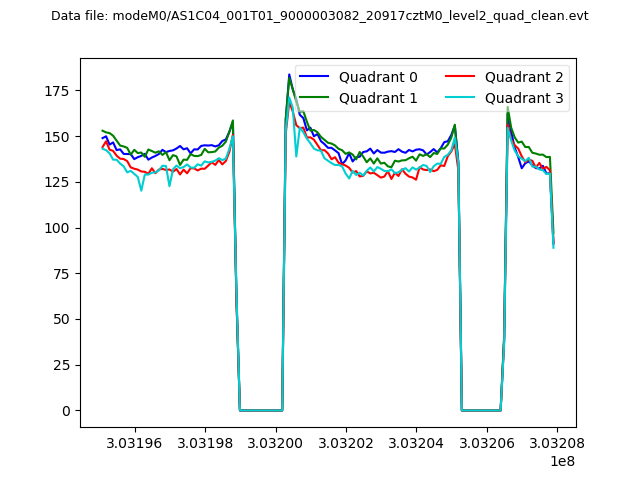 |
|
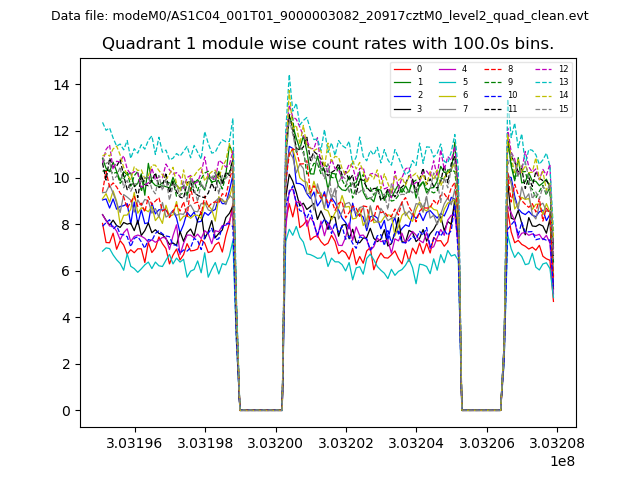
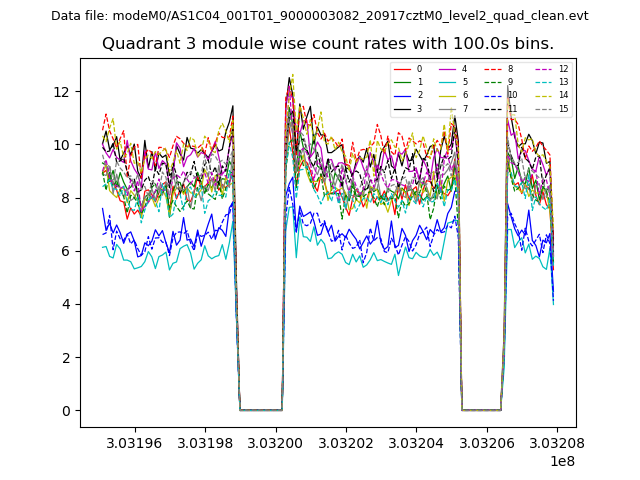
| Module-wise count rates for Quadrant A Data is divided into 100 sec bins |
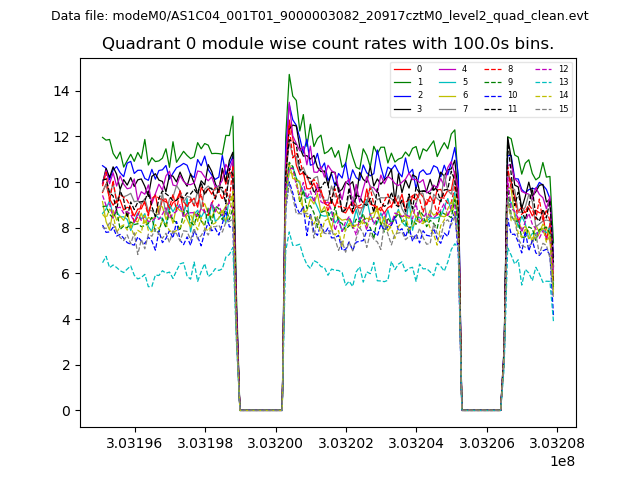 |
 |
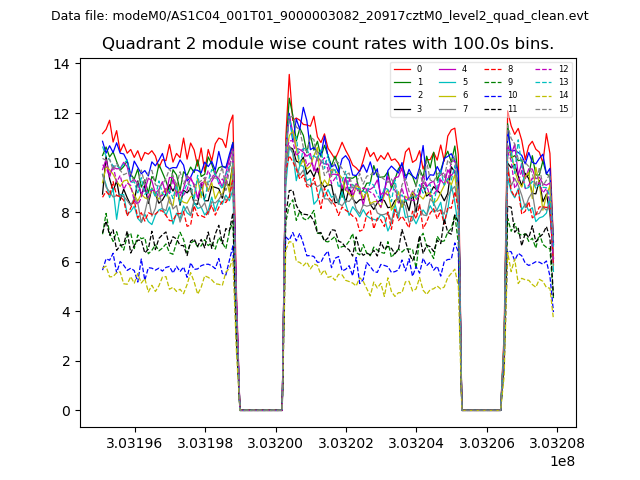
| Module-wise count rates for Quadrant B Data is divided into 100 sec bins |
 |
 |
| Module-wise count rates for Quadrant C Data is divided into 100 sec bins |
 |
 |
| Module-wise count rates for Quadrant D Data is divided into 100 sec bins |
 |
 |
| Parameter | Plot |
|---|---|
| CZT HV Monitor | 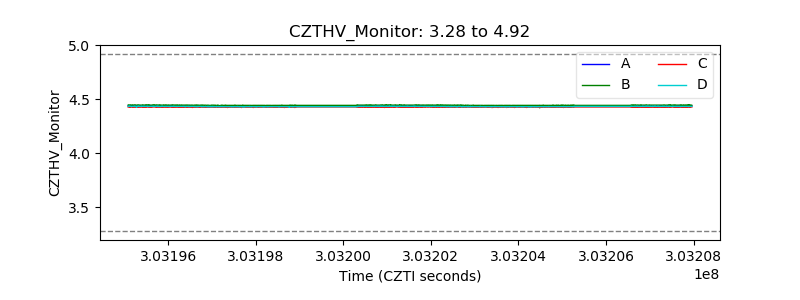 |
| D_VDD | 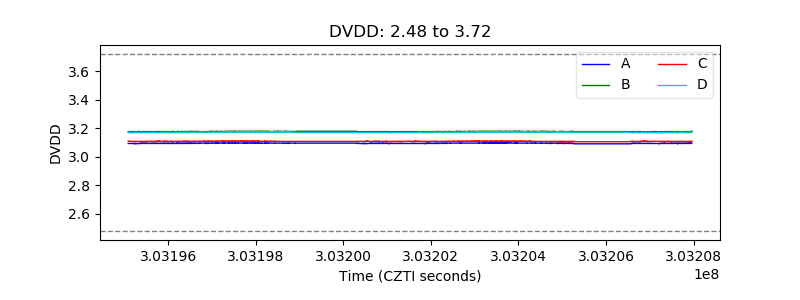 |
| Temperature 1 | 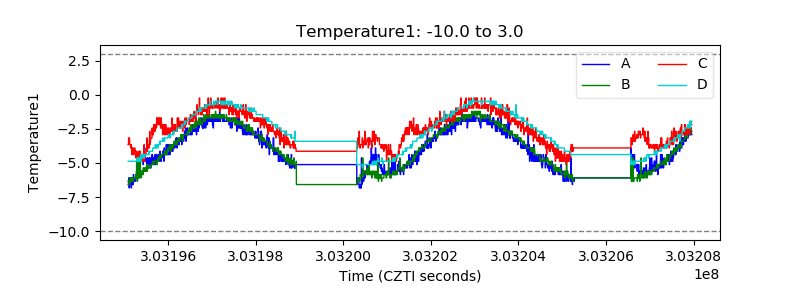 |
| Veto HV Monitor | 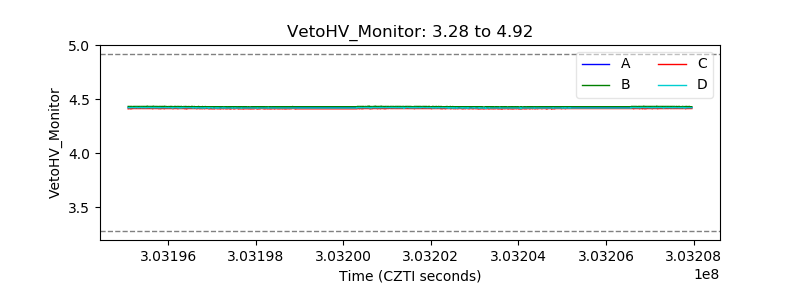 |
| Veto LLD | 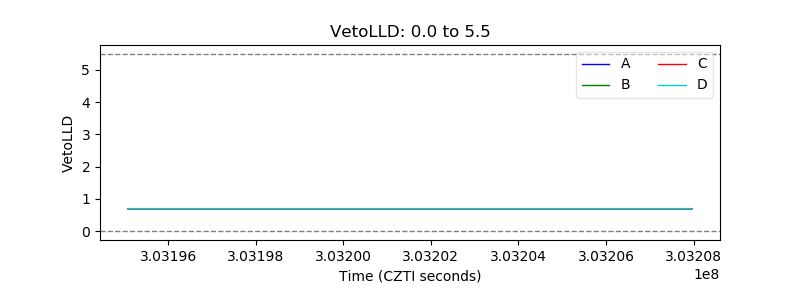 |
| Alpha Counter | 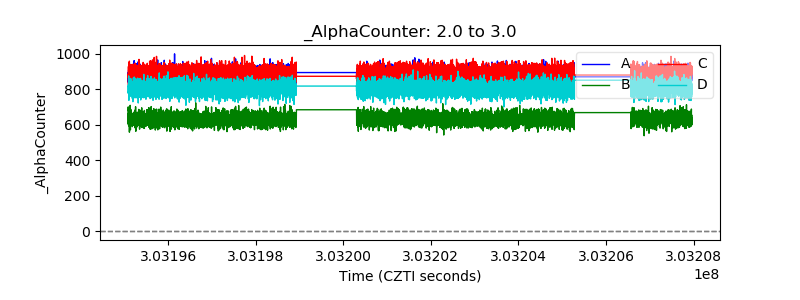 |
| _CPM_Rate | 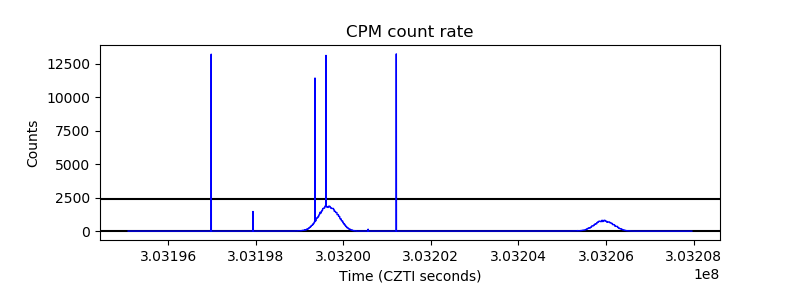 |
| CZT Counter | 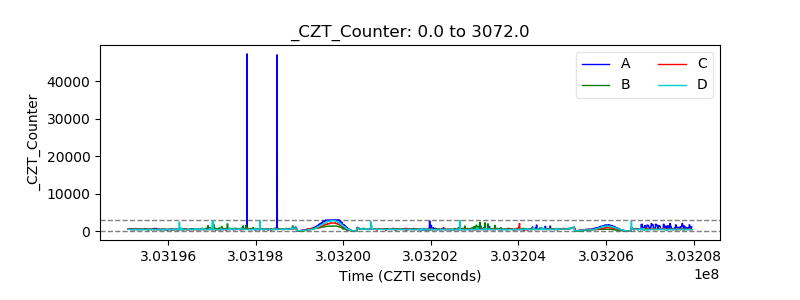 |
| +2.5 Volts monitor |  |
| +5 Volts monitor |  |
| _ROLL_ROT | 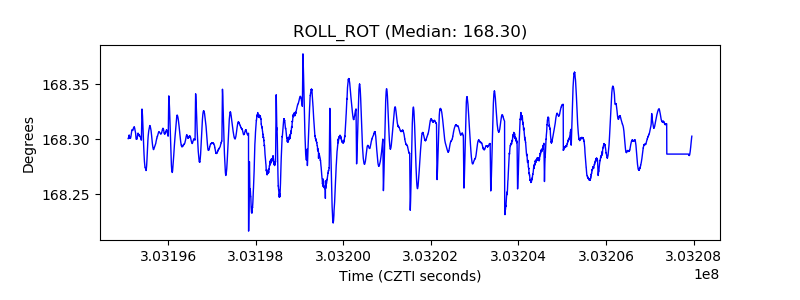 |
| _Roll_DEC | 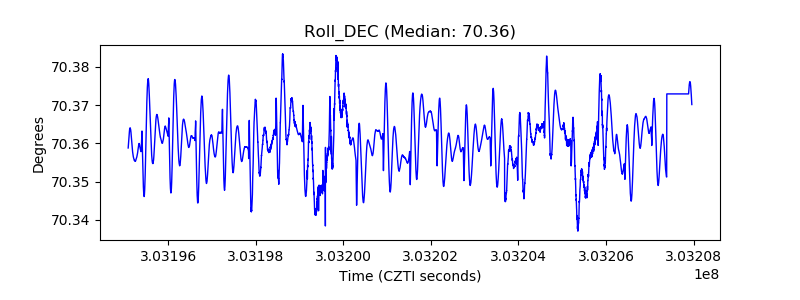 |
| _Roll_RA | 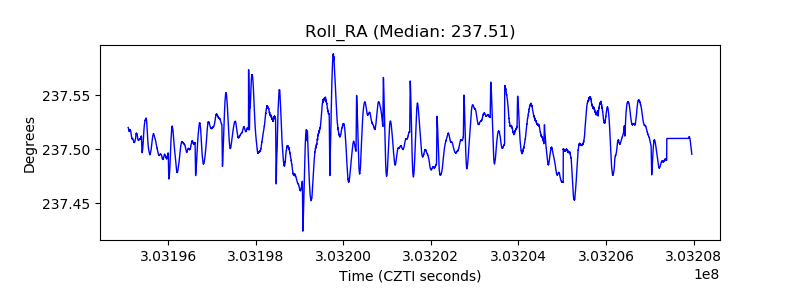 |
| Veto Counter |  |