| Param | Original file | Final file |
|---|---|---|
| Filename | modeM0/AS1C04_001T01_9000003082_20918cztM0_level2.evt | modeM0/AS1C04_001T01_9000003082_20918cztM0_level2_quad_clean.evt |
| Size (bytes) | 459,440,640 | 124,845,120 |
| Size | 438.2 MB | 119.1 MB |
| Events in quadrant A | 4,259,184 | 848,315 |
| Events in quadrant B | 3,158,175 | 858,705 |
| Events in quadrant C | 2,978,921 | 817,030 |
| Events in quadrant D | 3,088,029 | 815,805 |
| Mode SS | |||
|---|---|---|---|
| Quadrant | BADHDUFLAG | Total packets | Discarded packets |
| A | 0 | 130 | 0 |
| B | 0 | 130 | 0 |
| C | 0 | 130 | 0 |
| D | 0 | 130 | 0 |
| Mode M9 | |||
|---|---|---|---|
| Quadrant | BADHDUFLAG | Total packets | Discarded packets |
| A | 0 | 9 | 0 |
| B | 0 | 9 | 0 |
| C | 0 | 9 | 0 |
| D | 0 | 9 | 0 |
| Mode M0 | |||
|---|---|---|---|
| Quadrant | BADHDUFLAG | Total packets | Discarded packets |
| A | 0 | 16685 | 1 |
| B | 0 | 13309 | 1 |
| C | 0 | 12911 | 1 |
| D | 0 | 13487 | 1 |
| Quadrant | Total seconds | Saturated seconds | Saturation percentage |
|---|---|---|---|
| A | 6319 | 274 | 4.336129% |
| B | 6320 | 116 | 1.835443% |
| C | 6320 | 106 | 1.677215% |
| D | 6320 | 124 | 1.962025% |
Noise dominated data is calculated using 1-second bins in cleaned event files. If a bin has >2000 counts, and if more than 50% of those come from <1% of pixels, then it is considered to be noise-dominated and hence unusable.
| Quadrant | # 1 sec bins | Bins with >0 counts | Bins with >2000 counts | High rate bins dominated by noise | Noise dominated (total time) | Noise dominated (detector-on time) | Marked lightcurve |
|---|---|---|---|---|---|---|---|
| A | 7279 | 6320 | 109 | 109 | 1.50% | 1.72% | 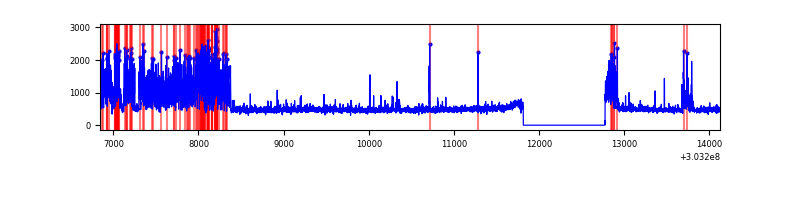 |
| B | 7280 | 6321 | 13 | 13 | 0.18% | 0.21% | 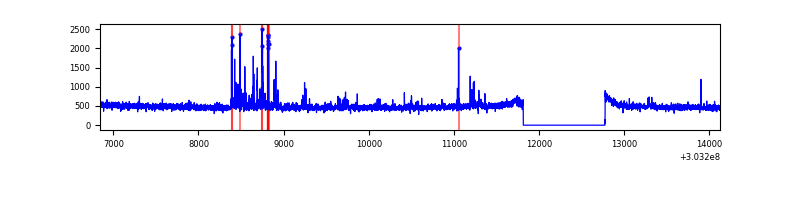 |
| C | 7280 | 6321 | 0 | 0 | 0.00% | 0.00% | 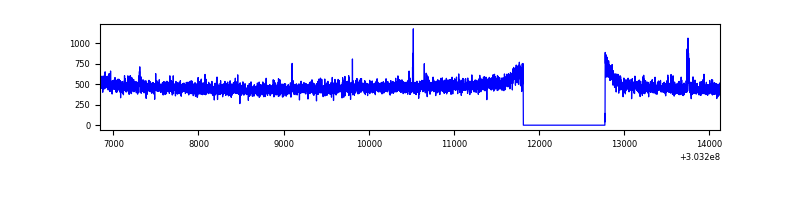 |
| D | 7280 | 6321 | 62 | 62 | 0.85% | 0.98% | 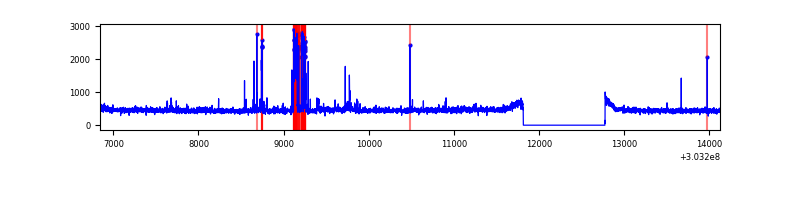 |
Top three noisy pixels from each quadrant. If the there are fewer than three noisy pixels in the level2.evt file, extra rows are filled as -1
| Pixel properties | Quadrant properties | ||||||
|---|---|---|---|---|---|---|---|
| Quadrant | DetID | PixID | Counts | Sigma | Mean | Median | Sigma |
| A | 6 | 16 | 1260038 | 8283.46 | 765 | 748 | 152.0 |
| A | 5 | 16 | 55671 | 361.28 | 765 | 748 | 152.0 |
| A | 0 | 226 | 6762 | 39.56 | 765 | 748 | 152.0 |
| B | 7 | 220 | 87598 | 608.87 | 758 | 738 | 142.7 |
| B | 0 | 228 | 44209 | 304.72 | 758 | 738 | 142.7 |
| B | 0 | 219 | 17978 | 120.85 | 758 | 738 | 142.7 |
| C | 14 | 238 | 116593 | 693.49 | 726 | 729 | 167.1 |
| C | 9 | 54 | 14768 | 84.03 | 726 | 729 | 167.1 |
| C | 7 | 247 | 9414 | 51.98 | 726 | 729 | 167.1 |
| D | 1 | 52 | 215232 | 1203.64 | 744 | 723 | 178.2 |
| D | 2 | 234 | 28036 | 153.26 | 744 | 723 | 178.2 |
| D | 7 | 38 | 20925 | 113.36 | 744 | 723 | 178.2 |
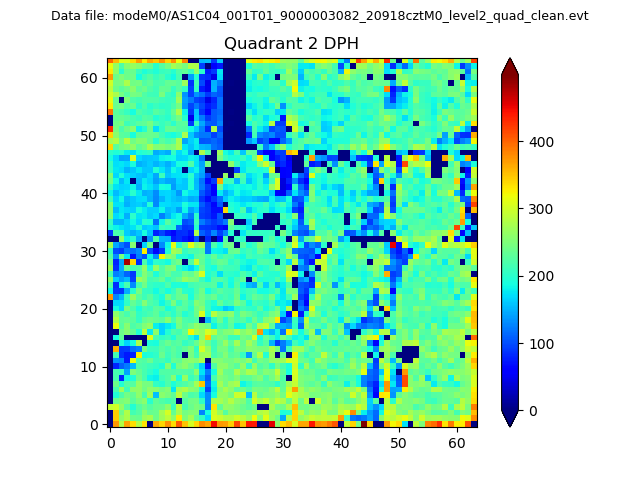
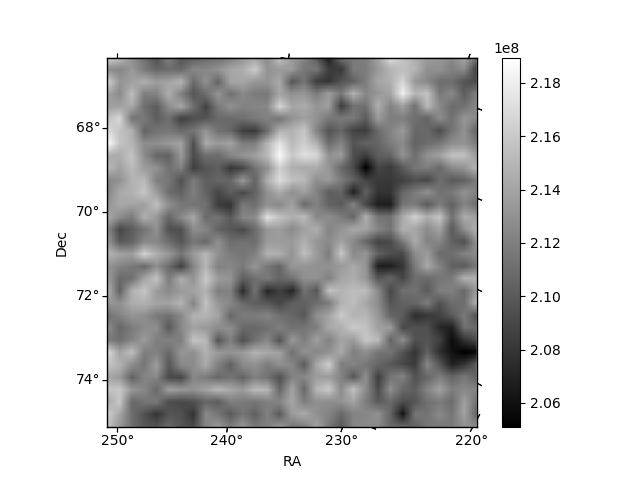
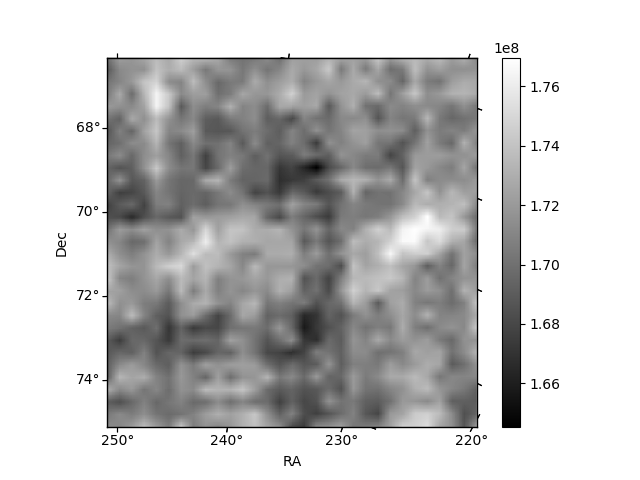
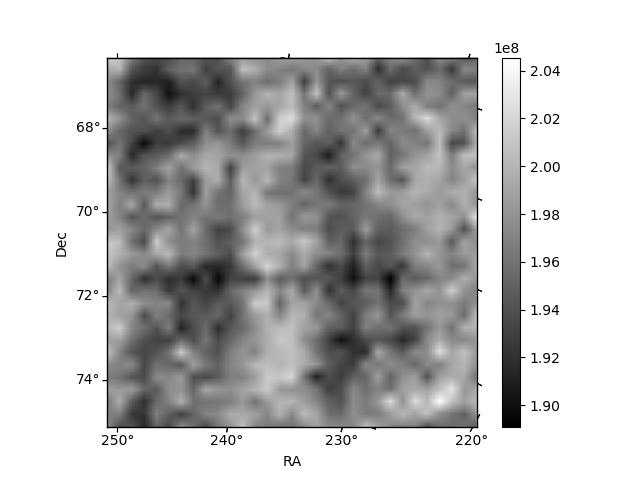
Histogram calculated using DETX and DETY for each event in the final _common_clean file
| Quadrant A | 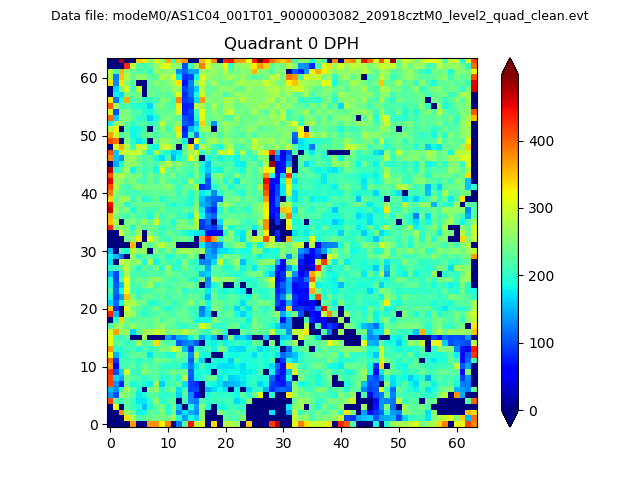 |
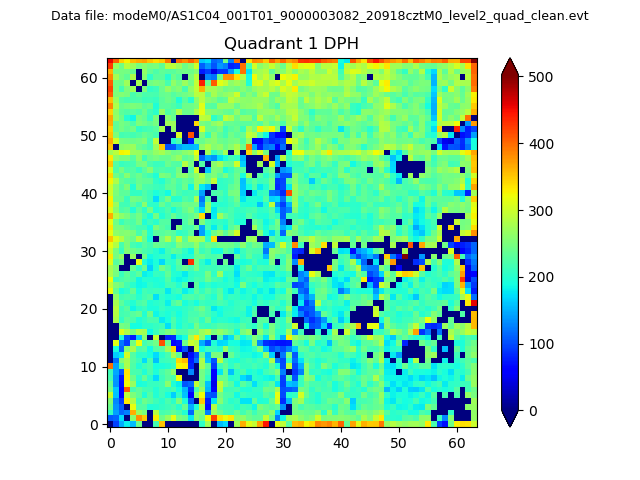 |
Quadrant B |
|---|---|---|---|
| Quadrant D | 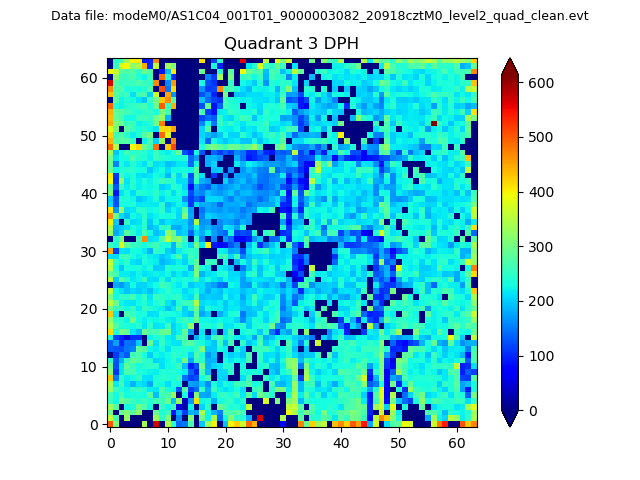 |
 |
Quadrant C |
| Plot type | Count rate plots | Images |
|---|---|---|
| Comparison with Poisson distribution Blue bars denote a histogram of data divided into 1 sec bins. Red curve is a Poisson curve with rate = median count rate of data. |
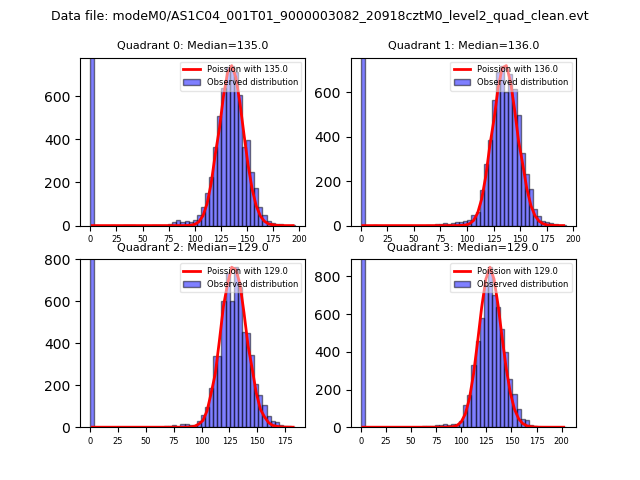 |
 |
| Quadrant-wise count rates Data is divided into 100 sec bins |
 |
|
| Module-wise count rates for Quadrant A Data is divided into 100 sec bins |
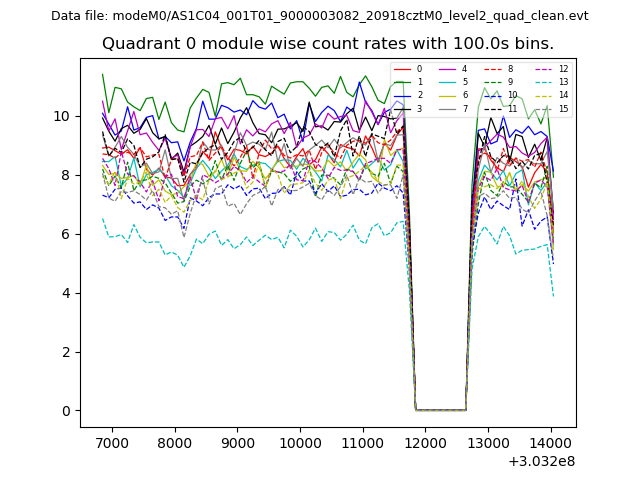 |
 |
| Module-wise count rates for Quadrant B Data is divided into 100 sec bins |
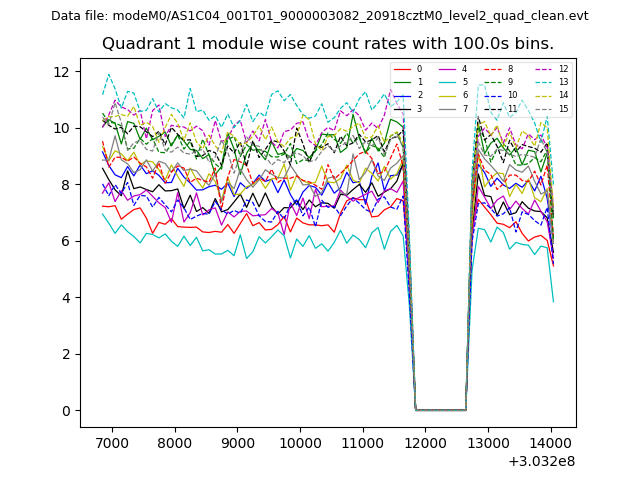 |
 |
| Module-wise count rates for Quadrant C Data is divided into 100 sec bins |
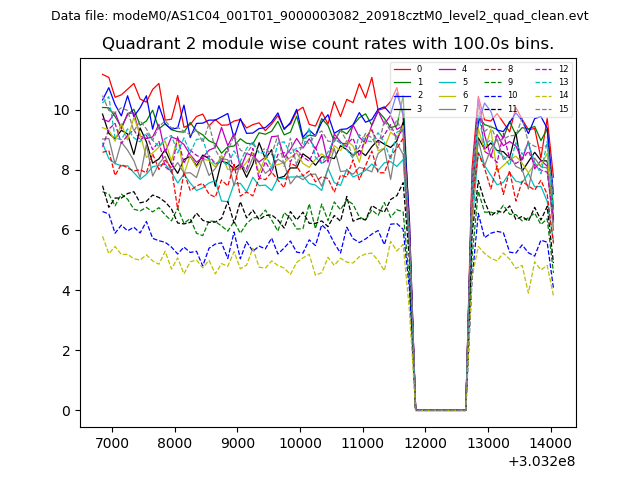 |
 |
| Module-wise count rates for Quadrant D Data is divided into 100 sec bins |
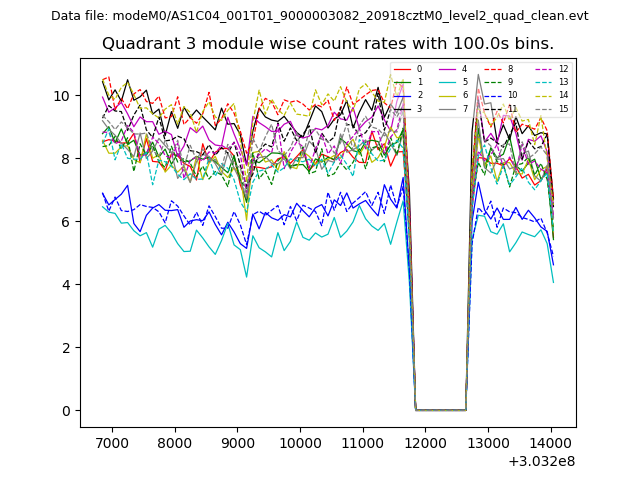 |
 |
| Parameter | Plot |
|---|---|
| CZT HV Monitor | 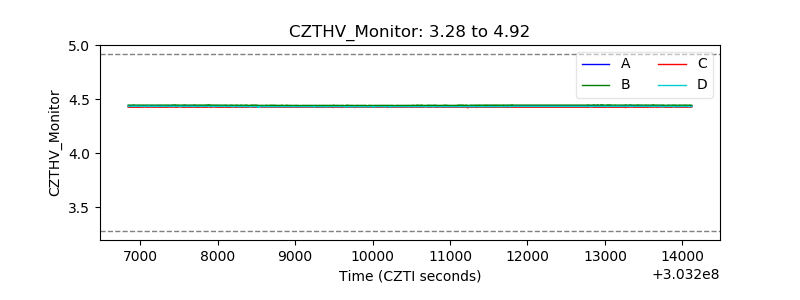 |
| D_VDD |  |
| Temperature 1 | 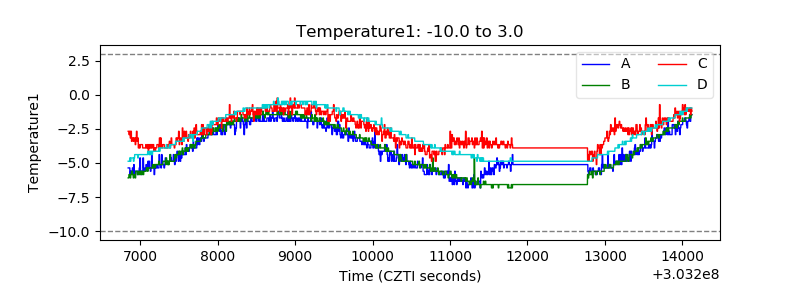 |
| Veto HV Monitor | 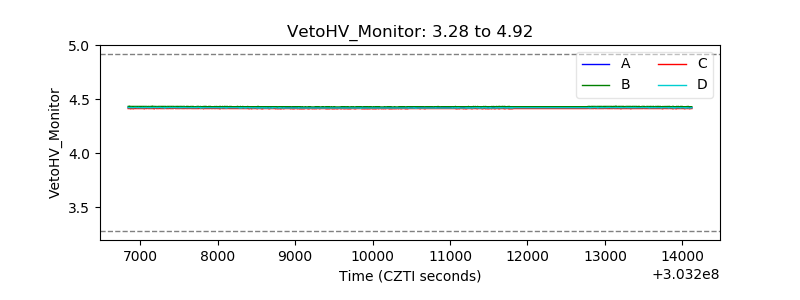 |
| Veto LLD | 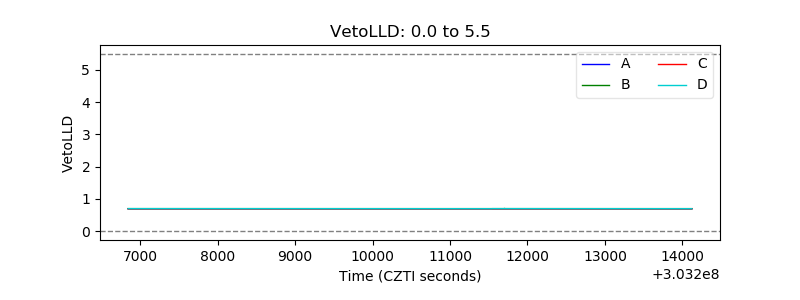 |
| Alpha Counter | 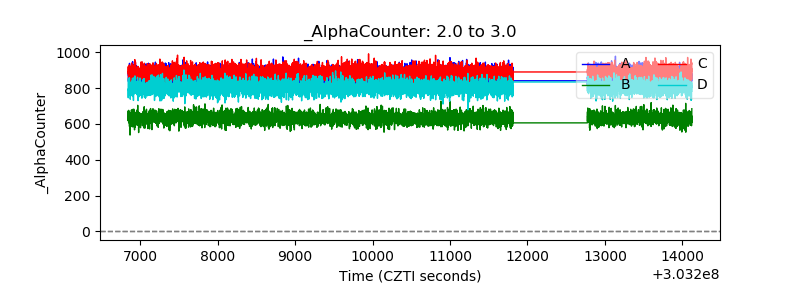 |
| _CPM_Rate | 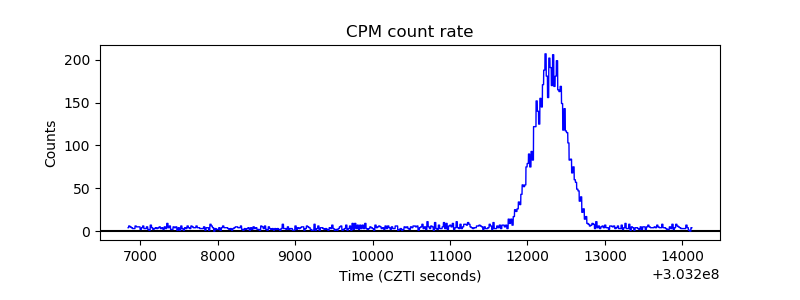 |
| CZT Counter | 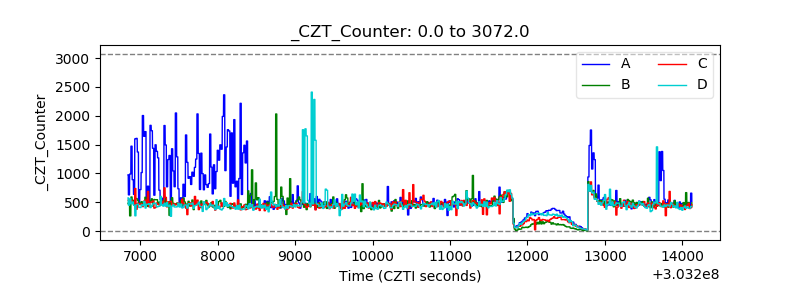 |
| +2.5 Volts monitor |  |
| +5 Volts monitor |  |
| _ROLL_ROT | 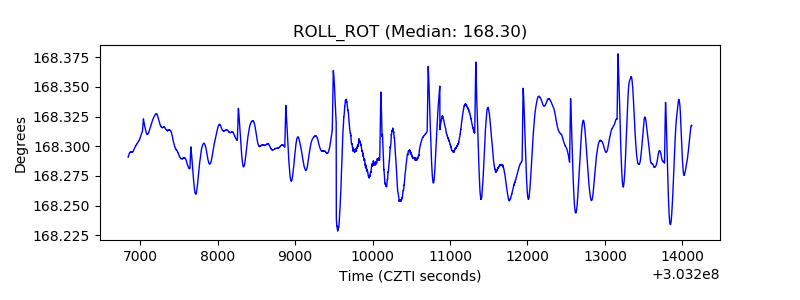 |
| _Roll_DEC | 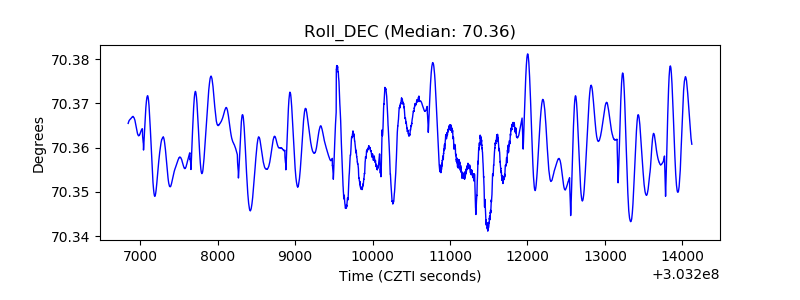 |
| _Roll_RA |  |
| Veto Counter | 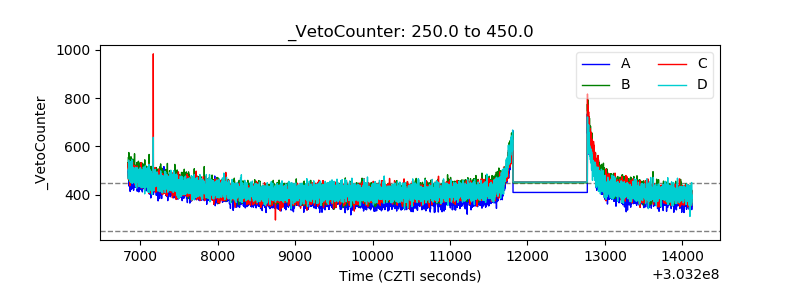 |