| Param | Original file | Final file |
|---|---|---|
| Filename | modeM0/AS1C04_001T01_9000003082_20919cztM0_level2.evt | modeM0/AS1C04_001T01_9000003082_20919cztM0_level2_quad_clean.evt |
| Size (bytes) | 505,779,840 | 134,412,480 |
| Size | 482.3 MB | 128.2 MB |
| Events in quadrant A | 4,711,737 | 906,135 |
| Events in quadrant B | 3,672,017 | 916,098 |
| Events in quadrant C | 3,271,669 | 877,289 |
| Events in quadrant D | 3,183,776 | 880,904 |
| Mode SS | |||
|---|---|---|---|
| Quadrant | BADHDUFLAG | Total packets | Discarded packets |
| A | 0 | 144 | 0 |
| B | 0 | 144 | 0 |
| C | 0 | 144 | 0 |
| D | 0 | 144 | 0 |
| Mode M9 | |||
|---|---|---|---|
| Quadrant | BADHDUFLAG | Total packets | Discarded packets |
| A | 0 | 6 | 0 |
| B | 0 | 6 | 0 |
| C | 0 | 6 | 0 |
| D | 0 | 6 | 0 |
| Mode M0 | |||
|---|---|---|---|
| Quadrant | BADHDUFLAG | Total packets | Discarded packets |
| A | 0 | 18746 | 1 |
| B | 0 | 15487 | 1 |
| C | 0 | 14402 | 1 |
| D | 0 | 14439 | 1 |
| Quadrant | Total seconds | Saturated seconds | Saturation percentage |
|---|---|---|---|
| A | 7049 | 214 | 3.035892% |
| B | 7050 | 124 | 1.758865% |
| C | 7050 | 109 | 1.546099% |
| D | 7050 | 89 | 1.262411% |
Noise dominated data is calculated using 1-second bins in cleaned event files. If a bin has >2000 counts, and if more than 50% of those come from <1% of pixels, then it is considered to be noise-dominated and hence unusable.
| Quadrant | # 1 sec bins | Bins with >0 counts | Bins with >2000 counts | High rate bins dominated by noise | Noise dominated (total time) | Noise dominated (detector-on time) | Marked lightcurve |
|---|---|---|---|---|---|---|---|
| A | 7574 | 7051 | 46 | 46 | 0.61% | 0.65% |  |
| B | 7575 | 7052 | 27 | 27 | 0.36% | 0.38% | 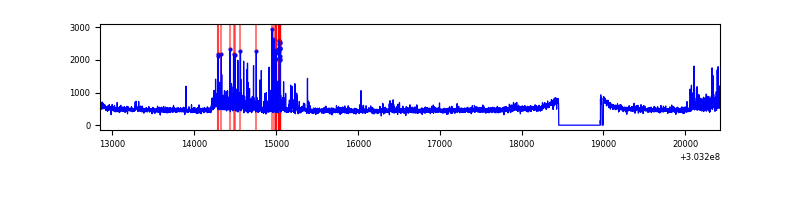 |
| C | 7575 | 7052 | 0 | 0 | 0.00% | 0.00% | 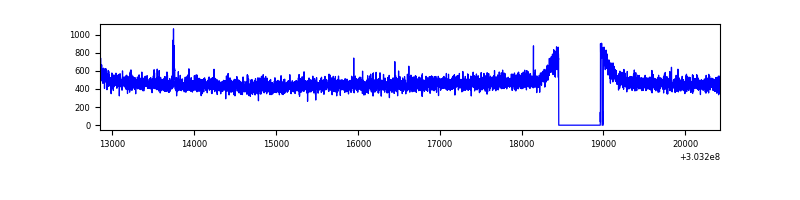 |
| D | 7575 | 7052 | 3 | 3 | 0.04% | 0.04% | 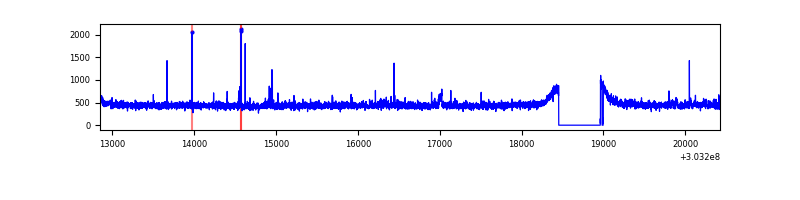 |
Top three noisy pixels from each quadrant. If the there are fewer than three noisy pixels in the level2.evt file, extra rows are filled as -1
| Pixel properties | Quadrant properties | ||||||
|---|---|---|---|---|---|---|---|
| Quadrant | DetID | PixID | Counts | Sigma | Mean | Median | Sigma |
| A | 6 | 16 | 1466136 | 8674.88 | 842 | 823 | 168.9 |
| A | 0 | 226 | 7490 | 39.47 | 842 | 823 | 168.9 |
| A | 3 | 137 | 6773 | 35.22 | 842 | 823 | 168.9 |
| B | 7 | 220 | 297446 | 1883.36 | 832 | 812 | 157.5 |
| B | 0 | 228 | 27154 | 167.25 | 832 | 812 | 157.5 |
| B | 0 | 219 | 25986 | 159.83 | 832 | 812 | 157.5 |
| C | 14 | 238 | 127649 | 685.27 | 801 | 804 | 185.1 |
| C | 5 | 4 | 7824 | 37.92 | 801 | 804 | 185.1 |
| C | 13 | 61 | 5590 | 25.86 | 801 | 804 | 185.1 |
| D | 2 | 234 | 33718 | 165.3 | 823 | 799 | 199.1 |
| D | 1 | 52 | 33464 | 164.02 | 823 | 799 | 199.1 |
| D | 2 | 153 | 12871 | 60.62 | 823 | 799 | 199.1 |
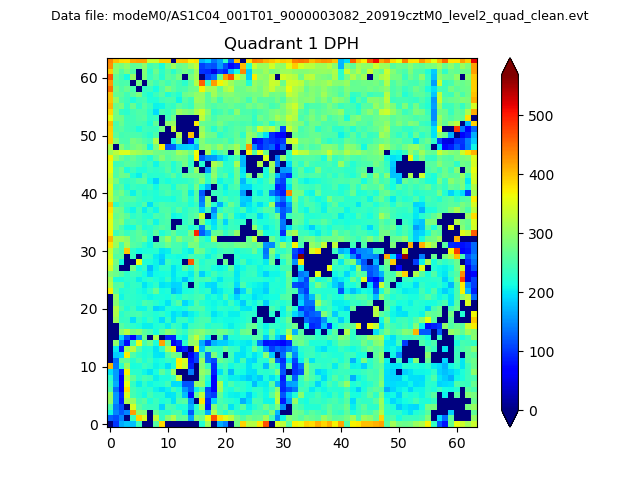
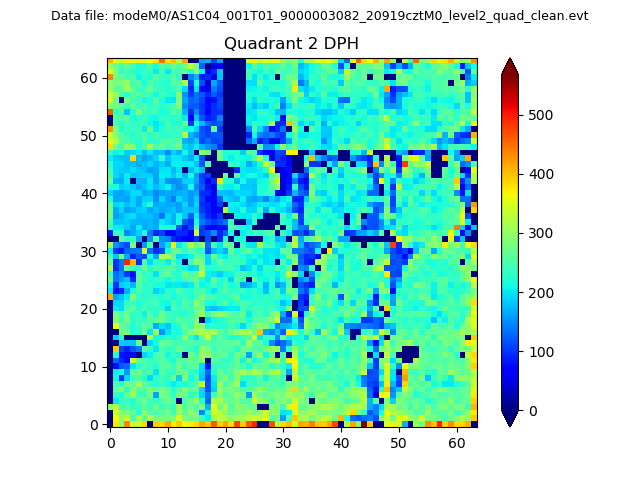
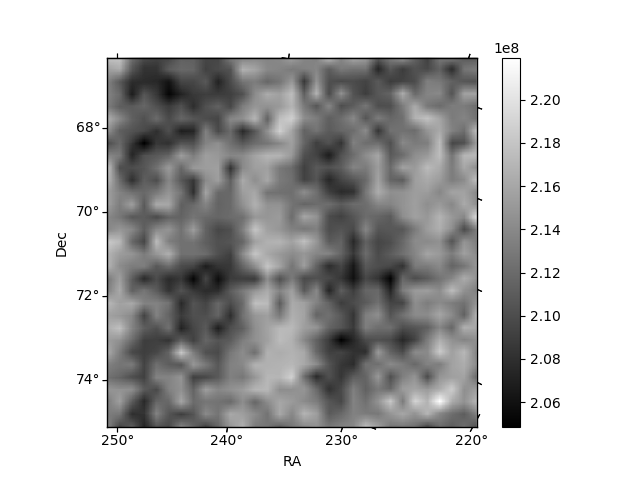
Histogram calculated using DETX and DETY for each event in the final _common_clean file
| Quadrant A | 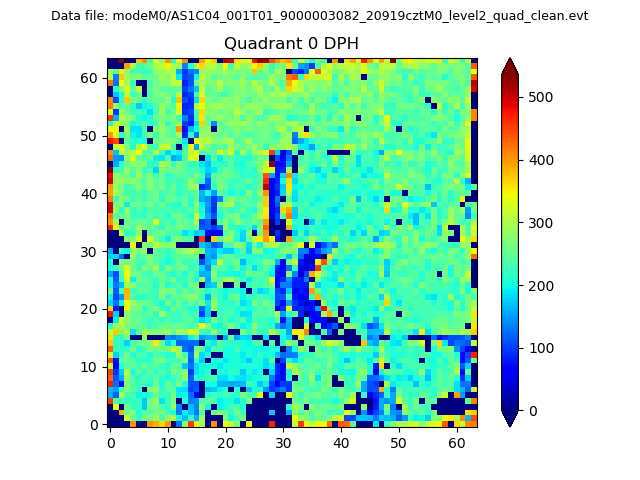 |
 |
Quadrant B |
|---|---|---|---|
| Quadrant D | 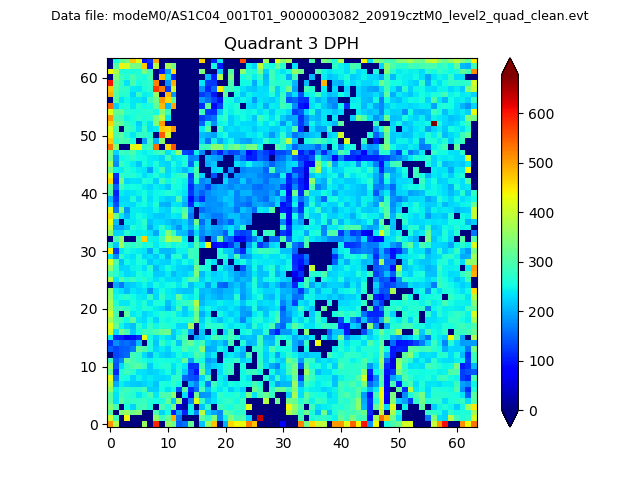 |
 |
Quadrant C |
| Plot type | Count rate plots | Images |
|---|---|---|
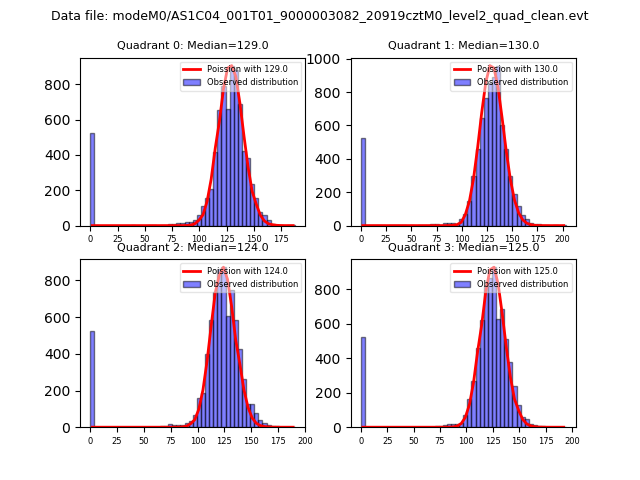
| Comparison with Poisson distribution Blue bars denote a histogram of data divided into 1 sec bins. Red curve is a Poisson curve with rate = median count rate of data. |
 |
 |
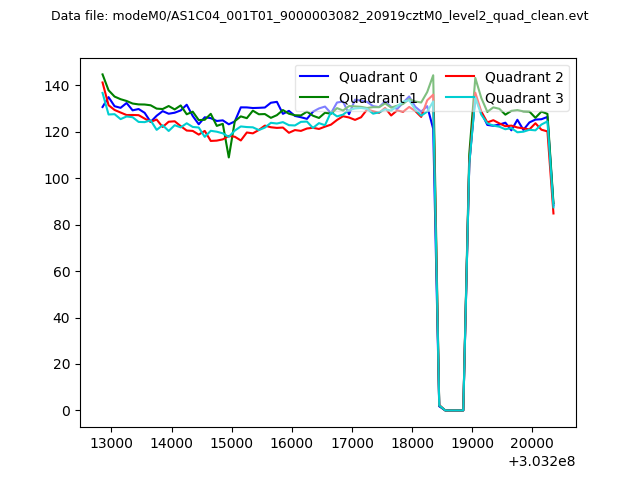
| Quadrant-wise count rates Data is divided into 100 sec bins |
 |
|
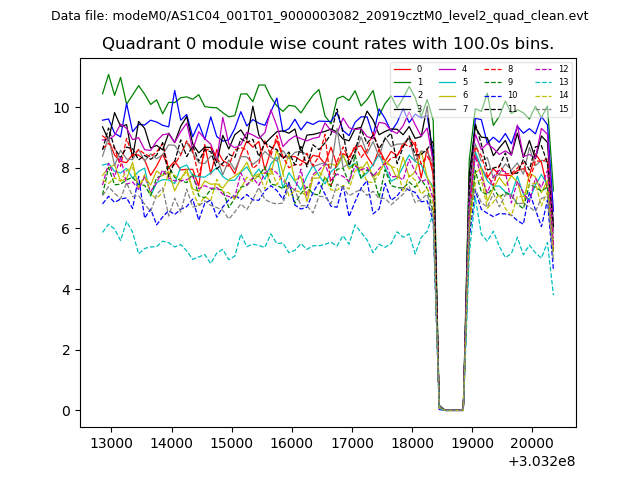
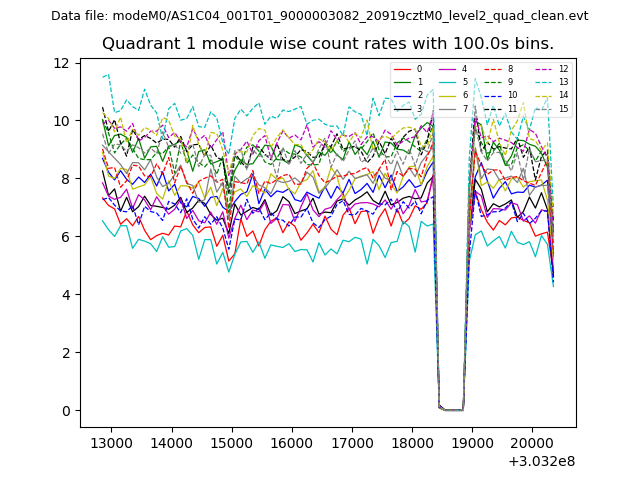
| Module-wise count rates for Quadrant A Data is divided into 100 sec bins |
 |
 |
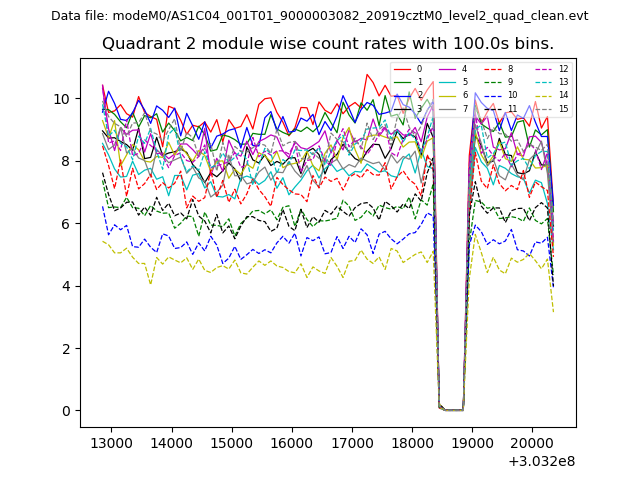
| Module-wise count rates for Quadrant B Data is divided into 100 sec bins |
 |
 |
| Module-wise count rates for Quadrant C Data is divided into 100 sec bins |
 |
 |
| Module-wise count rates for Quadrant D Data is divided into 100 sec bins |
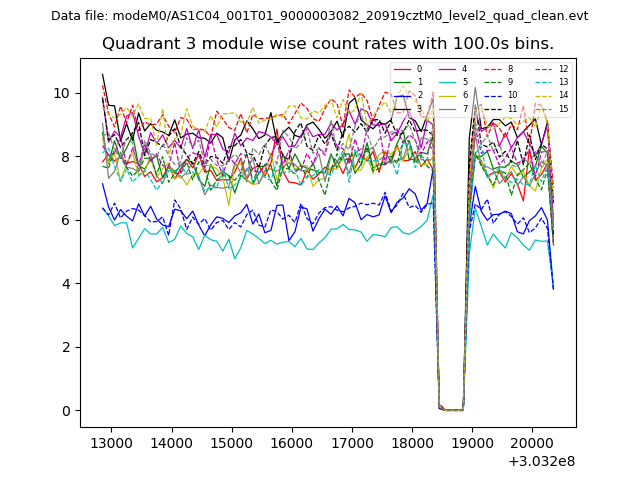 |
 |
| Parameter | Plot |
|---|---|
| CZT HV Monitor | 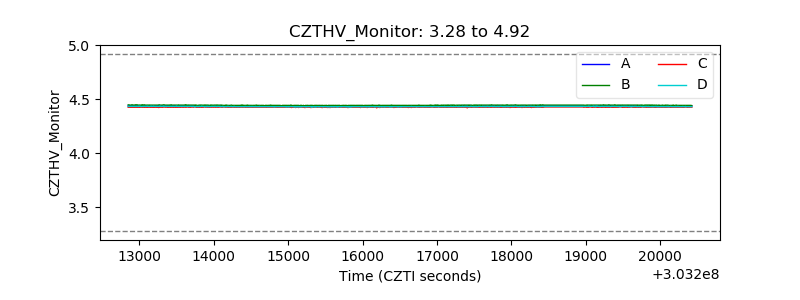 |
| D_VDD | 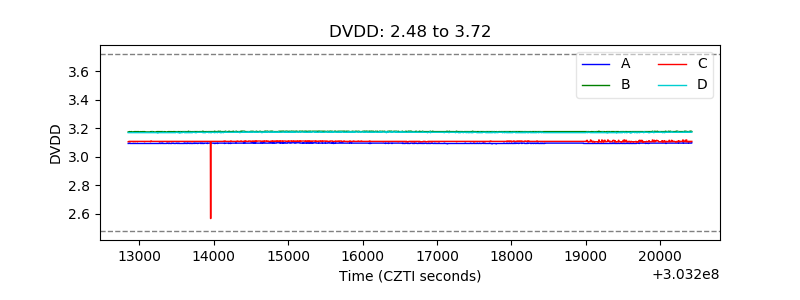 |
| Temperature 1 | 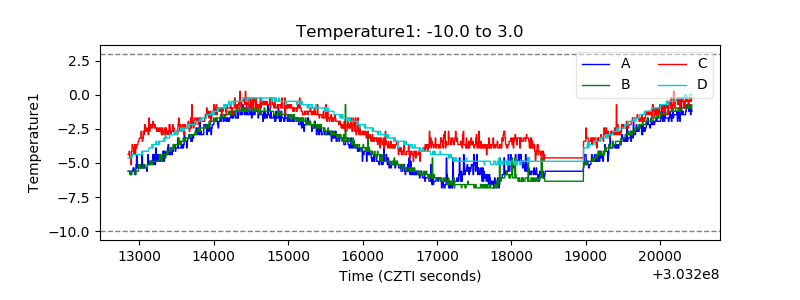 |
| Veto HV Monitor |  |
| Veto LLD | 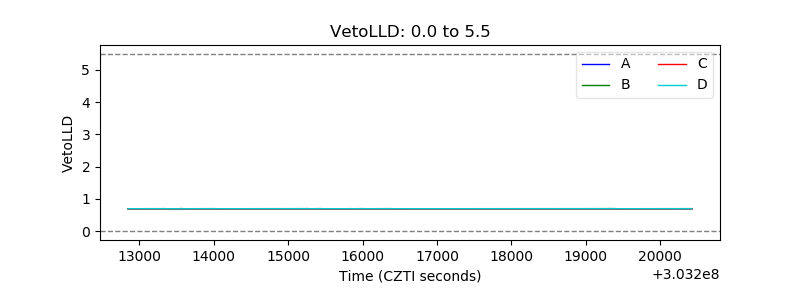 |
| Alpha Counter | 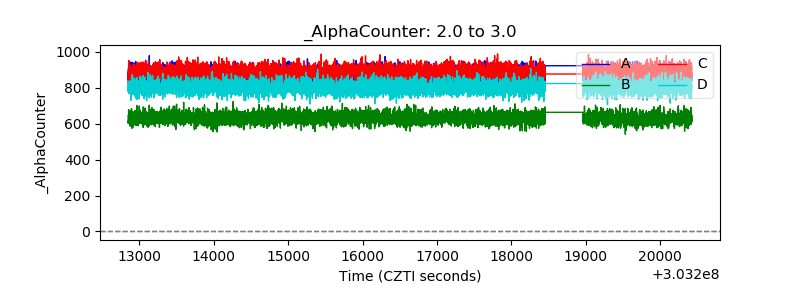 |
| _CPM_Rate | 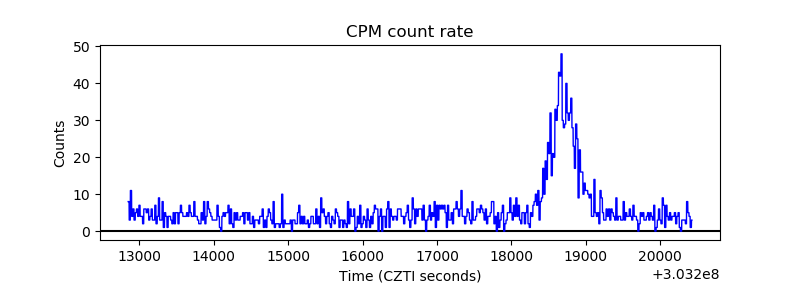 |
| CZT Counter | 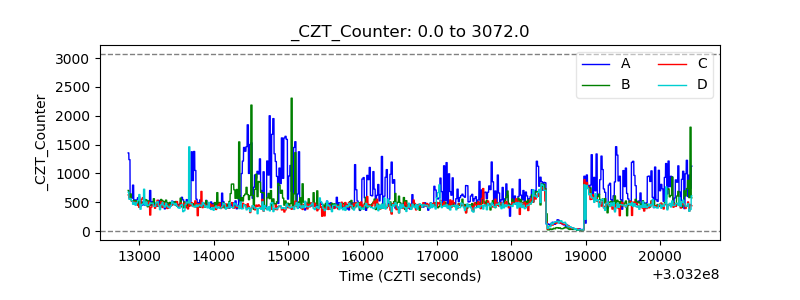 |
| +2.5 Volts monitor |  |
| +5 Volts monitor |  |
| _ROLL_ROT | 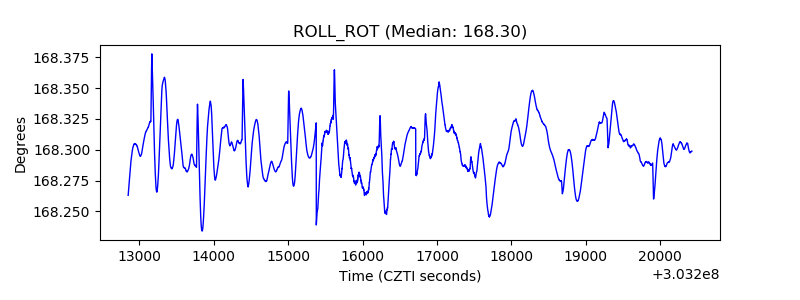 |
| _Roll_DEC | 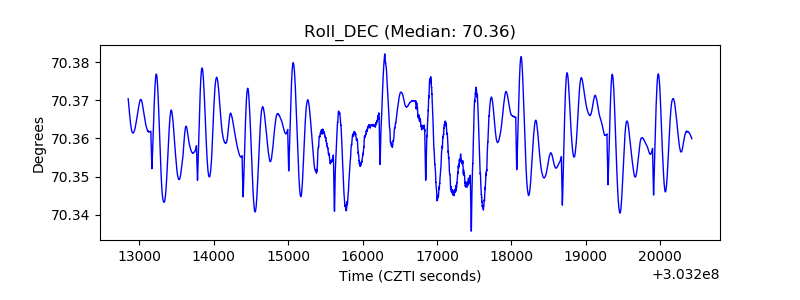 |
| _Roll_RA | 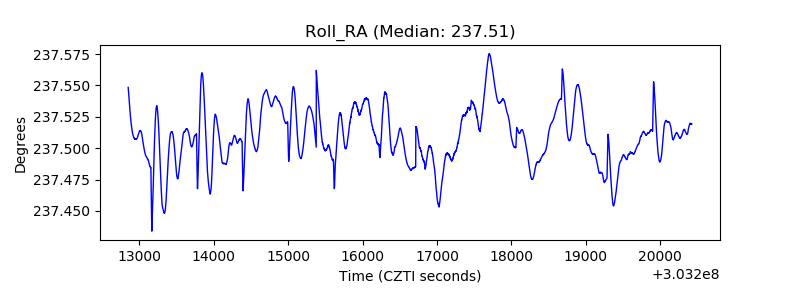 |
| Veto Counter | 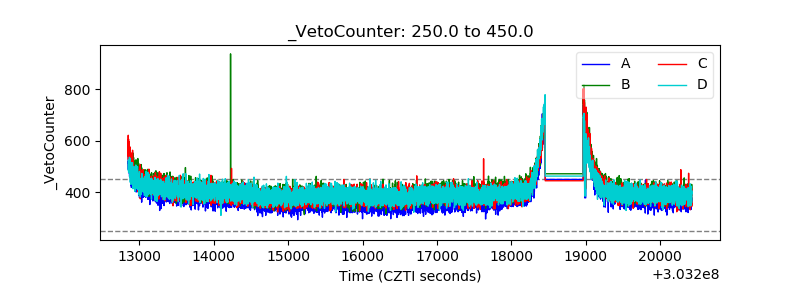 |