| Param | Original file | Final file |
|---|---|---|
| Filename | modeM0/AS1C04_001T01_9000003082_20920cztM0_level2.evt | modeM0/AS1C04_001T01_9000003082_20920cztM0_level2_quad_clean.evt |
| Size (bytes) | 526,472,640 | 134,363,520 |
| Size | 502.1 MB | 128.1 MB |
| Events in quadrant A | 4,066,677 | 913,668 |
| Events in quadrant B | 4,103,858 | 904,423 |
| Events in quadrant C | 3,351,619 | 874,658 |
| Events in quadrant D | 3,933,993 | 876,016 |
| Mode SS | |||
|---|---|---|---|
| Quadrant | BADHDUFLAG | Total packets | Discarded packets |
| A | 0 | 148 | 0 |
| B | 0 | 148 | 0 |
| C | 0 | 148 | 0 |
| D | 0 | 148 | 0 |
| Mode M9 | |||
|---|---|---|---|
| Quadrant | BADHDUFLAG | Total packets | Discarded packets |
| A | 0 | 1 | 0 |
| B | 0 | 1 | 0 |
| C | 0 | 1 | 0 |
| D | 0 | 1 | 0 |
| Mode M0 | |||
|---|---|---|---|
| Quadrant | BADHDUFLAG | Total packets | Discarded packets |
| A | 0 | 16913 | 1 |
| B | 0 | 16685 | 1 |
| C | 0 | 14776 | 1 |
| D | 0 | 16747 | 1 |
| Quadrant | Total seconds | Saturated seconds | Saturation percentage |
|---|---|---|---|
| A | 7181 | 144 | 2.005292% |
| B | 7182 | 267 | 3.717627% |
| C | 7182 | 179 | 2.492342% |
| D | 7182 | 124 | 1.726539% |
Noise dominated data is calculated using 1-second bins in cleaned event files. If a bin has >2000 counts, and if more than 50% of those come from <1% of pixels, then it is considered to be noise-dominated and hence unusable.
| Quadrant | # 1 sec bins | Bins with >0 counts | Bins with >2000 counts | High rate bins dominated by noise | Noise dominated (total time) | Noise dominated (detector-on time) | Marked lightcurve |
|---|---|---|---|---|---|---|---|
| A | 7366 | 7182 | 22 | 22 | 0.30% | 0.31% | 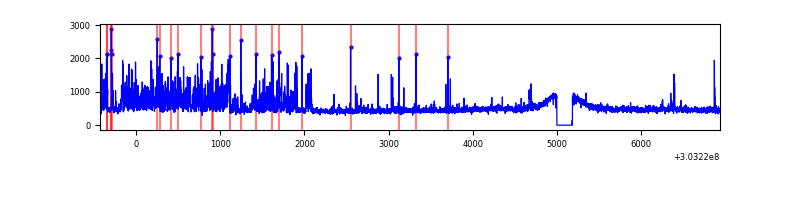 |
| B | 7367 | 7183 | 102 | 102 | 1.38% | 1.42% | 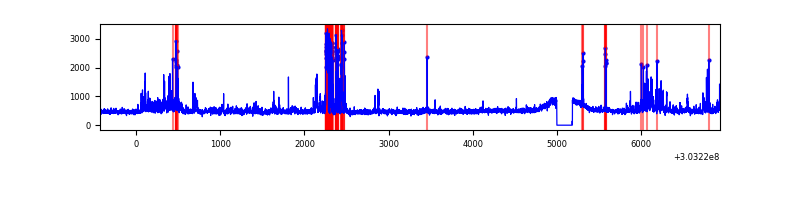 |
| C | 7367 | 7183 | 1 | 1 | 0.01% | 0.01% |  |
| D | 7367 | 7183 | 17 | 17 | 0.23% | 0.24% | 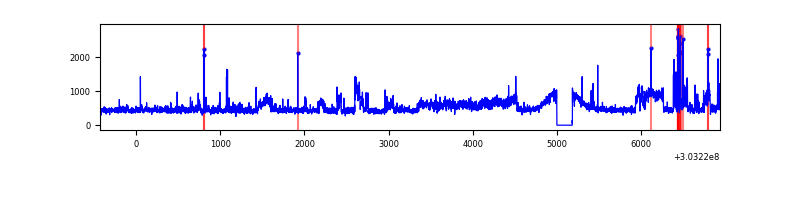 |
Top three noisy pixels from each quadrant. If the there are fewer than three noisy pixels in the level2.evt file, extra rows are filled as -1
| Pixel properties | Quadrant properties | ||||||
|---|---|---|---|---|---|---|---|
| Quadrant | DetID | PixID | Counts | Sigma | Mean | Median | Sigma |
| A | 6 | 16 | 735814 | 4242.39 | 860 | 840 | 173.2 |
| A | 5 | 16 | 19669 | 108.68 | 860 | 840 | 173.2 |
| A | 0 | 226 | 7539 | 38.67 | 860 | 840 | 173.2 |
| B | 3 | 64 | 313131 | 1939.81 | 844 | 820 | 161.0 |
| B | 7 | 220 | 225322 | 1394.42 | 844 | 820 | 161.0 |
| B | 0 | 219 | 60005 | 367.61 | 844 | 820 | 161.0 |
| C | 14 | 238 | 128821 | 673.26 | 818 | 824 | 190.1 |
| C | 8 | 128 | 8664 | 41.24 | 818 | 824 | 190.1 |
| C | 9 | 54 | 6467 | 29.68 | 818 | 824 | 190.1 |
| D | 1 | 20 | 579487 | 2864.76 | 842 | 818 | 202.0 |
| D | 1 | 52 | 108228 | 531.74 | 842 | 818 | 202.0 |
| D | 2 | 234 | 32474 | 156.72 | 842 | 818 | 202.0 |
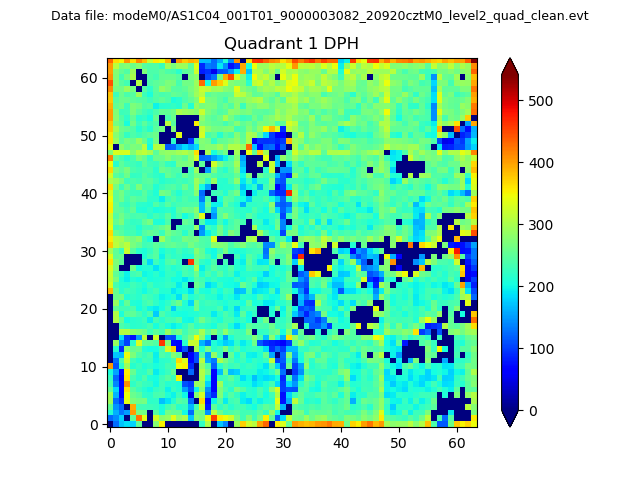
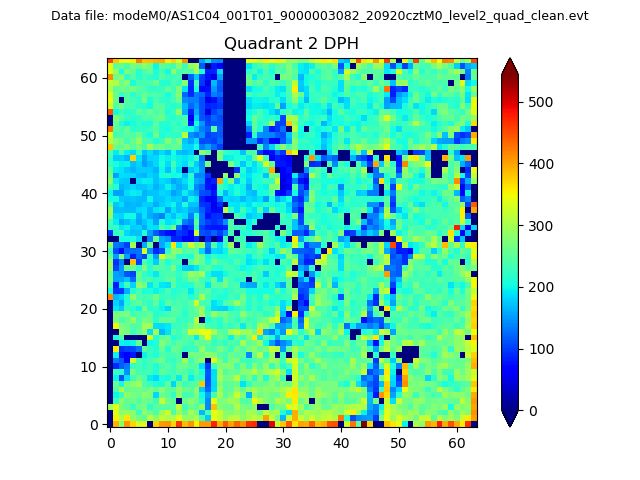
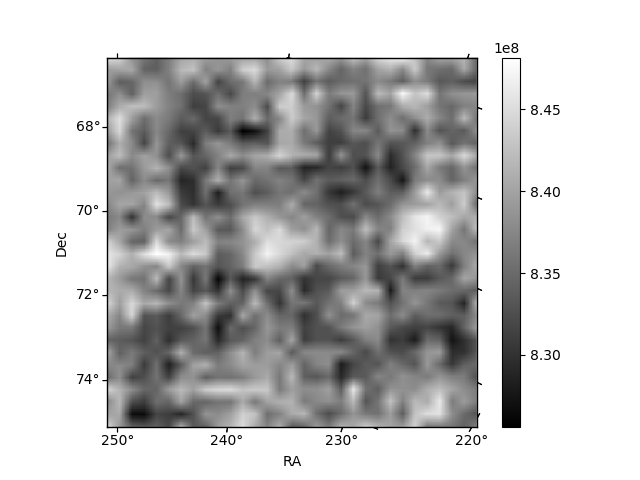
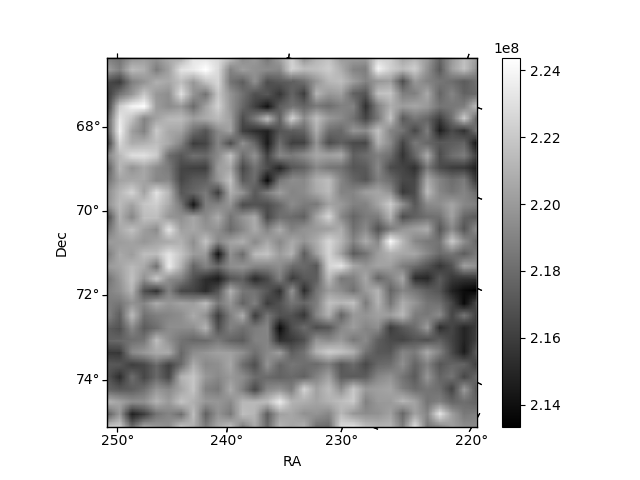
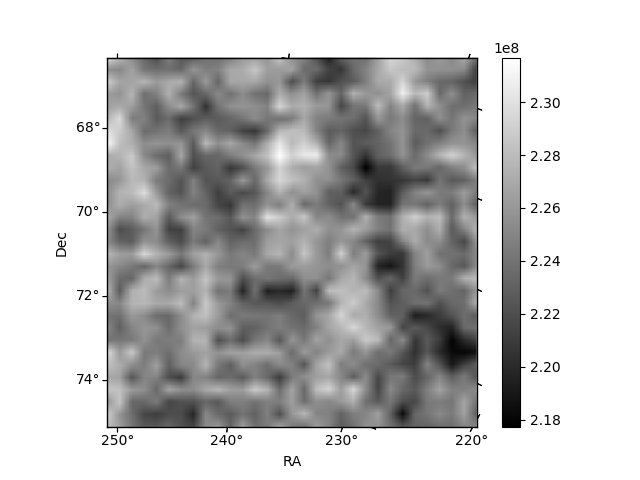
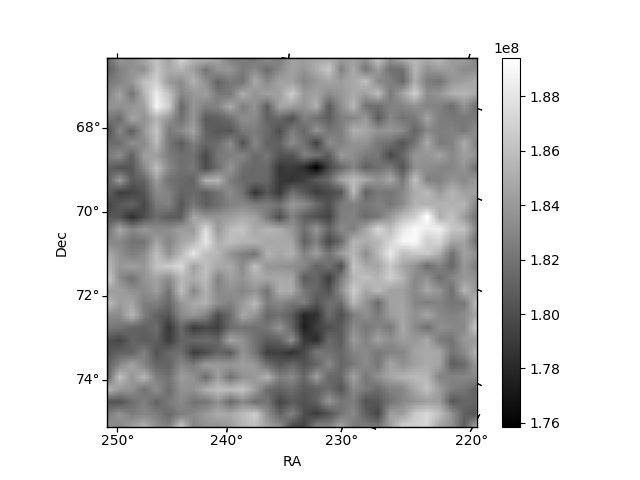
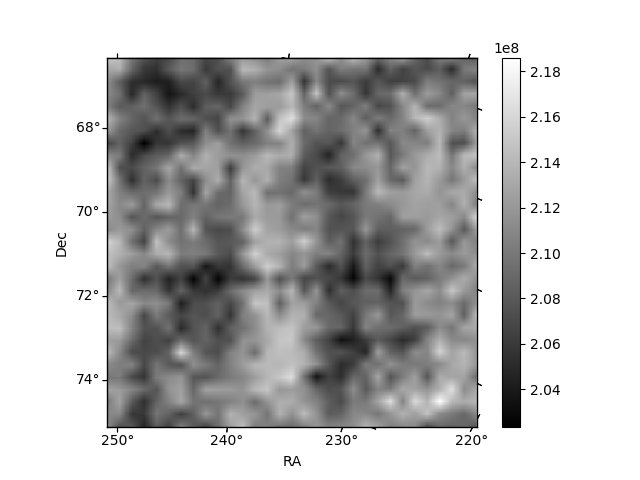
Histogram calculated using DETX and DETY for each event in the final _common_clean file
| Quadrant A | 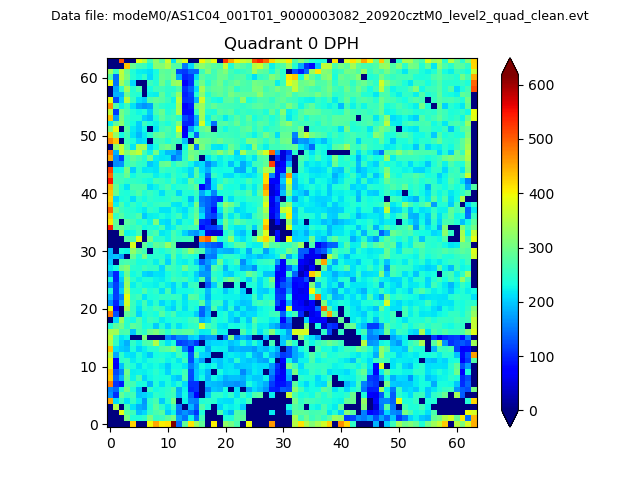 |
 |
Quadrant B |
|---|---|---|---|
| Quadrant D | 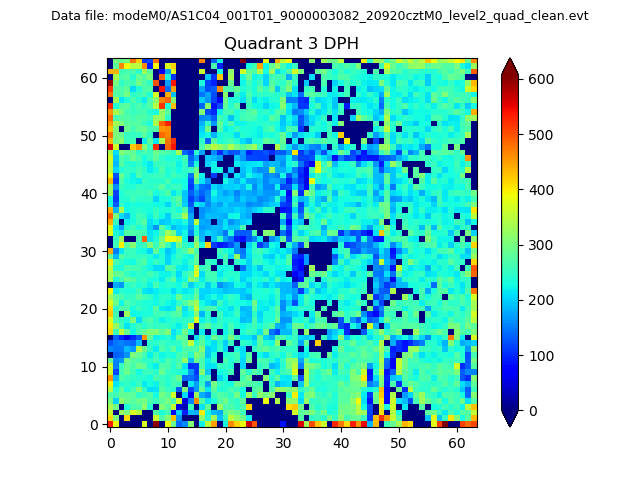 |
 |
Quadrant C |
| Plot type | Count rate plots | Images |
|---|---|---|
| Comparison with Poisson distribution Blue bars denote a histogram of data divided into 1 sec bins. Red curve is a Poisson curve with rate = median count rate of data. |
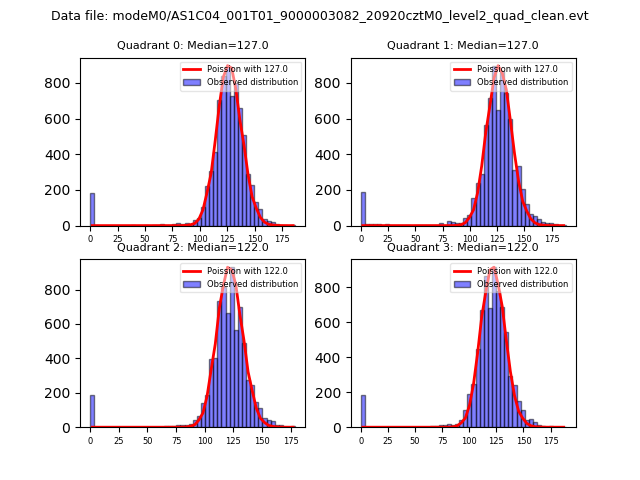 |
 |
| Quadrant-wise count rates Data is divided into 100 sec bins |
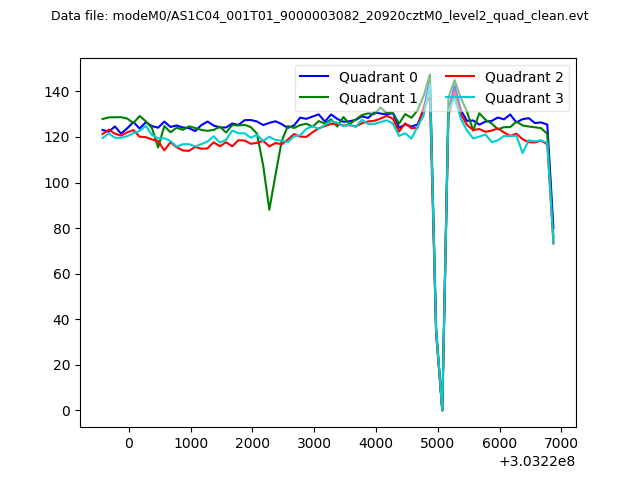 |
|
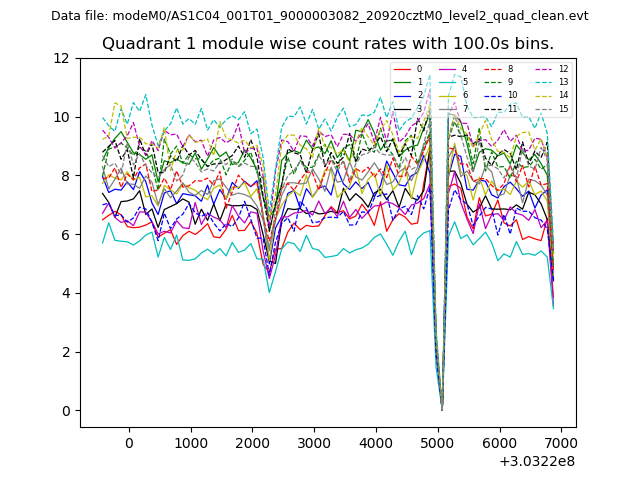
| Module-wise count rates for Quadrant A Data is divided into 100 sec bins |
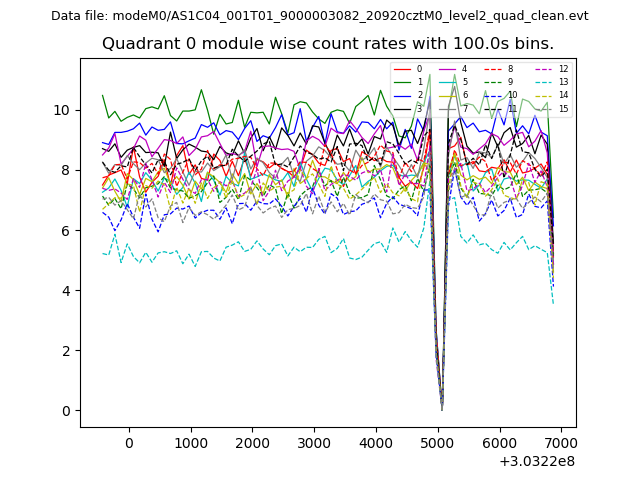 |
 |
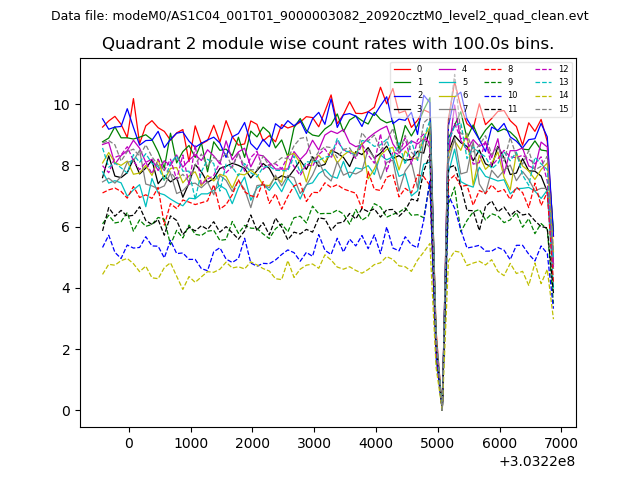
| Module-wise count rates for Quadrant B Data is divided into 100 sec bins |
 |
 |
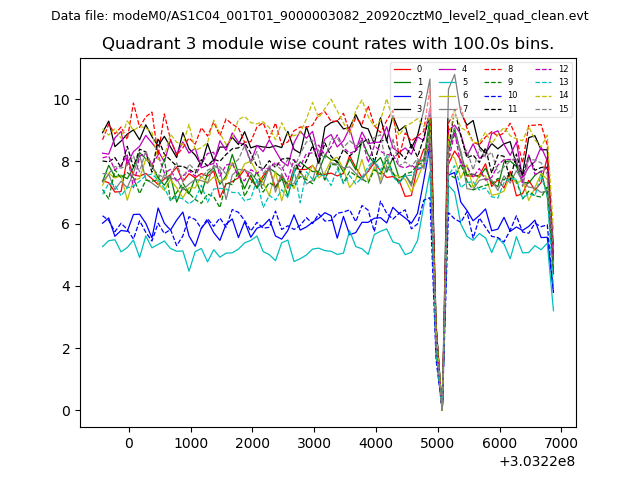
| Module-wise count rates for Quadrant C Data is divided into 100 sec bins |
 |
 |
| Module-wise count rates for Quadrant D Data is divided into 100 sec bins |
 |
 |
| Parameter | Plot |
|---|---|
| CZT HV Monitor | 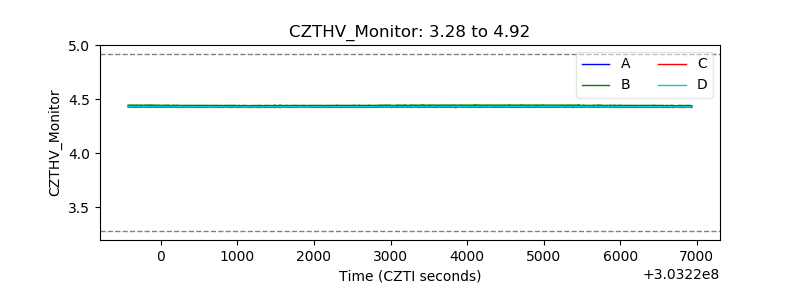 |
| D_VDD | 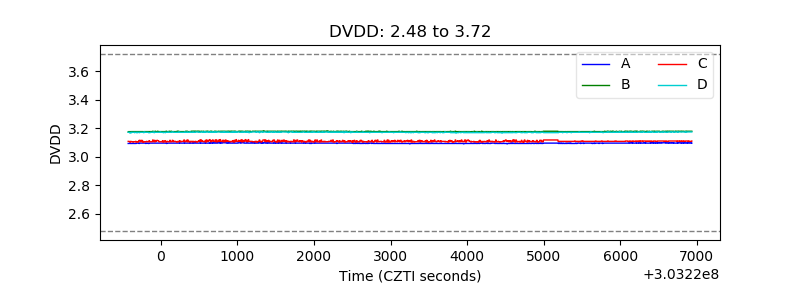 |
| Temperature 1 | 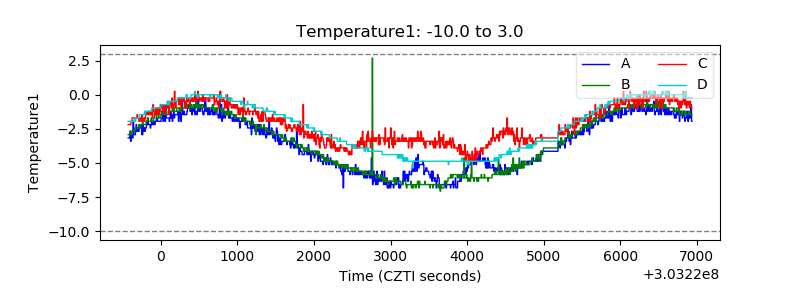 |
| Veto HV Monitor |  |
| Veto LLD | 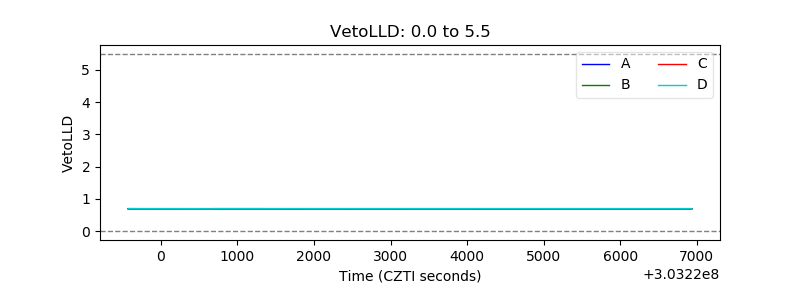 |
| Alpha Counter | 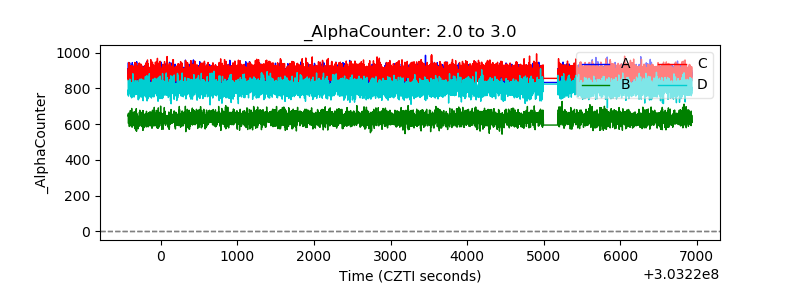 |
| _CPM_Rate | 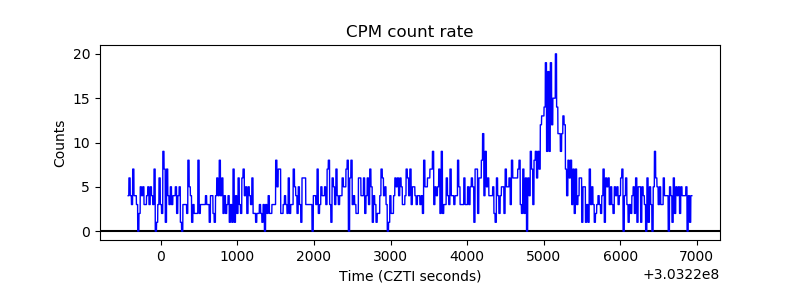 |
| CZT Counter | 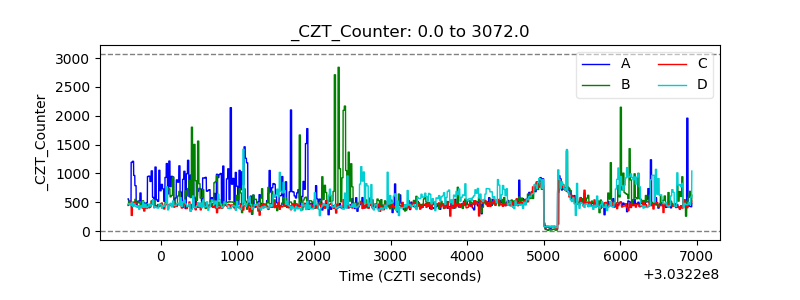 |
| +2.5 Volts monitor |  |
| +5 Volts monitor |  |
| _ROLL_ROT | 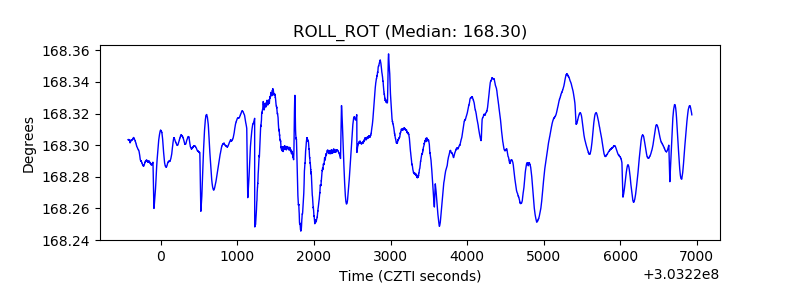 |
| _Roll_DEC | 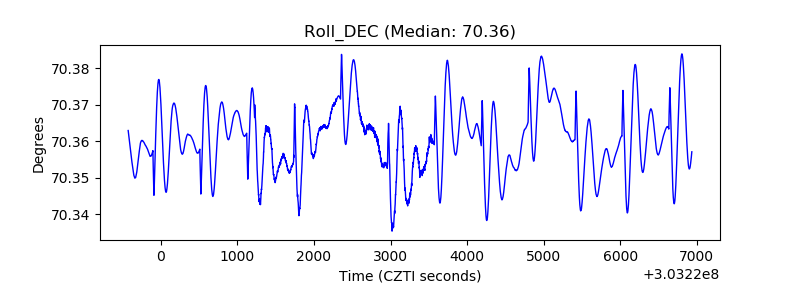 |
| _Roll_RA | 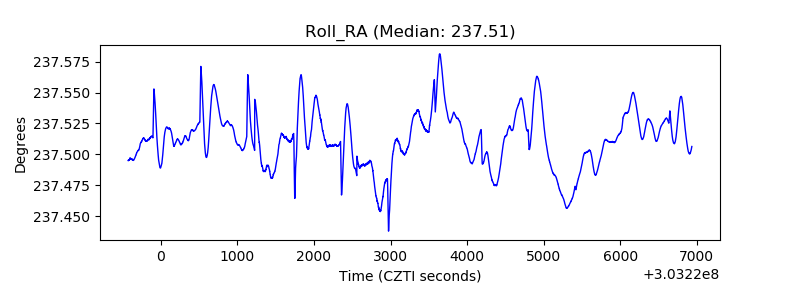 |
| Veto Counter | 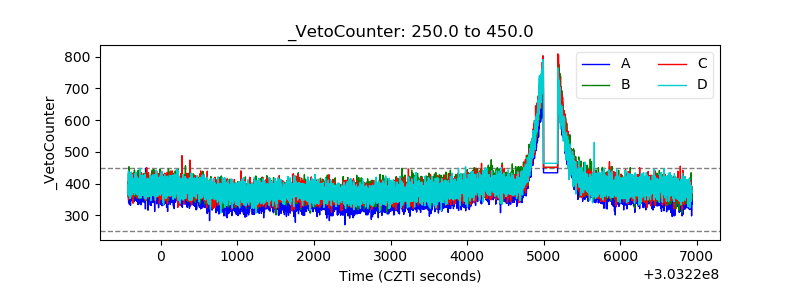 |