| Param | Original file | Final file |
|---|---|---|
| Filename | modeM0/AS1C04_001T01_9000003082_20921cztM0_level2.evt | modeM0/AS1C04_001T01_9000003082_20921cztM0_level2_quad_clean.evt |
| Size (bytes) | 481,953,600 | 125,311,680 |
| Size | 459.6 MB | 119.5 MB |
| Events in quadrant A | 3,367,634 | 854,634 |
| Events in quadrant B | 3,674,021 | 842,730 |
| Events in quadrant C | 3,128,233 | 815,370 |
| Events in quadrant D | 3,968,203 | 812,780 |
| Mode SS | |||
|---|---|---|---|
| Quadrant | BADHDUFLAG | Total packets | Discarded packets |
| A | 0 | 136 | 0 |
| B | 0 | 136 | 0 |
| C | 0 | 136 | 0 |
| D | 0 | 136 | 0 |
| Mode M9 | |||
|---|---|---|---|
| Quadrant | BADHDUFLAG | Total packets | Discarded packets |
| A | 0 | 3 | 0 |
| B | 0 | 3 | 0 |
| C | 0 | 3 | 0 |
| D | 0 | 3 | 0 |
| Mode M0 | |||
|---|---|---|---|
| Quadrant | BADHDUFLAG | Total packets | Discarded packets |
| A | 0 | 14601 | 1 |
| B | 0 | 15455 | 1 |
| C | 0 | 13842 | 1 |
| D | 0 | 16263 | 2 |
| Quadrant | Total seconds | Saturated seconds | Saturation percentage |
|---|---|---|---|
| A | 6742 | 108 | 1.601899% |
| B | 6743 | 160 | 2.372831% |
| C | 6743 | 140 | 2.076227% |
| D | 6742 | 167 | 2.477010% |
Noise dominated data is calculated using 1-second bins in cleaned event files. If a bin has >2000 counts, and if more than 50% of those come from <1% of pixels, then it is considered to be noise-dominated and hence unusable.
| Quadrant | # 1 sec bins | Bins with >0 counts | Bins with >2000 counts | High rate bins dominated by noise | Noise dominated (total time) | Noise dominated (detector-on time) | Marked lightcurve |
|---|---|---|---|---|---|---|---|
| A | 6987 | 6743 | 15 | 15 | 0.21% | 0.22% |  |
| B | 6988 | 6744 | 16 | 16 | 0.23% | 0.24% |  |
| C | 6988 | 6744 | 2 | 2 | 0.03% | 0.03% | 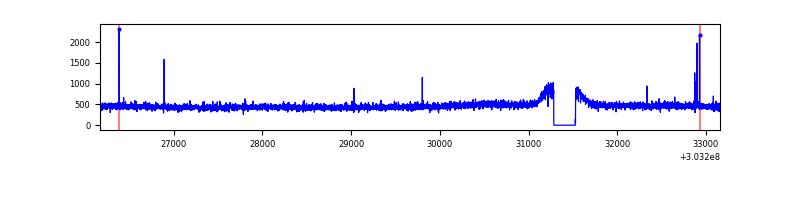 |
| D | 6987 | 6743 | 86 | 86 | 1.23% | 1.28% | 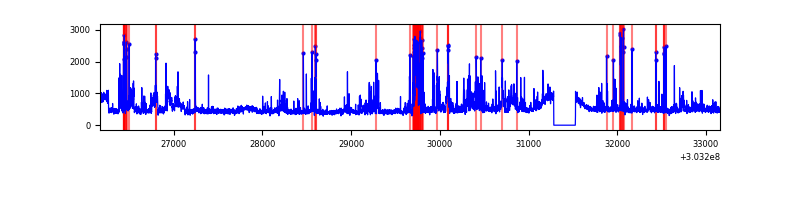 |
Top three noisy pixels from each quadrant. If the there are fewer than three noisy pixels in the level2.evt file, extra rows are filled as -1
| Pixel properties | Quadrant properties | ||||||
|---|---|---|---|---|---|---|---|
| Quadrant | DetID | PixID | Counts | Sigma | Mean | Median | Sigma |
| A | 5 | 16 | 176172 | 1076.76 | 802 | 783 | 162.9 |
| A | 15 | 174 | 103774 | 632.29 | 802 | 783 | 162.9 |
| A | 0 | 226 | 7006 | 38.2 | 802 | 783 | 162.9 |
| B | 7 | 220 | 237495 | 1567.79 | 793 | 771 | 151.0 |
| B | 4 | 216 | 91693 | 602.16 | 793 | 771 | 151.0 |
| B | 0 | 229 | 62560 | 409.22 | 793 | 771 | 151.0 |
| C | 14 | 238 | 119658 | 662.77 | 766 | 770 | 179.4 |
| C | 0 | 207 | 14274 | 75.28 | 766 | 770 | 179.4 |
| C | 13 | 61 | 5441 | 26.04 | 766 | 770 | 179.4 |
| D | 1 | 52 | 576296 | 3039.09 | 785 | 760 | 189.4 |
| D | 1 | 20 | 262347 | 1381.3 | 785 | 760 | 189.4 |
| D | 7 | 38 | 51520 | 268.04 | 785 | 760 | 189.4 |
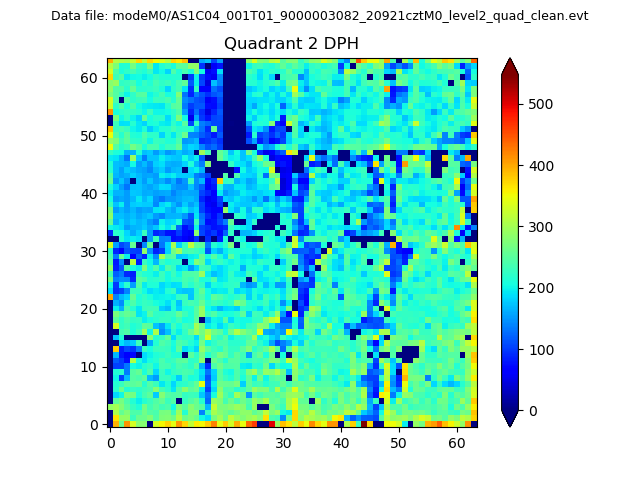
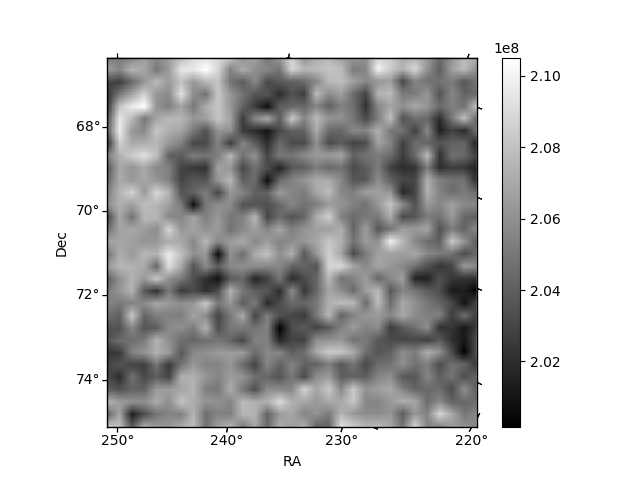
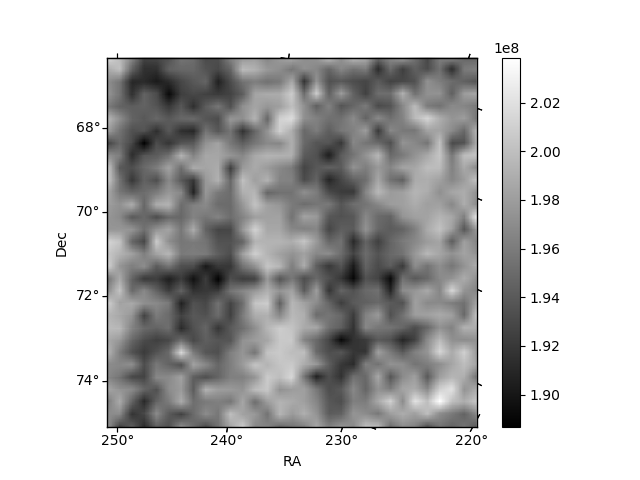
Histogram calculated using DETX and DETY for each event in the final _common_clean file
| Quadrant A | 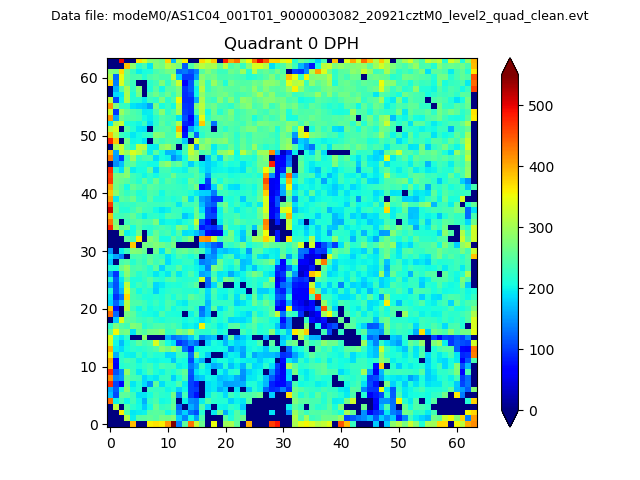 |
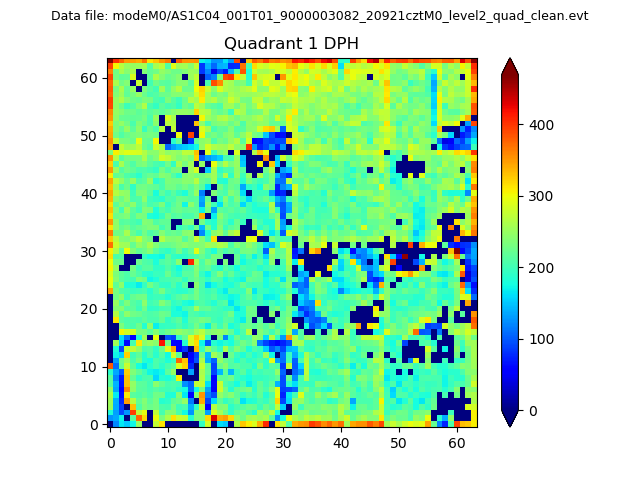 |
Quadrant B |
|---|---|---|---|
| Quadrant D | 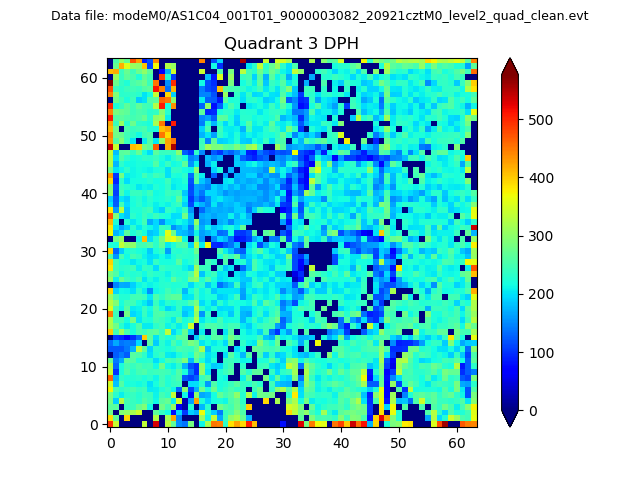 |
 |
Quadrant C |
| Plot type | Count rate plots | Images |
|---|---|---|
| Comparison with Poisson distribution Blue bars denote a histogram of data divided into 1 sec bins. Red curve is a Poisson curve with rate = median count rate of data. |
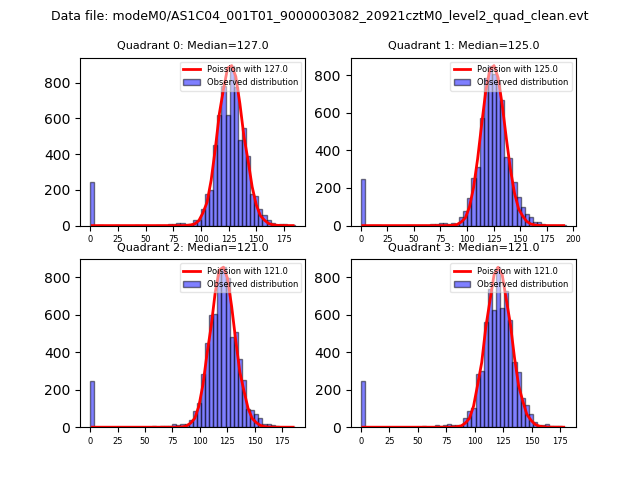 |
 |
| Quadrant-wise count rates Data is divided into 100 sec bins |
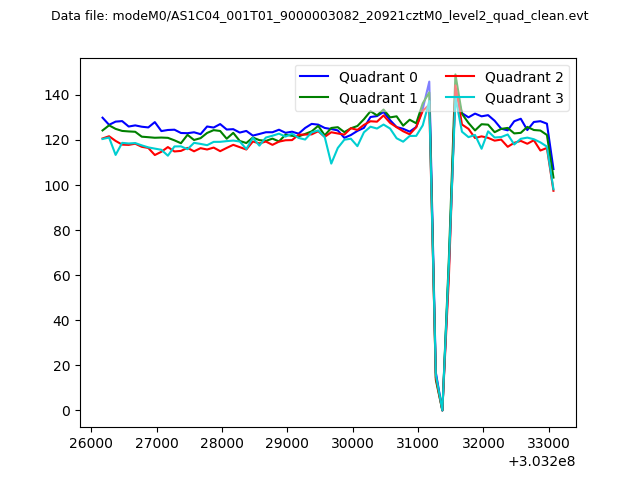 |
|
| Module-wise count rates for Quadrant A Data is divided into 100 sec bins |
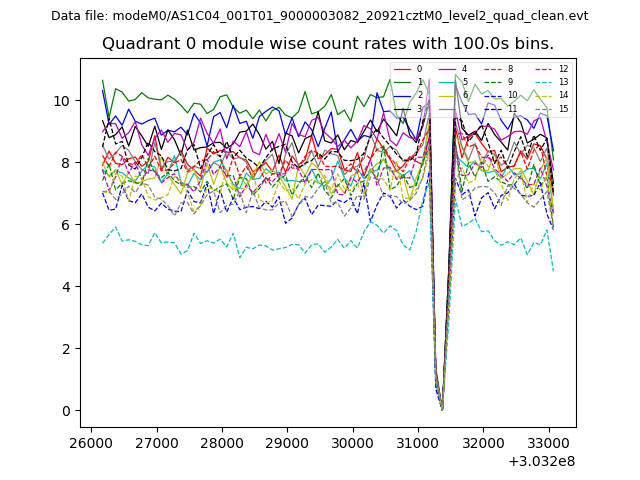 |
 |
| Module-wise count rates for Quadrant B Data is divided into 100 sec bins |
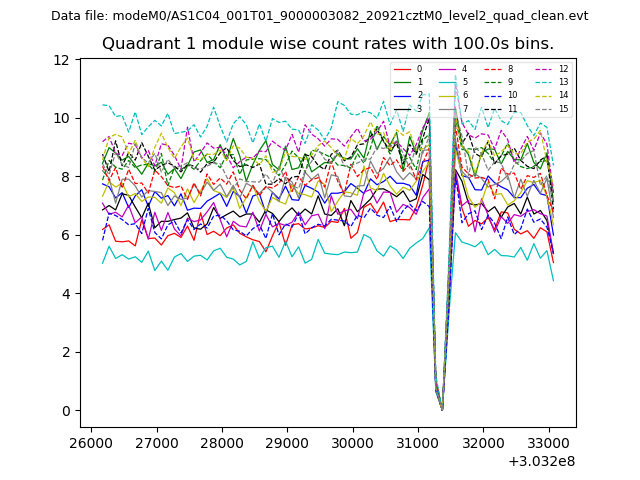 |
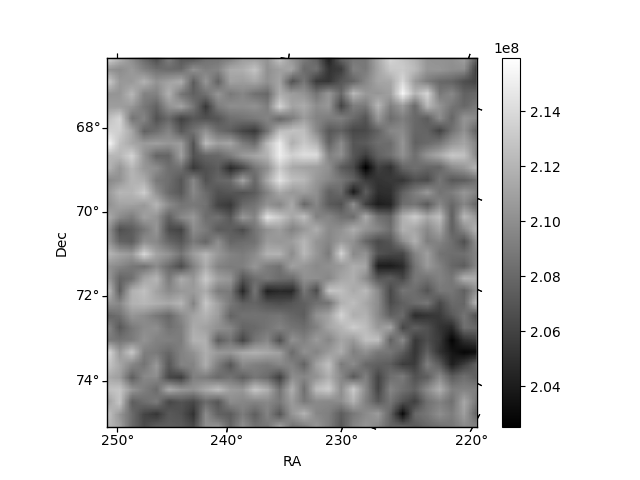 |
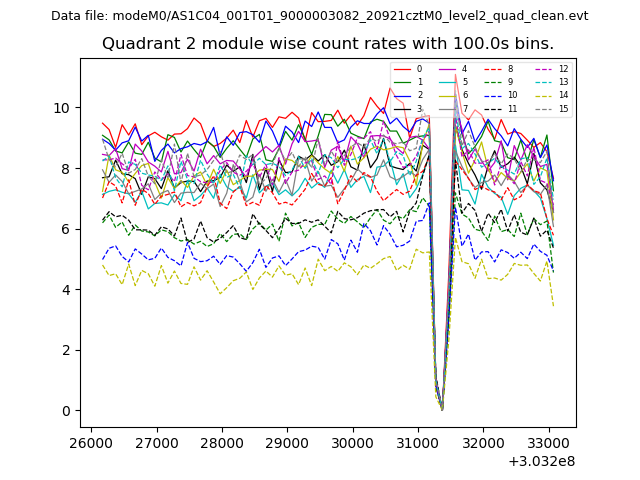
| Module-wise count rates for Quadrant C Data is divided into 100 sec bins |
 |
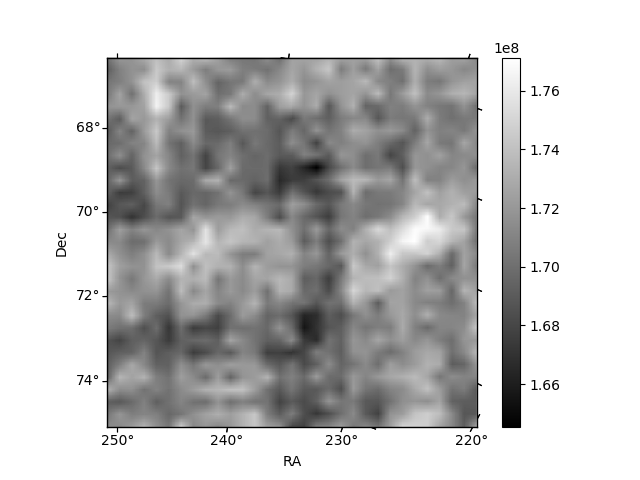 |
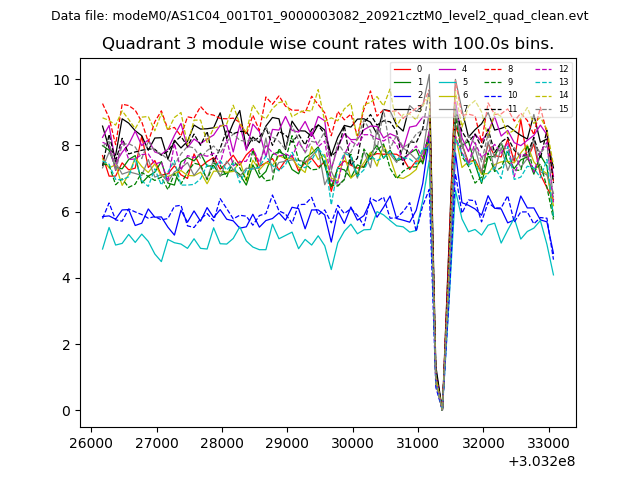
| Module-wise count rates for Quadrant D Data is divided into 100 sec bins |
 |
 |
| Parameter | Plot |
|---|---|
| CZT HV Monitor | 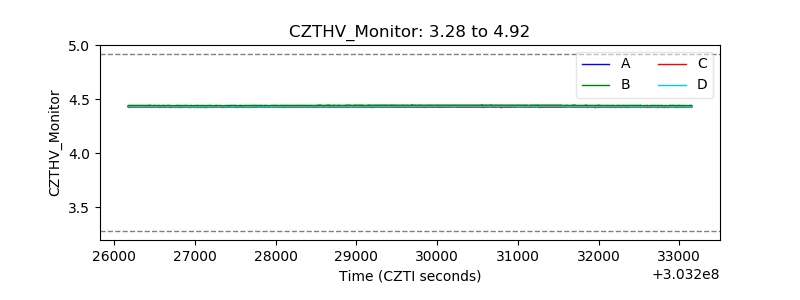 |
| D_VDD |  |
| Temperature 1 | 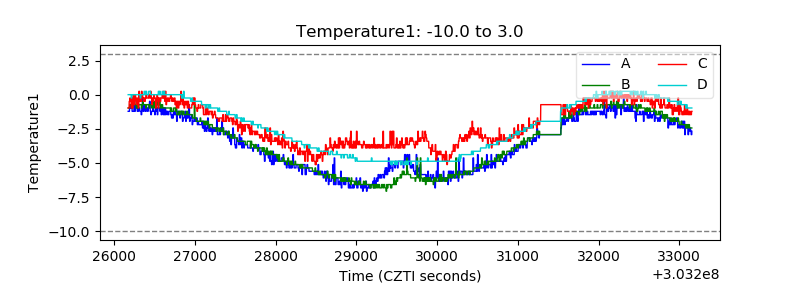 |
| Veto HV Monitor |  |
| Veto LLD | 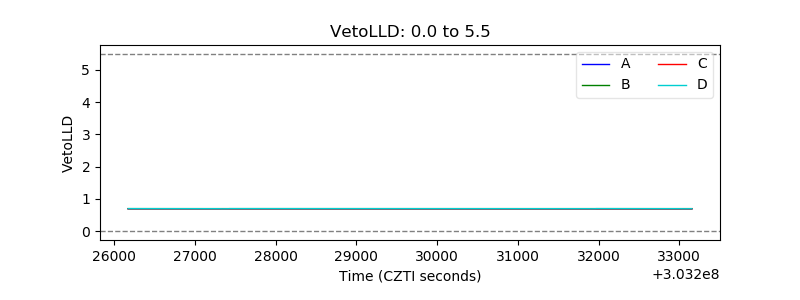 |
| Alpha Counter | 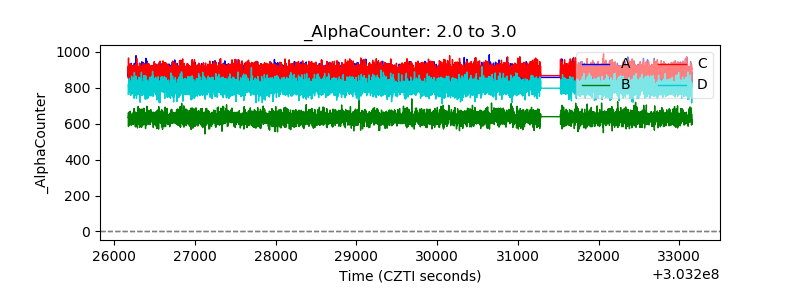 |
| _CPM_Rate | 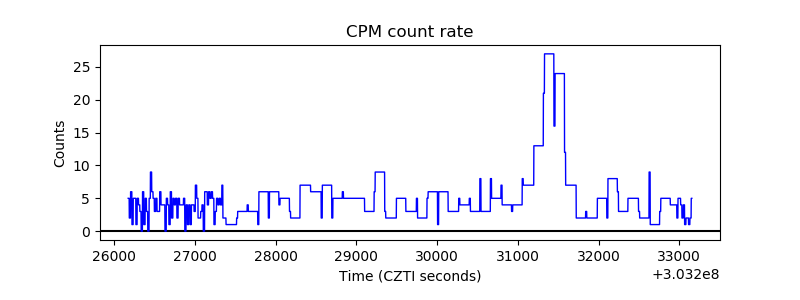 |
| CZT Counter | 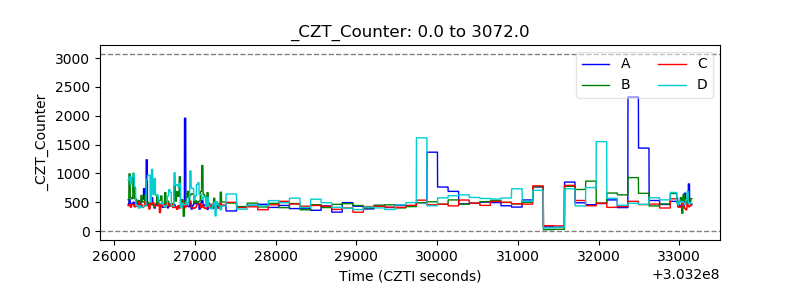 |
| +2.5 Volts monitor |  |
| +5 Volts monitor |  |
| _ROLL_ROT | 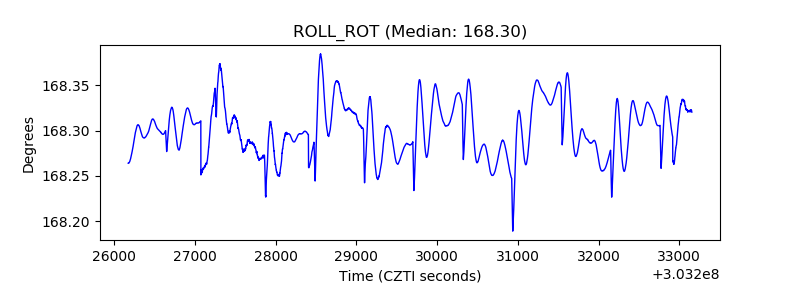 |
| _Roll_DEC | 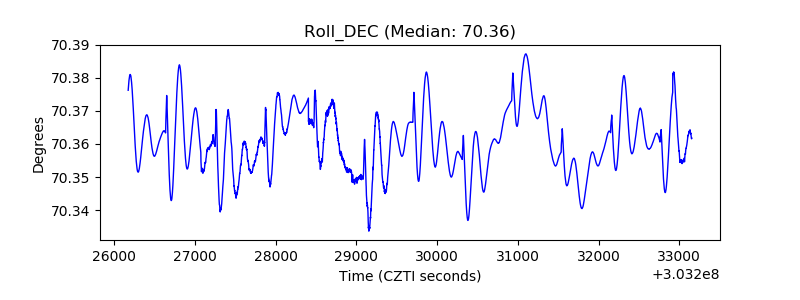 |
| _Roll_RA | 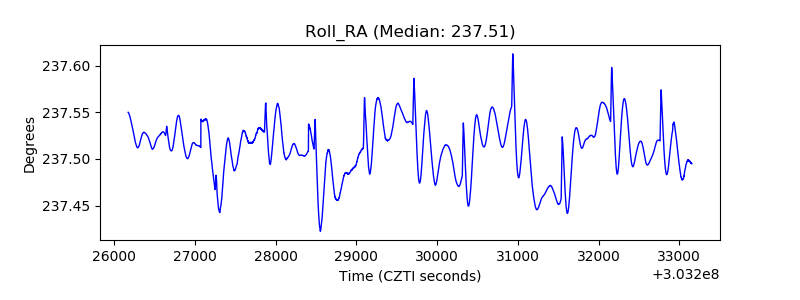 |
| Veto Counter | 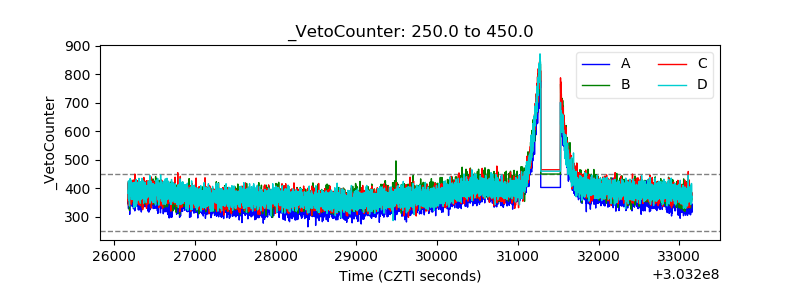 |