| Param | Original file | Final file |
|---|---|---|
| Filename | modeM0/AS1C04_001T01_9000003082_20924cztM0_level2.evt | modeM0/AS1C04_001T01_9000003082_20924cztM0_level2_quad_clean.evt |
| Size (bytes) | 1,206,682,560 | 332,968,320 |
| Size | 1.1 GB | 317.5 MB |
| Events in quadrant A | 8,405,664 | 2,263,980 |
| Events in quadrant B | 9,121,580 | 2,250,445 |
| Events in quadrant C | 8,340,987 | 2,174,389 |
| Events in quadrant D | 9,456,174 | 2,154,316 |
| Mode SS | |||
|---|---|---|---|
| Quadrant | BADHDUFLAG | Total packets | Discarded packets |
| A | 0 | 366 | 0 |
| B | 0 | 366 | 0 |
| C | 0 | 366 | 0 |
| D | 0 | 366 | 0 |
| Mode M9 | |||
|---|---|---|---|
| Quadrant | BADHDUFLAG | Total packets | Discarded packets |
| A | 0 | 19 | 0 |
| B | 0 | 19 | 0 |
| C | 0 | 19 | 0 |
| D | 0 | 19 | 0 |
| Mode M0 | |||
|---|---|---|---|
| Quadrant | BADHDUFLAG | Total packets | Discarded packets |
| A | 0 | 37403 | 3 |
| B | 0 | 39108 | 3 |
| C | 0 | 36823 | 3 |
| D | 0 | 40556 | 3 |
| Quadrant | Total seconds | Saturated seconds | Saturation percentage |
|---|---|---|---|
| A | 18036 | 115 | 0.637614% |
| B | 18036 | 197 | 1.092260% |
| C | 18036 | 193 | 1.070082% |
| D | 18037 | 399 | 2.212120% |
Noise dominated data is calculated using 1-second bins in cleaned event files. If a bin has >2000 counts, and if more than 50% of those come from <1% of pixels, then it is considered to be noise-dominated and hence unusable.
| Quadrant | # 1 sec bins | Bins with >0 counts | Bins with >2000 counts | High rate bins dominated by noise | Noise dominated (total time) | Noise dominated (detector-on time) | Marked lightcurve |
|---|---|---|---|---|---|---|---|
| A | 19926 | 18039 | 28 | 28 | 0.14% | 0.16% | 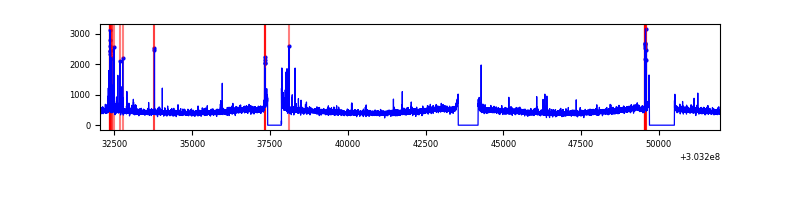 |
| B | 19926 | 18039 | 33 | 33 | 0.17% | 0.18% | 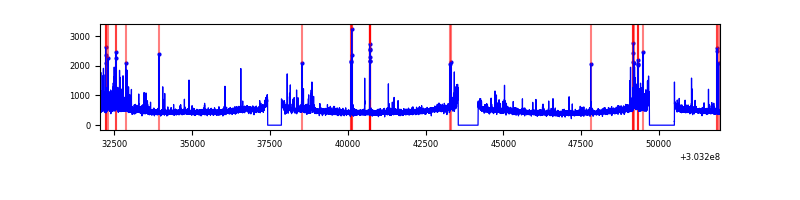 |
| C | 19926 | 18039 | 1 | 1 | 0.01% | 0.01% | 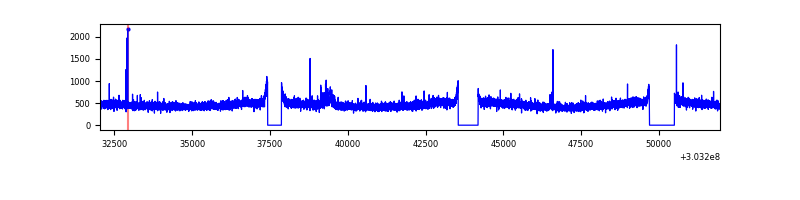 |
| D | 19927 | 18040 | 307 | 307 | 1.54% | 1.70% | 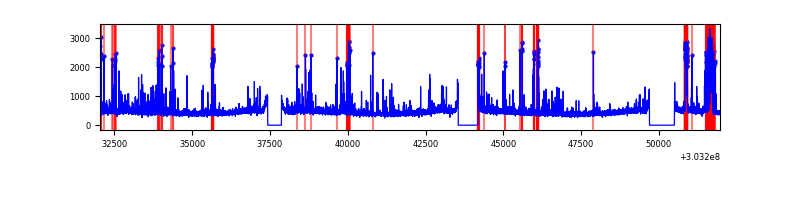 |
Top three noisy pixels from each quadrant. If the there are fewer than three noisy pixels in the level2.evt file, extra rows are filled as -1
| Pixel properties | Quadrant properties | ||||||
|---|---|---|---|---|---|---|---|
| Quadrant | DetID | PixID | Counts | Sigma | Mean | Median | Sigma |
| A | 5 | 16 | 250110 | 584.67 | 2112 | 2066 | 424.2 |
| A | 15 | 174 | 33946 | 75.14 | 2112 | 2066 | 424.2 |
| A | 0 | 226 | 18272 | 38.2 | 2112 | 2066 | 424.2 |
| B | 7 | 220 | 317674 | 791.17 | 2103 | 2045 | 398.9 |
| B | 0 | 229 | 139949 | 345.68 | 2103 | 2045 | 398.9 |
| B | 0 | 219 | 102048 | 250.67 | 2103 | 2045 | 398.9 |
| C | 14 | 238 | 315453 | 668.04 | 2025 | 2036 | 469.2 |
| C | 7 | 247 | 47020 | 95.88 | 2025 | 2036 | 469.2 |
| C | 10 | 91 | 25437 | 49.88 | 2025 | 2036 | 469.2 |
| D | 9 | 1 | 584295 | 1175.57 | 2055 | 1996 | 495.3 |
| D | 1 | 52 | 324333 | 650.75 | 2055 | 1996 | 495.3 |
| D | 1 | 20 | 238164 | 476.79 | 2055 | 1996 | 495.3 |
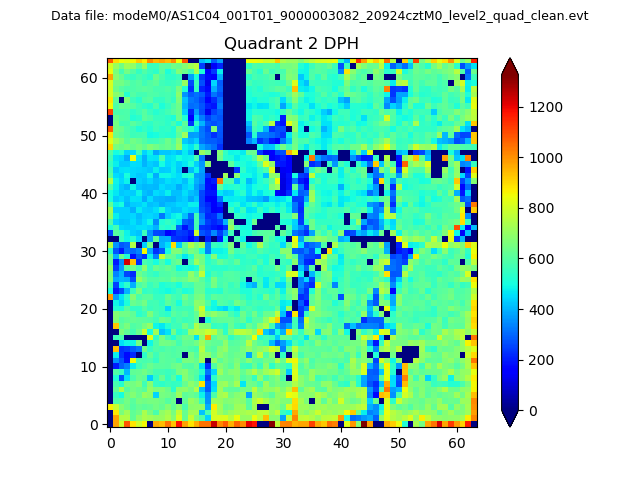
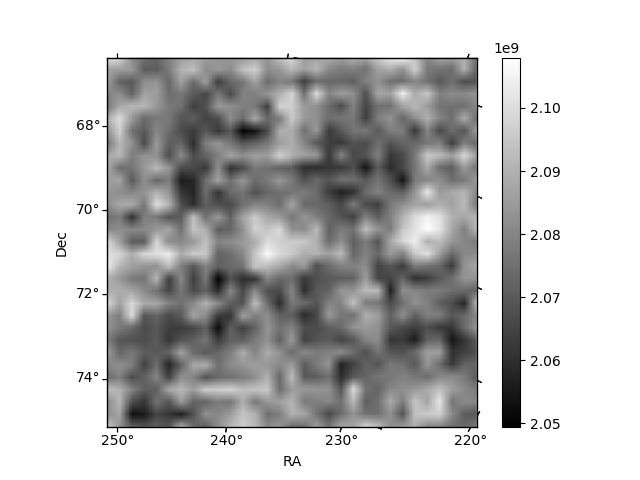
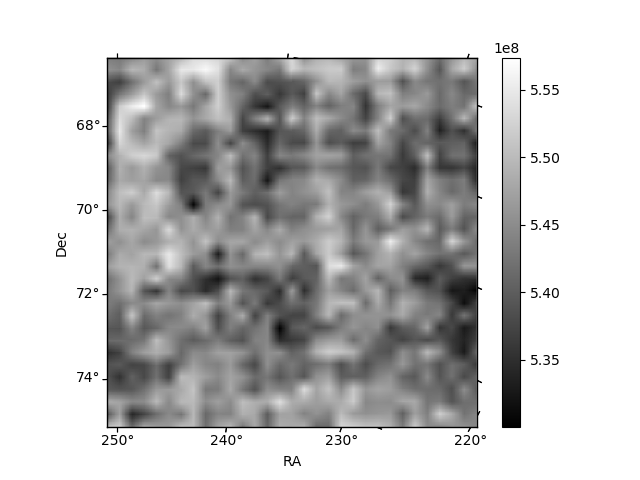
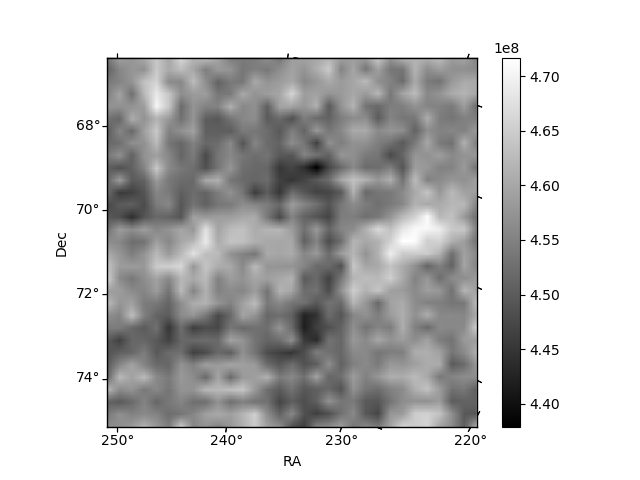
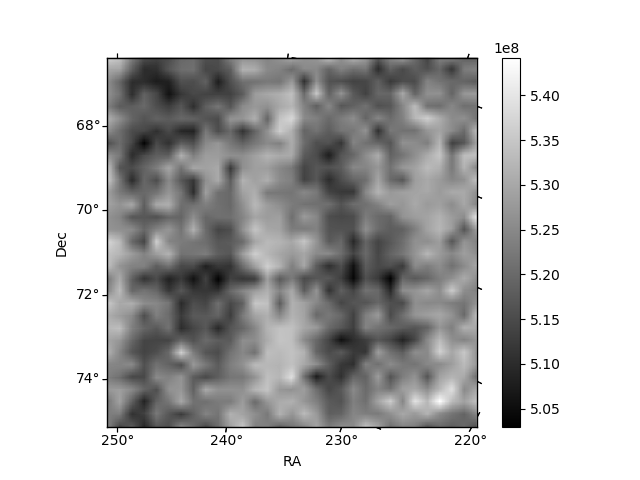
Histogram calculated using DETX and DETY for each event in the final _common_clean file
| Quadrant A | 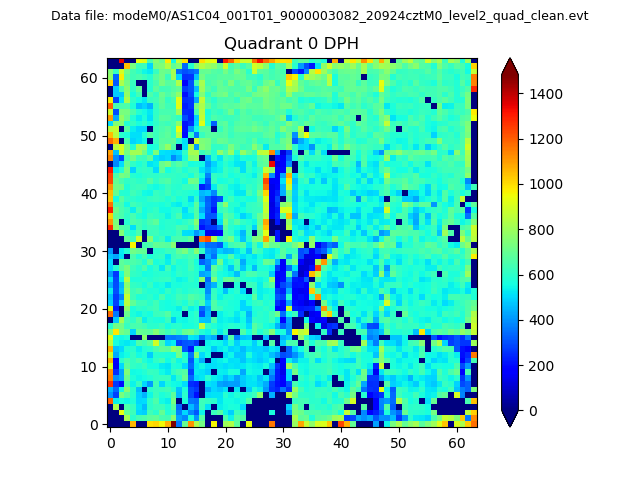 |
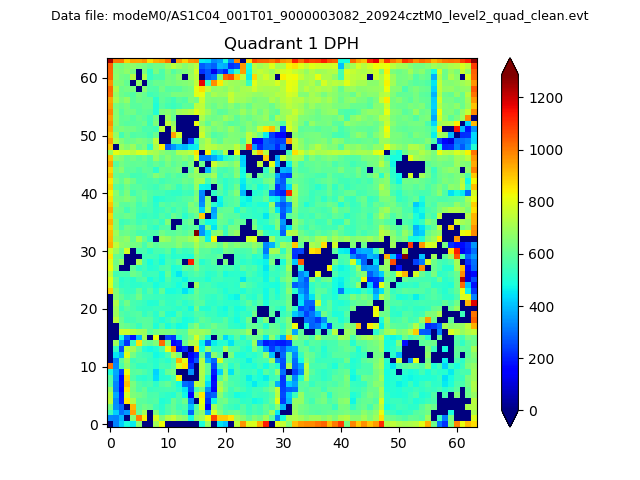 |
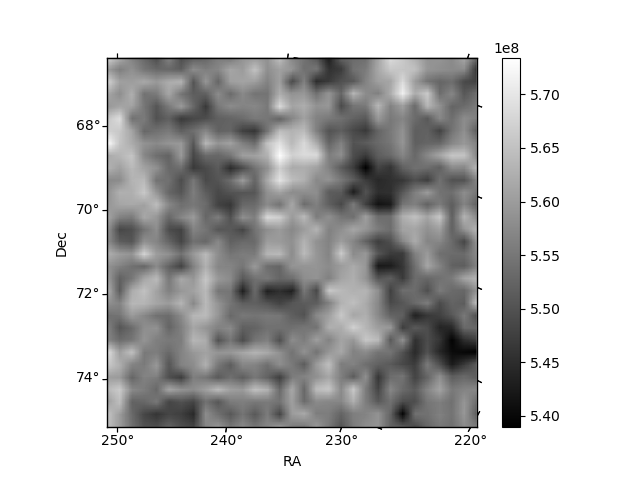
Quadrant B |
|---|---|---|---|
| Quadrant D | 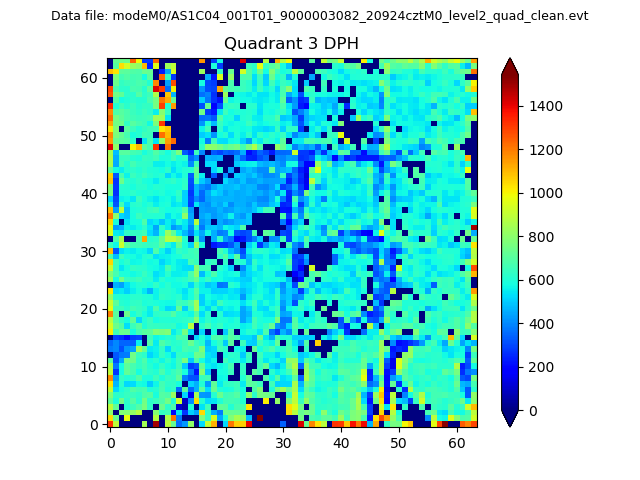 |
 |
Quadrant C |
| Plot type | Count rate plots | Images |
|---|---|---|
| Comparison with Poisson distribution Blue bars denote a histogram of data divided into 1 sec bins. Red curve is a Poisson curve with rate = median count rate of data. |
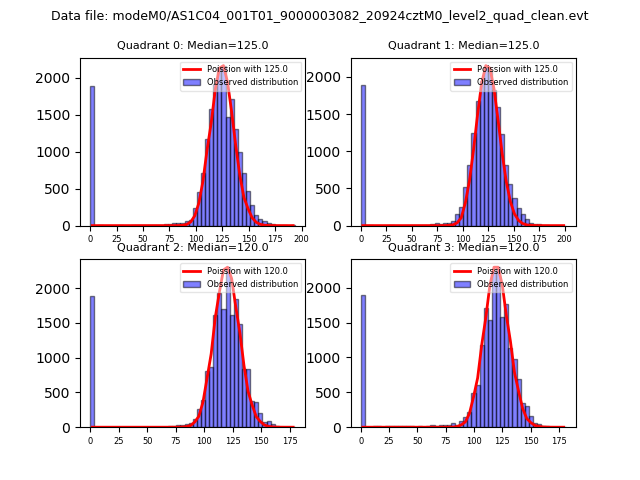 |
 |
| Quadrant-wise count rates Data is divided into 100 sec bins |
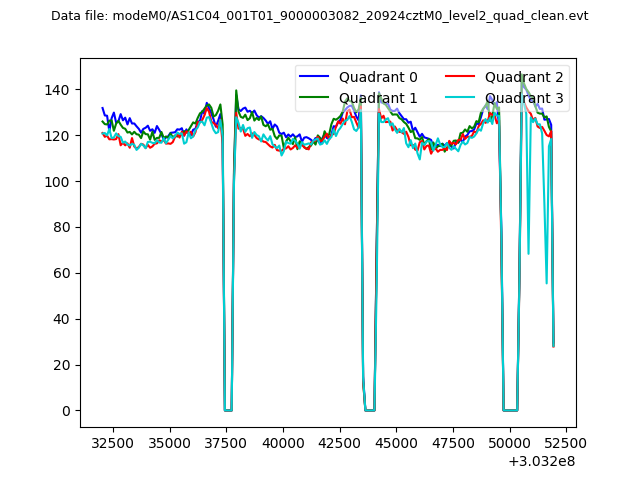 |
|
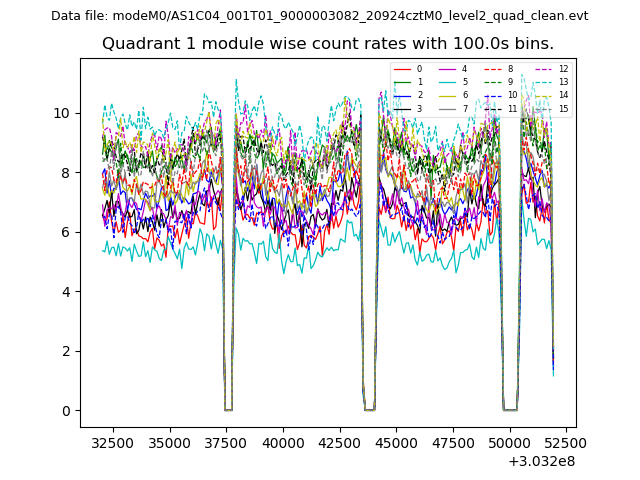
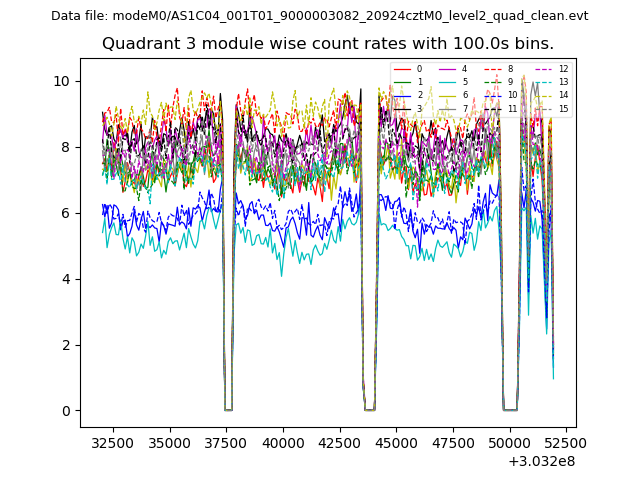
| Module-wise count rates for Quadrant A Data is divided into 100 sec bins |
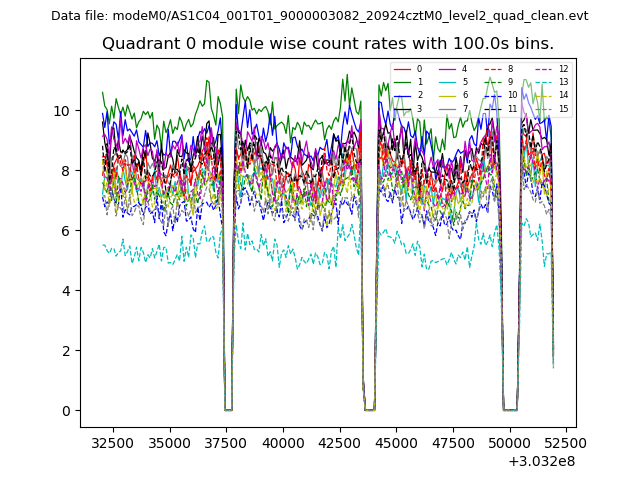 |
 |
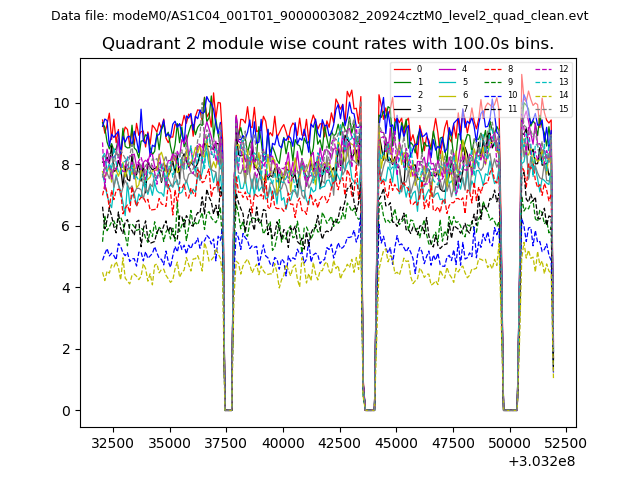
| Module-wise count rates for Quadrant B Data is divided into 100 sec bins |
 |
 |
| Module-wise count rates for Quadrant C Data is divided into 100 sec bins |
 |
 |
| Module-wise count rates for Quadrant D Data is divided into 100 sec bins |
 |
 |
| Parameter | Plot |
|---|---|
| CZT HV Monitor |  |
| D_VDD | 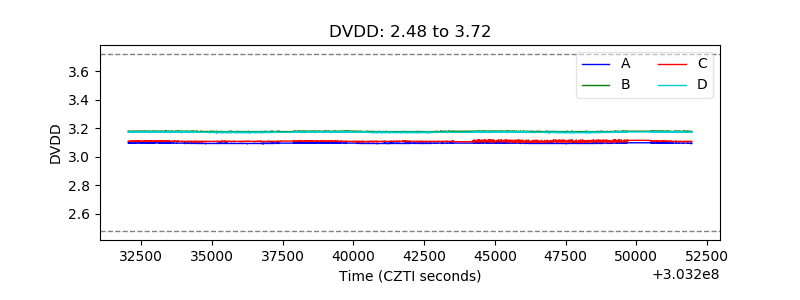 |
| Temperature 1 | 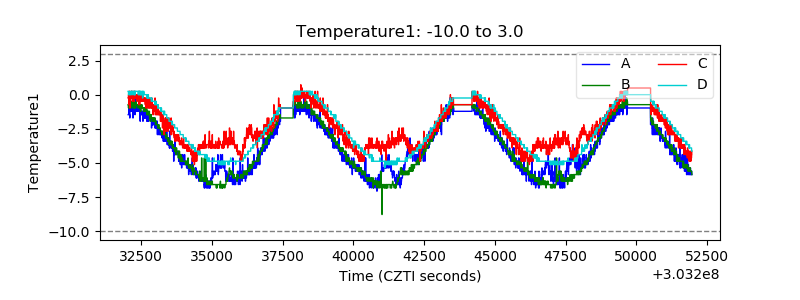 |
| Veto HV Monitor | 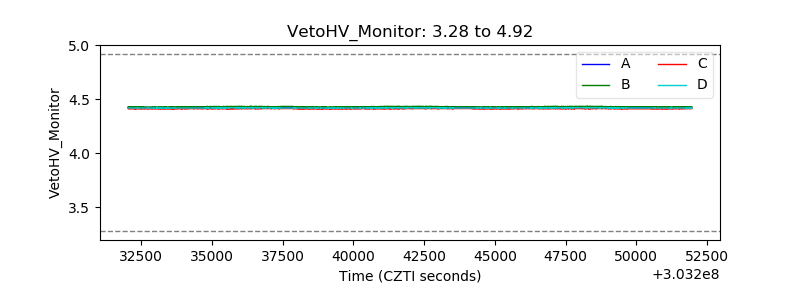 |
| Veto LLD | 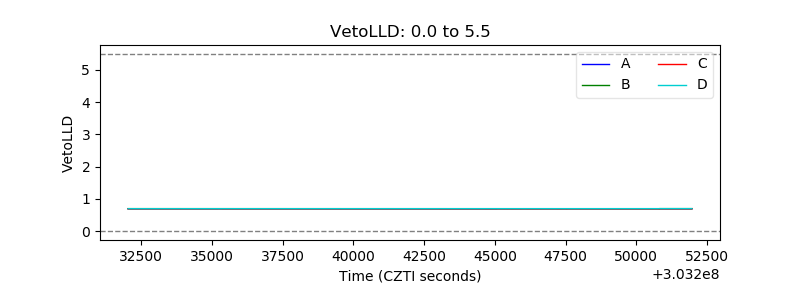 |
| Alpha Counter | 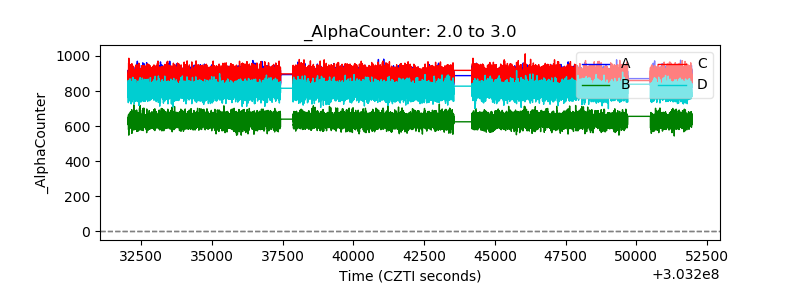 |
| _CPM_Rate | 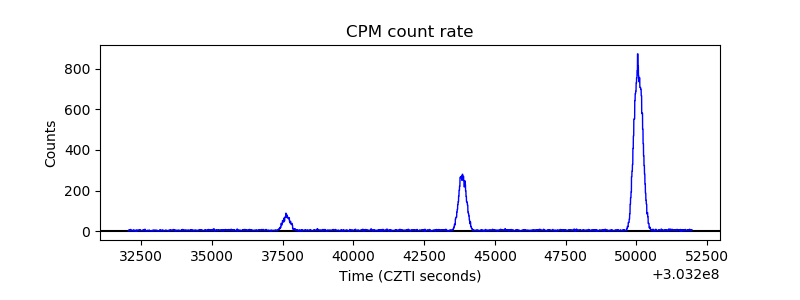 |
| CZT Counter | 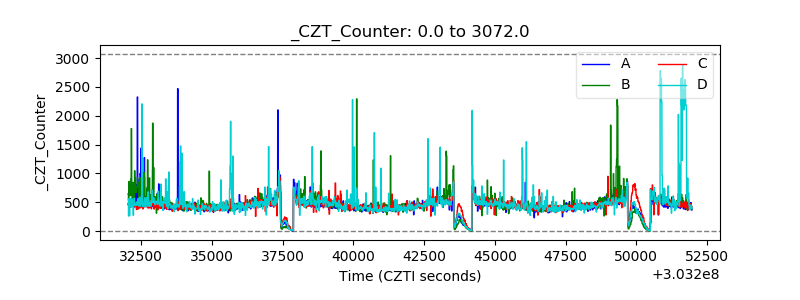 |
| +2.5 Volts monitor | 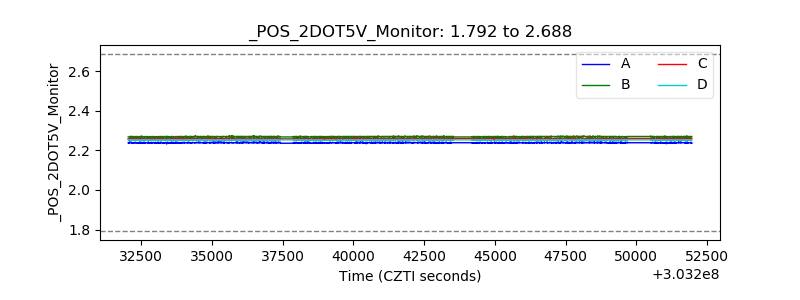 |
| +5 Volts monitor |  |
| _ROLL_ROT | 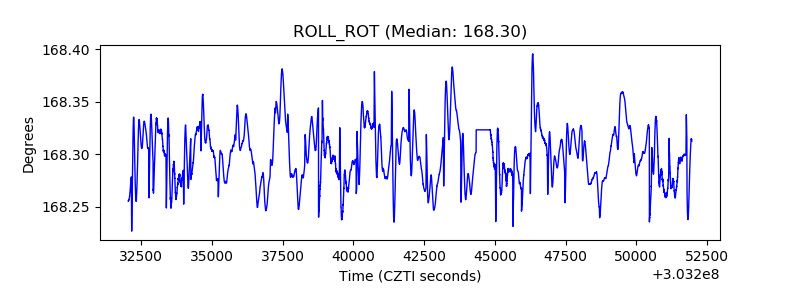 |
| _Roll_DEC | 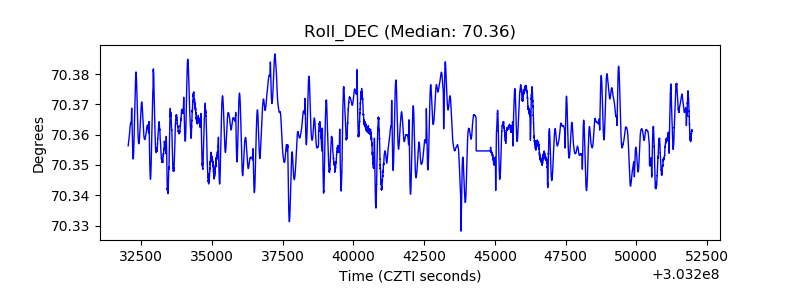 |
| _Roll_RA | 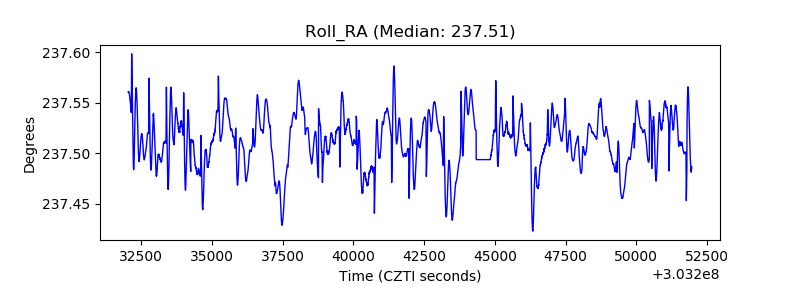 |
| Veto Counter | 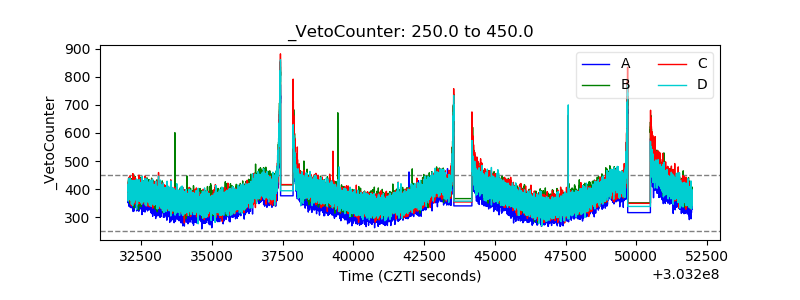 |