| Param | Original file | Final file |
|---|---|---|
| Filename | modeM0/AS1C04_001T01_9000003082_20925cztM0_level2.evt | modeM0/AS1C04_001T01_9000003082_20925cztM0_level2_quad_clean.evt |
| Size (bytes) | 472,659,840 | 125,484,480 |
| Size | 450.8 MB | 119.7 MB |
| Events in quadrant A | 3,097,522 | 854,067 |
| Events in quadrant B | 3,489,398 | 853,452 |
| Events in quadrant C | 3,149,218 | 826,268 |
| Events in quadrant D | 4,125,407 | 802,011 |
| Mode SS | |||
|---|---|---|---|
| Quadrant | BADHDUFLAG | Total packets | Discarded packets |
| A | 0 | 134 | 0 |
| B | 0 | 134 | 0 |
| C | 0 | 134 | 0 |
| D | 0 | 134 | 0 |
| Mode M9 | |||
|---|---|---|---|
| Quadrant | BADHDUFLAG | Total packets | Discarded packets |
| A | 0 | 15 | 0 |
| B | 0 | 16 | 0 |
| C | 0 | 16 | 0 |
| D | 0 | 16 | 0 |
| Mode M0 | |||
|---|---|---|---|
| Quadrant | BADHDUFLAG | Total packets | Discarded packets |
| A | 0 | 13721 | 2 |
| B | 0 | 14884 | 2 |
| C | 0 | 13793 | 2 |
| D | 0 | 16740 | 2 |
| Quadrant | Total seconds | Saturated seconds | Saturation percentage |
|---|---|---|---|
| A | 6673 | 29 | 0.434587% |
| B | 6673 | 93 | 1.393676% |
| C | 6673 | 67 | 1.004046% |
| D | 6673 | 270 | 4.046156% |
Noise dominated data is calculated using 1-second bins in cleaned event files. If a bin has >2000 counts, and if more than 50% of those come from <1% of pixels, then it is considered to be noise-dominated and hence unusable.
| Quadrant | # 1 sec bins | Bins with >0 counts | Bins with >2000 counts | High rate bins dominated by noise | Noise dominated (total time) | Noise dominated (detector-on time) | Marked lightcurve |
|---|---|---|---|---|---|---|---|
| A | 7658 | 6674 | 3 | 3 | 0.04% | 0.04% | 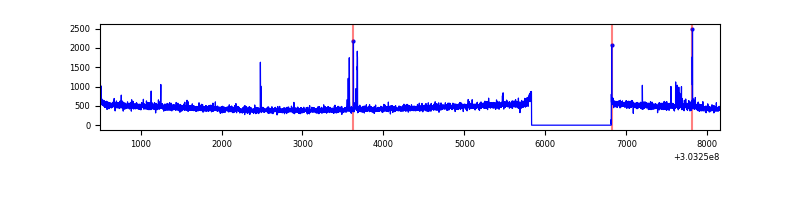 |
| B | 7658 | 6674 | 42 | 42 | 0.55% | 0.63% | 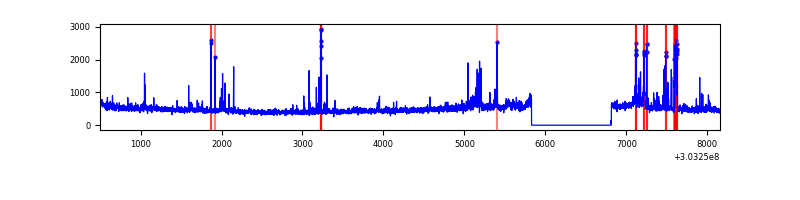 |
| C | 7658 | 6674 | 3 | 3 | 0.04% | 0.04% | 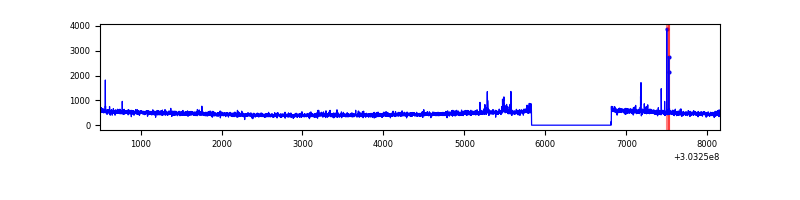 |
| D | 7658 | 6674 | 237 | 237 | 3.09% | 3.55% | 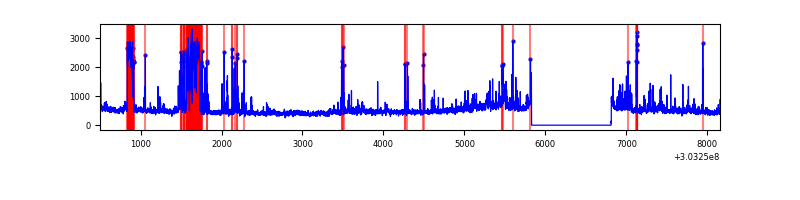 |
Top three noisy pixels from each quadrant. If the there are fewer than three noisy pixels in the level2.evt file, extra rows are filled as -1
| Pixel properties | Quadrant properties | ||||||
|---|---|---|---|---|---|---|---|
| Quadrant | DetID | PixID | Counts | Sigma | Mean | Median | Sigma |
| A | 5 | 16 | 57105 | 355.13 | 788 | 770 | 158.6 |
| A | 15 | 174 | 9793 | 56.88 | 788 | 770 | 158.6 |
| A | 0 | 226 | 6954 | 38.98 | 788 | 770 | 158.6 |
| B | 3 | 64 | 208621 | 1407.79 | 784 | 767 | 147.6 |
| B | 7 | 220 | 56674 | 378.66 | 784 | 767 | 147.6 |
| B | 0 | 229 | 39512 | 262.42 | 784 | 767 | 147.6 |
| C | 14 | 238 | 118561 | 663.12 | 759 | 762 | 177.6 |
| C | 9 | 54 | 35406 | 195.02 | 759 | 762 | 177.6 |
| C | 5 | 4 | 22301 | 121.25 | 759 | 762 | 177.6 |
| D | 9 | 1 | 649197 | 3554.46 | 756 | 733 | 182.4 |
| D | 1 | 52 | 269501 | 1473.21 | 756 | 733 | 182.4 |
| D | 1 | 20 | 226421 | 1237.07 | 756 | 733 | 182.4 |
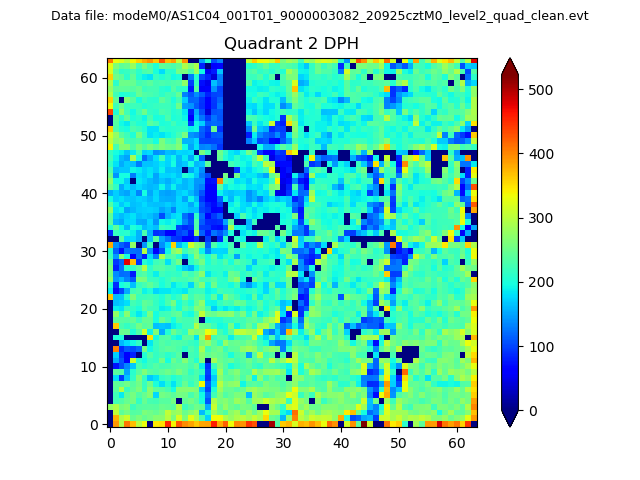
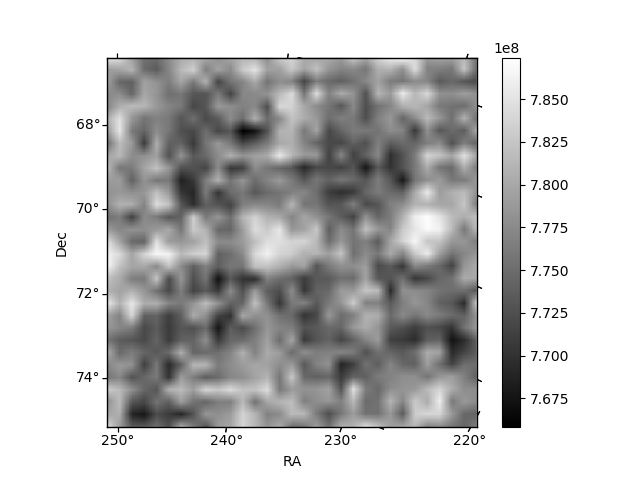
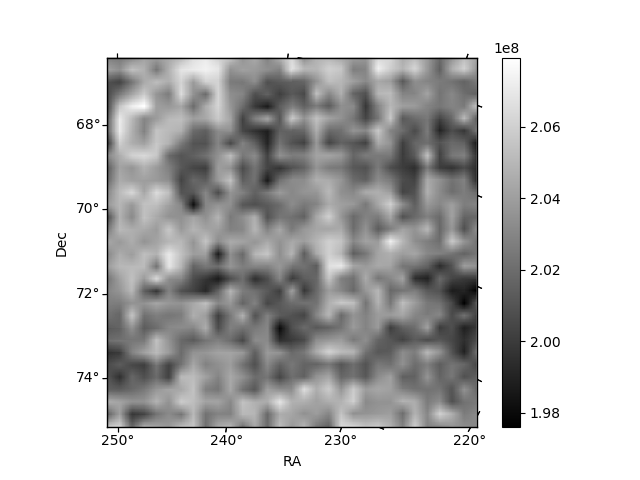
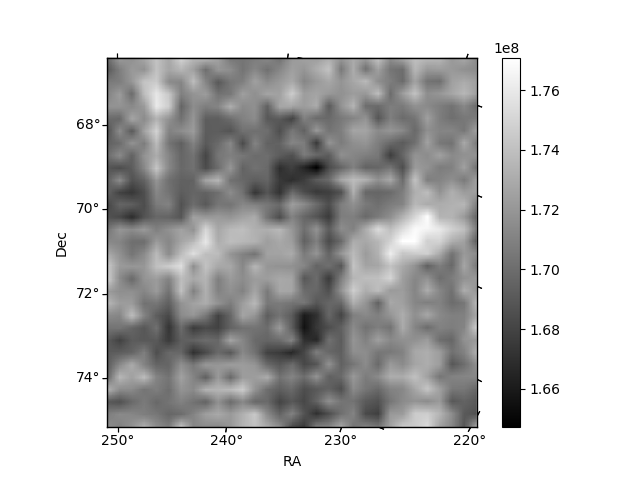
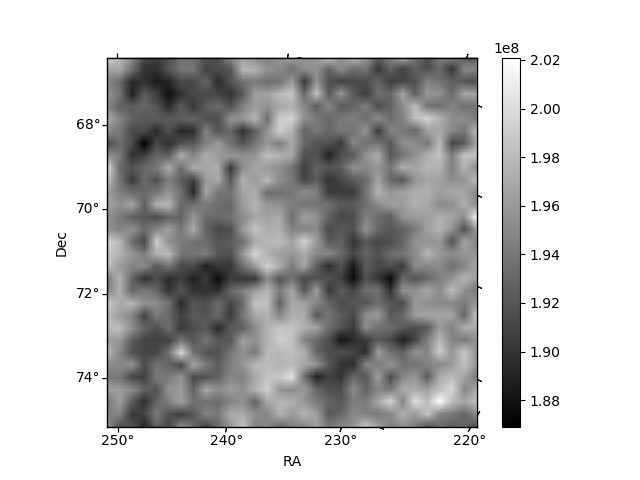
Histogram calculated using DETX and DETY for each event in the final _common_clean file
| Quadrant A | 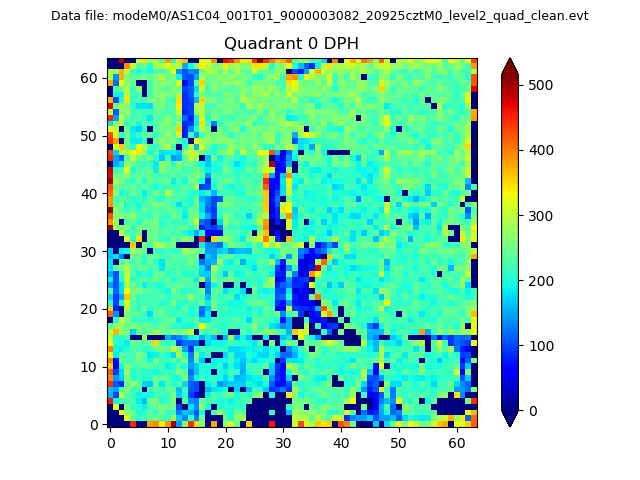 |
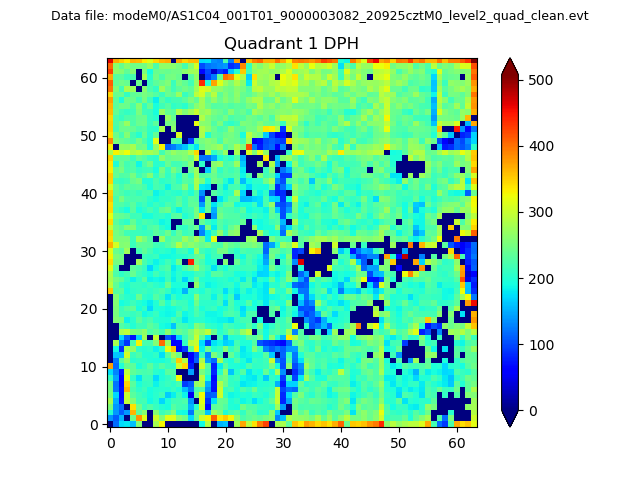 |
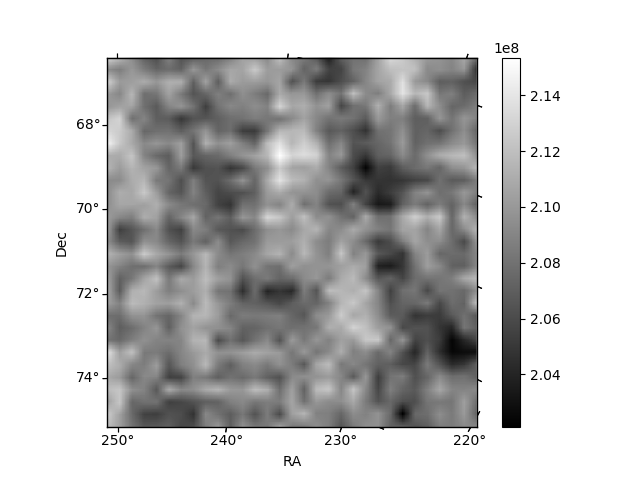
Quadrant B |
|---|---|---|---|
| Quadrant D | 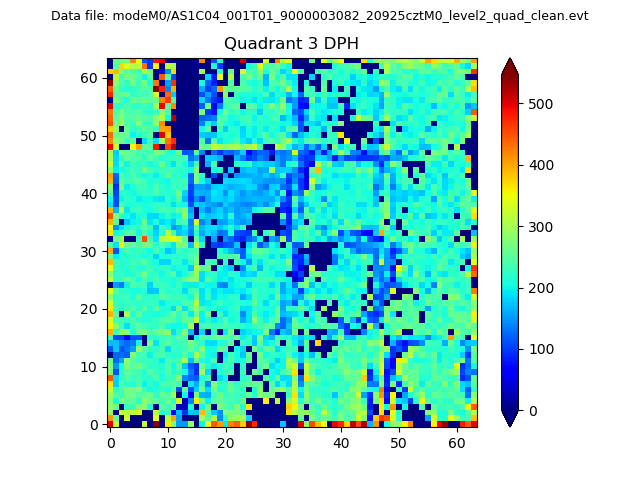 |
 |
Quadrant C |
| Plot type | Count rate plots | Images |
|---|---|---|
| Comparison with Poisson distribution Blue bars denote a histogram of data divided into 1 sec bins. Red curve is a Poisson curve with rate = median count rate of data. |
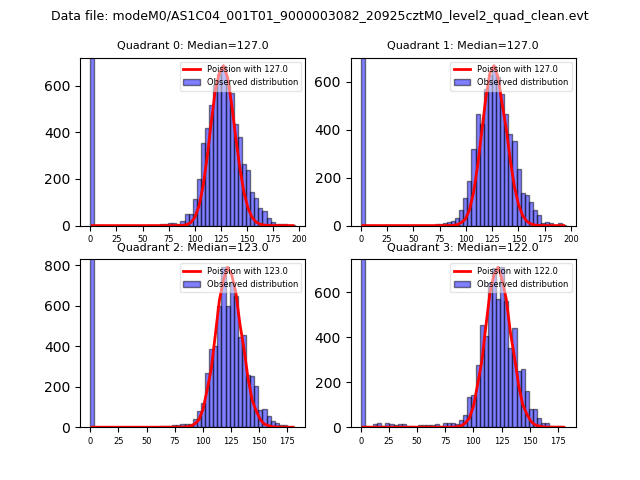 |
 |
| Quadrant-wise count rates Data is divided into 100 sec bins |
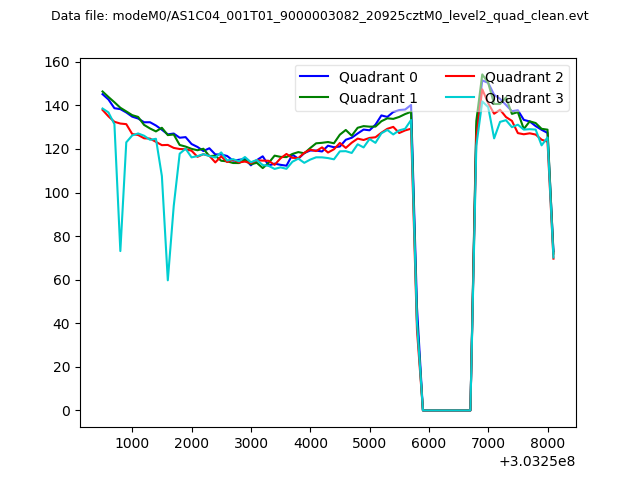 |
|
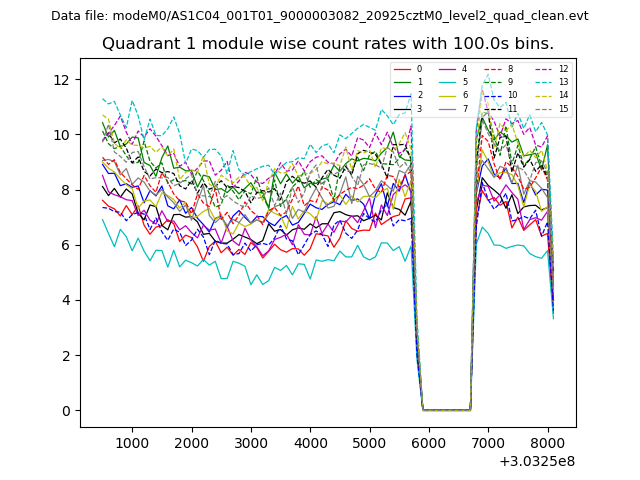
| Module-wise count rates for Quadrant A Data is divided into 100 sec bins |
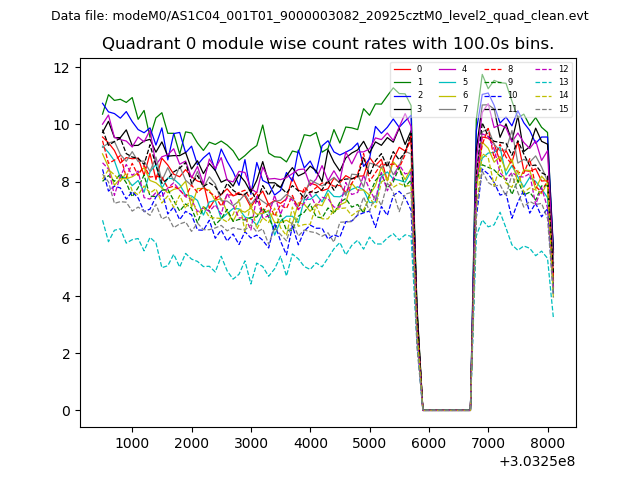 |
 |
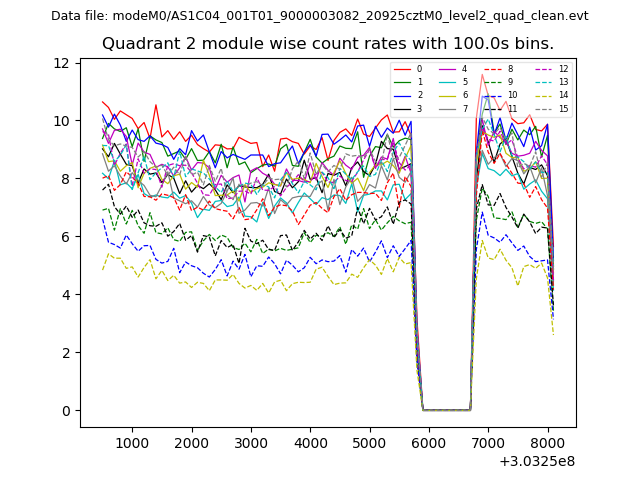
| Module-wise count rates for Quadrant B Data is divided into 100 sec bins |
 |
 |
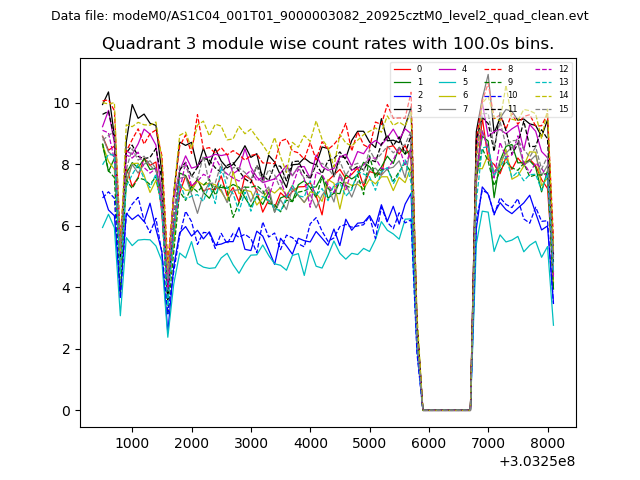
| Module-wise count rates for Quadrant C Data is divided into 100 sec bins |
 |
 |
| Module-wise count rates for Quadrant D Data is divided into 100 sec bins |
 |
 |
| Parameter | Plot |
|---|---|
| CZT HV Monitor | 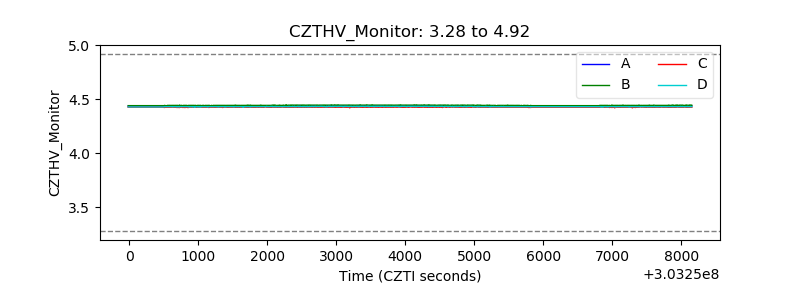 |
| D_VDD | 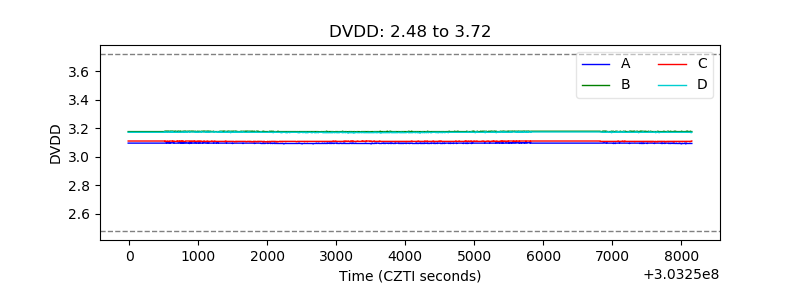 |
| Temperature 1 | 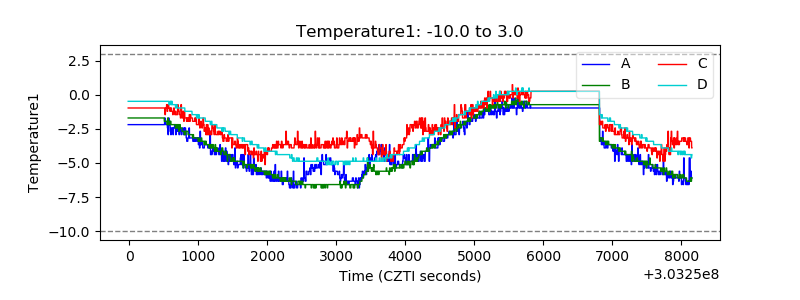 |
| Veto HV Monitor | 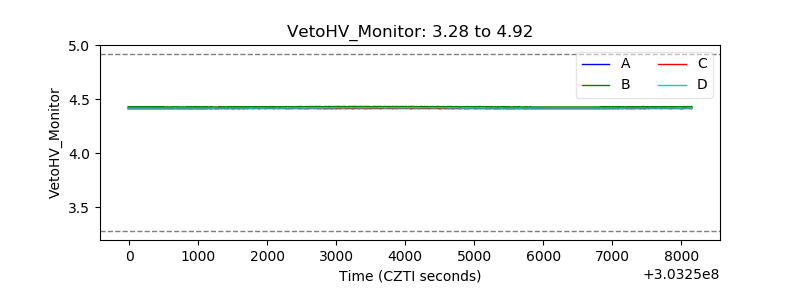 |
| Veto LLD | 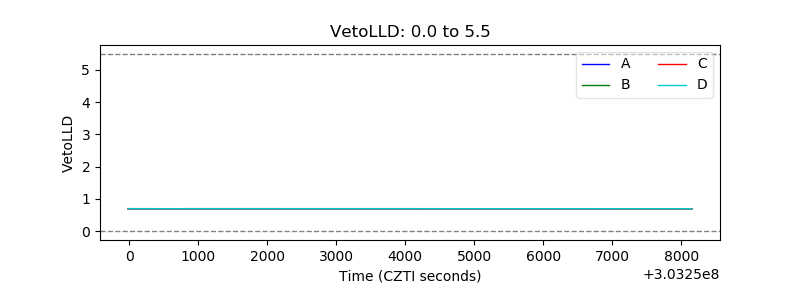 |
| Alpha Counter | 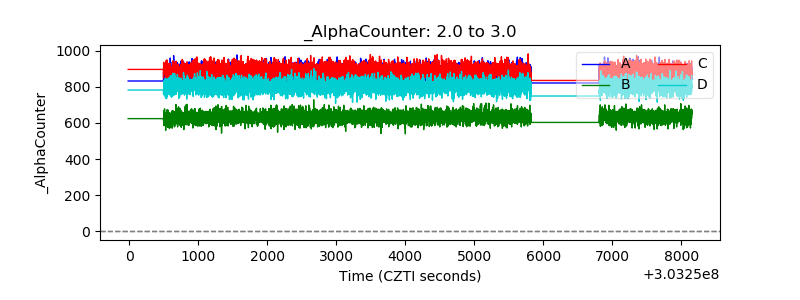 |
| _CPM_Rate | 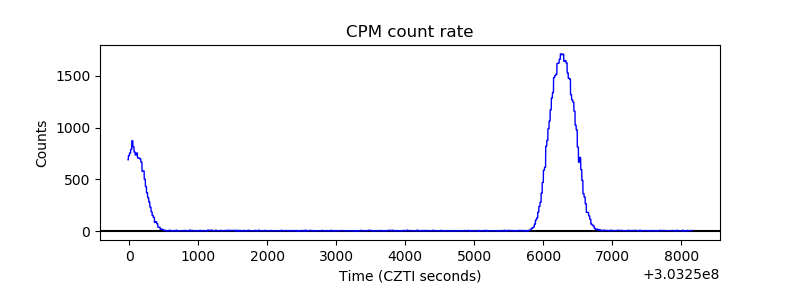 |
| CZT Counter | 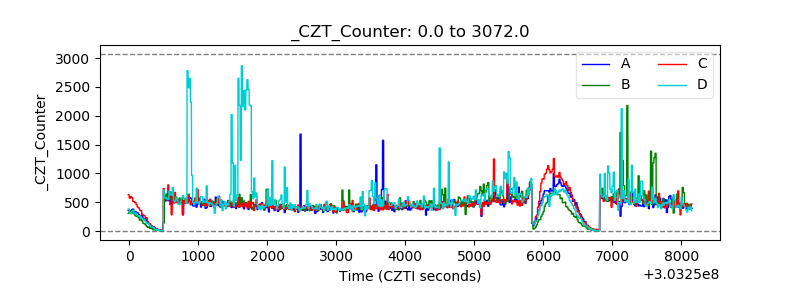 |
| +2.5 Volts monitor |  |
| +5 Volts monitor |  |
| _ROLL_ROT | 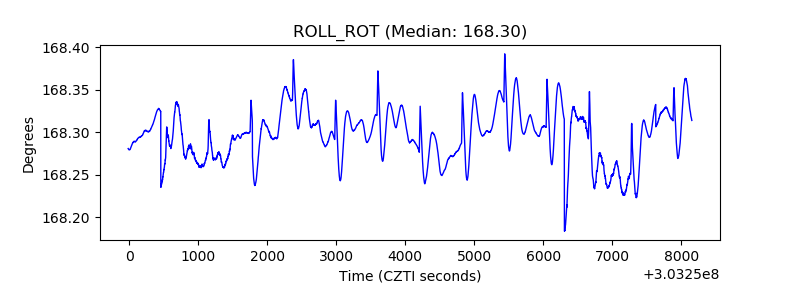 |
| _Roll_DEC | 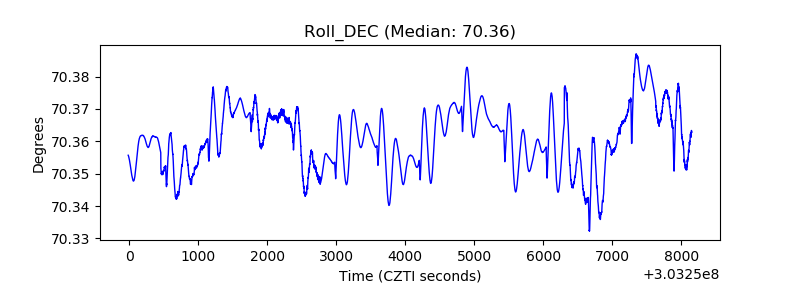 |
| _Roll_RA | 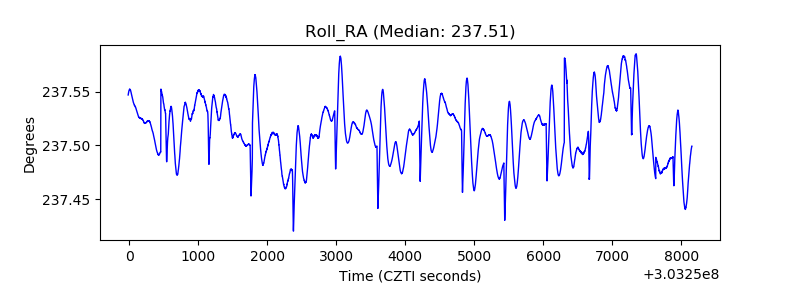 |
| Veto Counter | 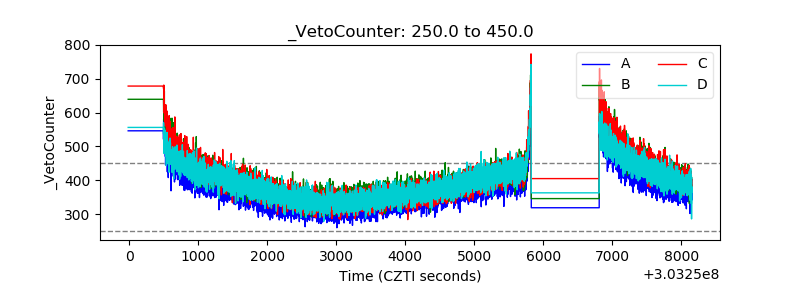 |