| Param | Original file | Final file |
|---|---|---|
| Filename | modeM0/AS1C04_001T01_9000003082_20927cztM0_level2.evt | modeM0/AS1C04_001T01_9000003082_20927cztM0_level2_quad_clean.evt |
| Size (bytes) | 444,378,240 | 123,929,280 |
| Size | 423.8 MB | 118.2 MB |
| Events in quadrant A | 3,126,230 | 841,523 |
| Events in quadrant B | 3,569,301 | 844,522 |
| Events in quadrant C | 3,032,843 | 818,482 |
| Events in quadrant D | 3,294,570 | 802,582 |
| Mode SS | |||
|---|---|---|---|
| Quadrant | BADHDUFLAG | Total packets | Discarded packets |
| A | 0 | 130 | 0 |
| B | 0 | 130 | 0 |
| C | 0 | 130 | 0 |
| D | 0 | 130 | 0 |
| Mode M9 | |||
|---|---|---|---|
| Quadrant | BADHDUFLAG | Total packets | Discarded packets |
| A | 0 | 19 | 0 |
| B | 0 | 20 | 0 |
| C | 0 | 20 | 0 |
| D | 0 | 20 | 0 |
| Mode M0 | |||
|---|---|---|---|
| Quadrant | BADHDUFLAG | Total packets | Discarded packets |
| A | 0 | 13465 | 2 |
| B | 0 | 14770 | 2 |
| C | 0 | 13275 | 3 |
| D | 0 | 14245 | 2 |
| Quadrant | Total seconds | Saturated seconds | Saturation percentage |
|---|---|---|---|
| A | 6399 | 33 | 0.515706% |
| B | 6399 | 121 | 1.890920% |
| C | 6398 | 62 | 0.969053% |
| D | 6398 | 81 | 1.266021% |
Noise dominated data is calculated using 1-second bins in cleaned event files. If a bin has >2000 counts, and if more than 50% of those come from <1% of pixels, then it is considered to be noise-dominated and hence unusable.
| Quadrant | # 1 sec bins | Bins with >0 counts | Bins with >2000 counts | High rate bins dominated by noise | Noise dominated (total time) | Noise dominated (detector-on time) | Marked lightcurve |
|---|---|---|---|---|---|---|---|
| A | 7519 | 6400 | 10 | 10 | 0.13% | 0.16% | 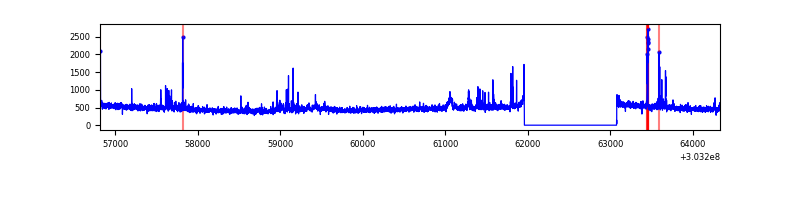 |
| B | 7519 | 6400 | 81 | 81 | 1.08% | 1.27% | 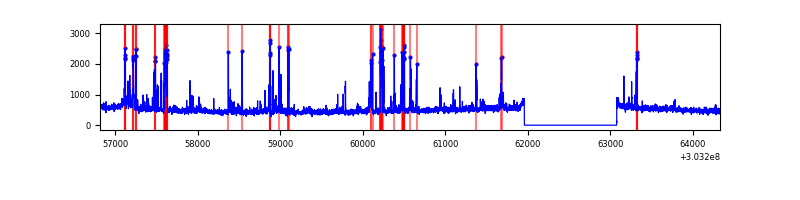 |
| C | 7518 | 6399 | 4 | 4 | 0.05% | 0.06% | 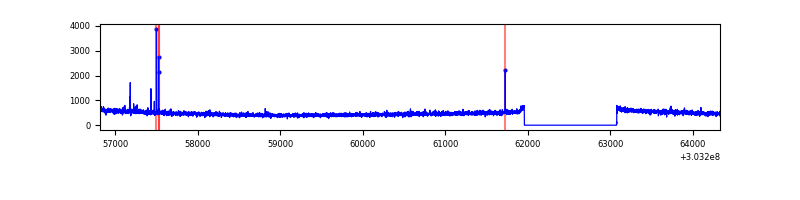 |
| D | 7518 | 6399 | 58 | 58 | 0.77% | 0.91% | 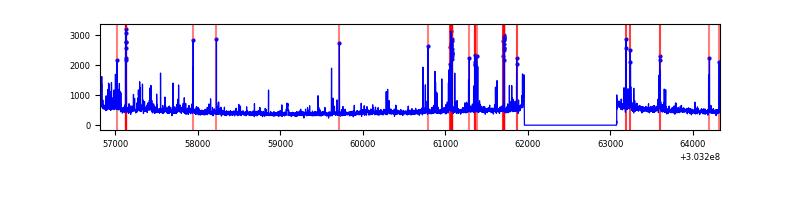 |
Top three noisy pixels from each quadrant. If the there are fewer than three noisy pixels in the level2.evt file, extra rows are filled as -1
| Pixel properties | Quadrant properties | ||||||
|---|---|---|---|---|---|---|---|
| Quadrant | DetID | PixID | Counts | Sigma | Mean | Median | Sigma |
| A | 5 | 16 | 109469 | 712.93 | 760 | 744 | 152.5 |
| A | 15 | 174 | 85741 | 557.34 | 760 | 744 | 152.5 |
| A | 8 | 31 | 6759 | 39.44 | 760 | 744 | 152.5 |
| B | 3 | 64 | 350715 | 2424.11 | 764 | 746 | 144.4 |
| B | 0 | 229 | 48569 | 331.25 | 764 | 746 | 144.4 |
| B | 0 | 219 | 42976 | 292.51 | 764 | 746 | 144.4 |
| C | 14 | 238 | 117502 | 677.01 | 737 | 743 | 172.5 |
| C | 5 | 4 | 24780 | 139.37 | 737 | 743 | 172.5 |
| C | 13 | 61 | 5148 | 25.54 | 737 | 743 | 172.5 |
| D | 7 | 38 | 146649 | 816.96 | 739 | 717 | 178.6 |
| D | 1 | 52 | 99375 | 552.31 | 739 | 717 | 178.6 |
| D | 5 | 222 | 73251 | 406.06 | 739 | 717 | 178.6 |
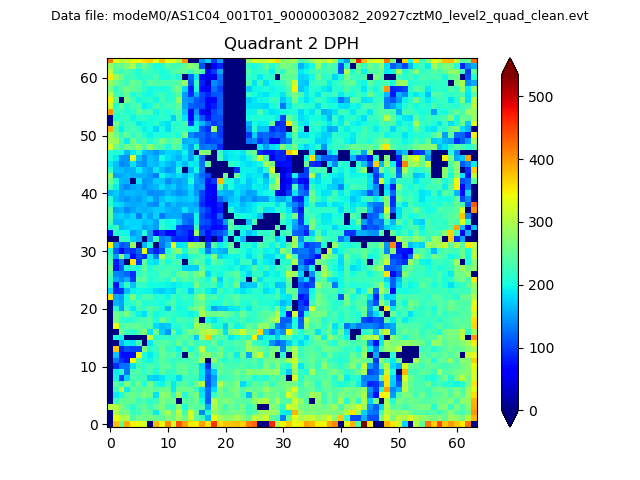
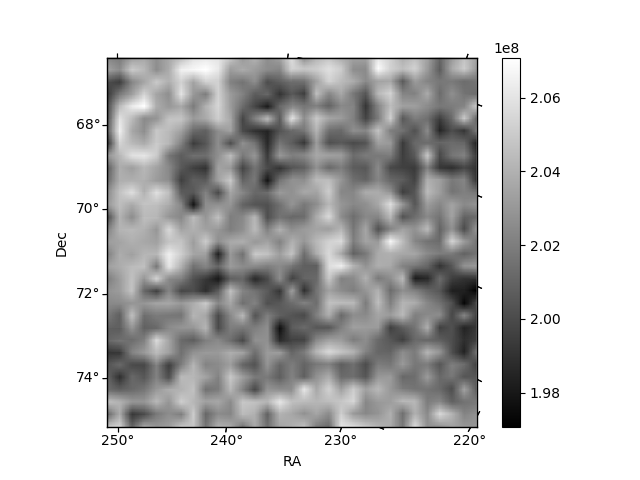
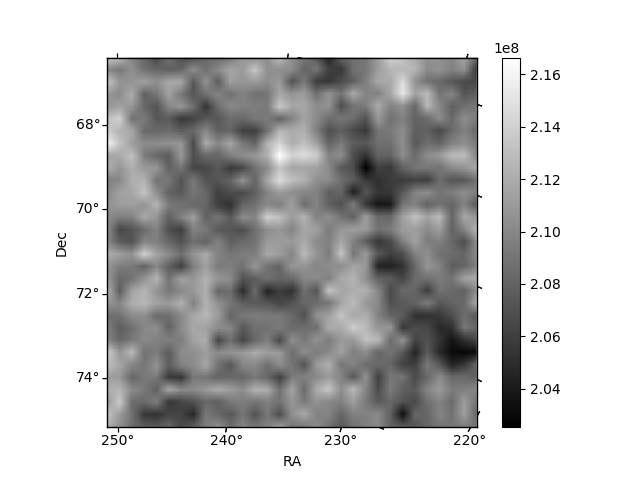
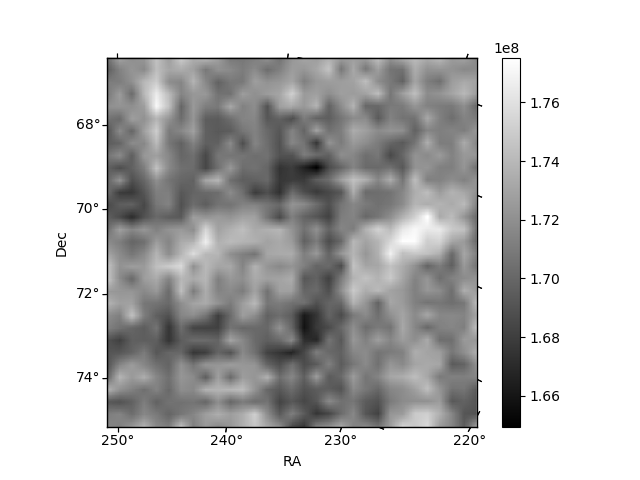
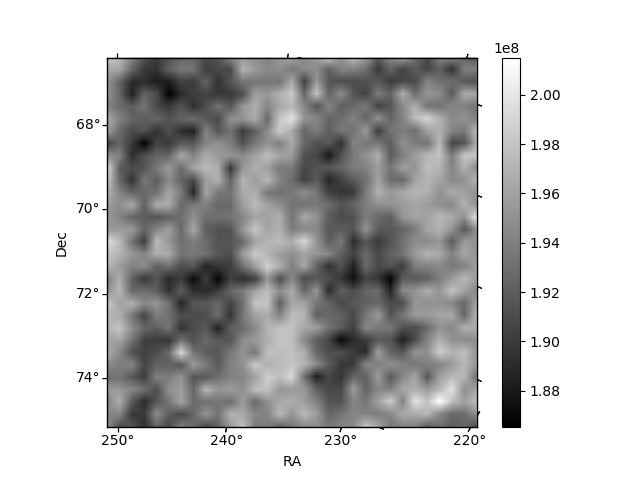
Histogram calculated using DETX and DETY for each event in the final _common_clean file
| Quadrant A | 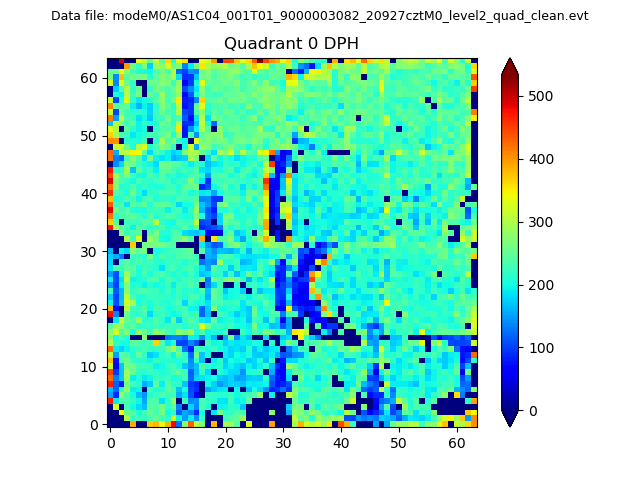 |
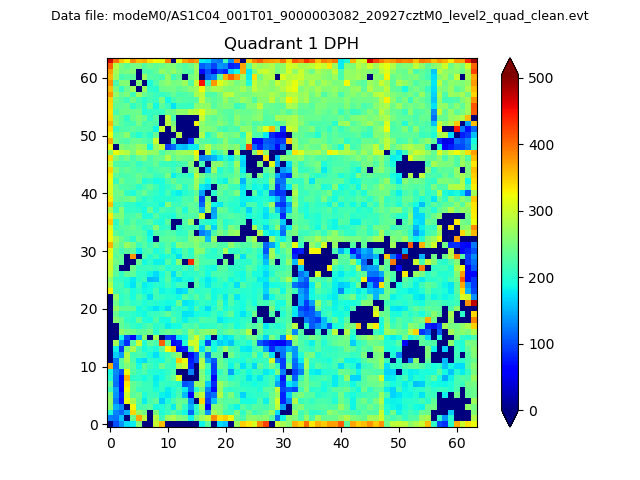 |
Quadrant B |
|---|---|---|---|
| Quadrant D | 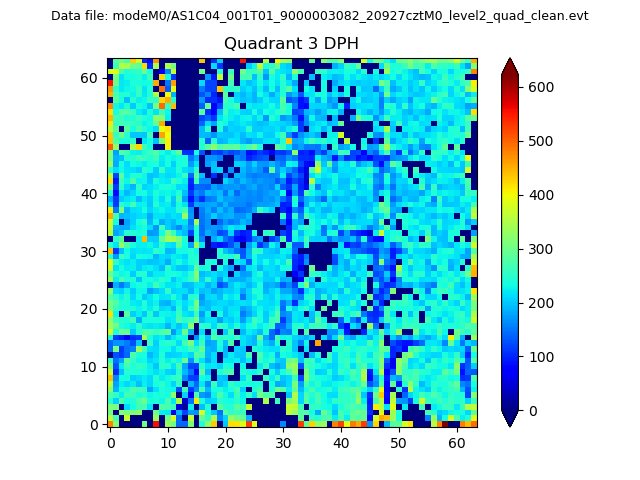 |
 |
Quadrant C |
| Plot type | Count rate plots | Images |
|---|---|---|
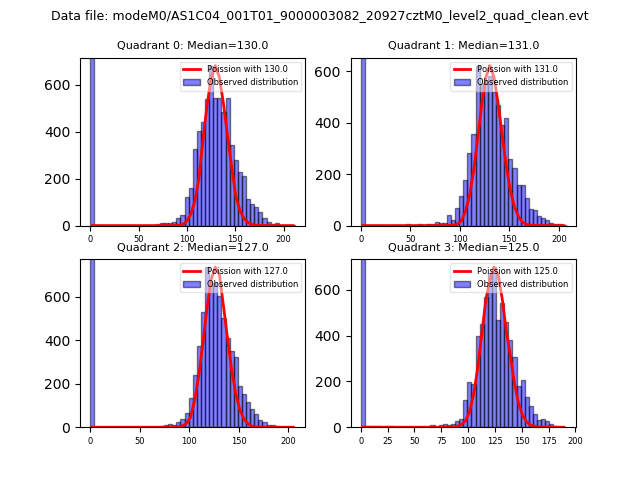
| Comparison with Poisson distribution Blue bars denote a histogram of data divided into 1 sec bins. Red curve is a Poisson curve with rate = median count rate of data. |
 |
 |
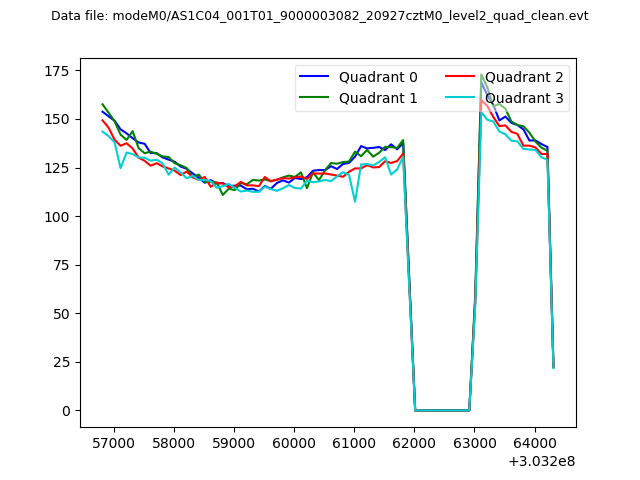
| Quadrant-wise count rates Data is divided into 100 sec bins |
 |
|
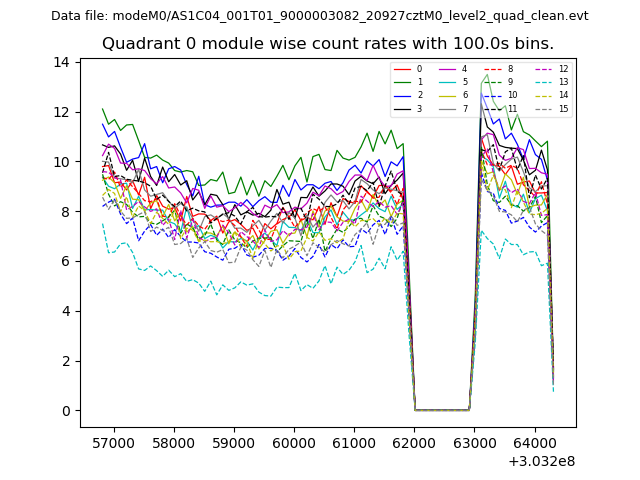
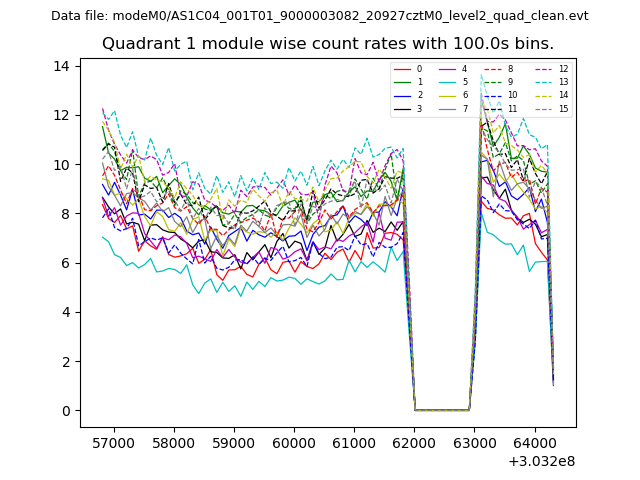
| Module-wise count rates for Quadrant A Data is divided into 100 sec bins |
 |
 |
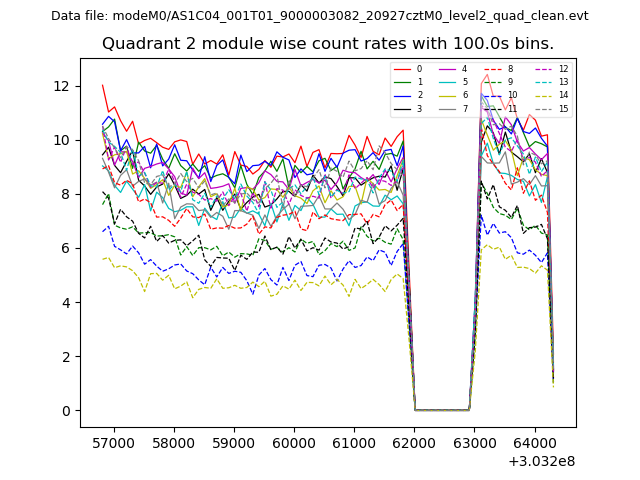
| Module-wise count rates for Quadrant B Data is divided into 100 sec bins |
 |
 |
| Module-wise count rates for Quadrant C Data is divided into 100 sec bins |
 |
 |
| Module-wise count rates for Quadrant D Data is divided into 100 sec bins |
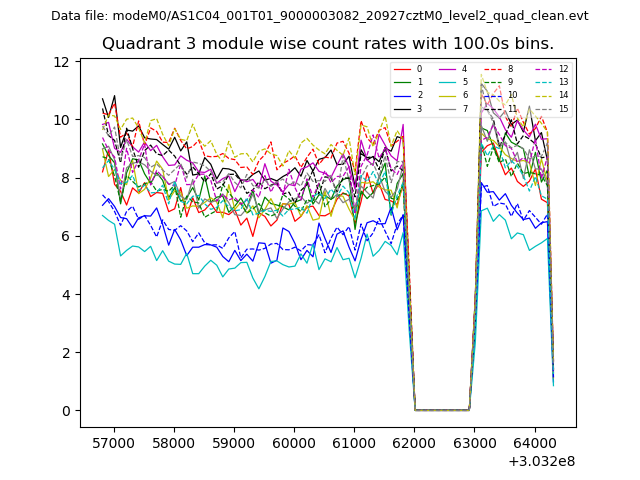 |
 |
| Parameter | Plot |
|---|---|
| CZT HV Monitor | 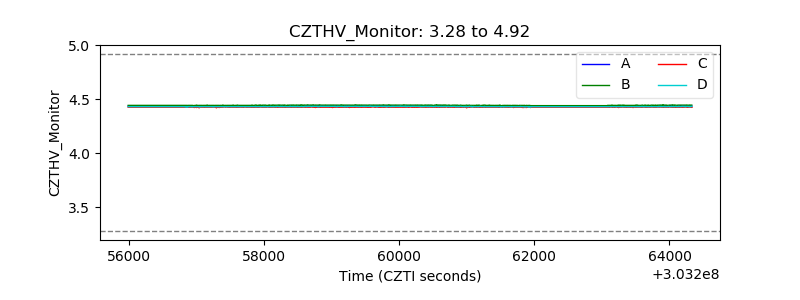 |
| D_VDD | 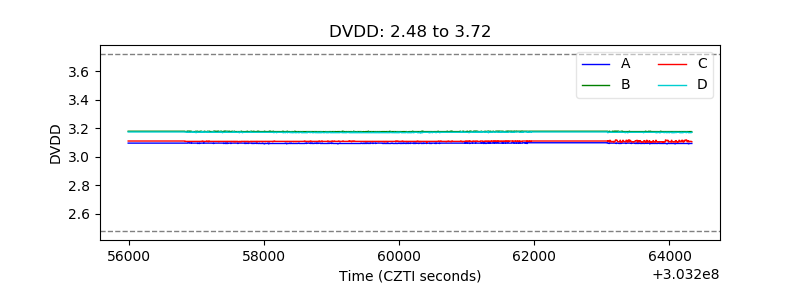 |
| Temperature 1 | 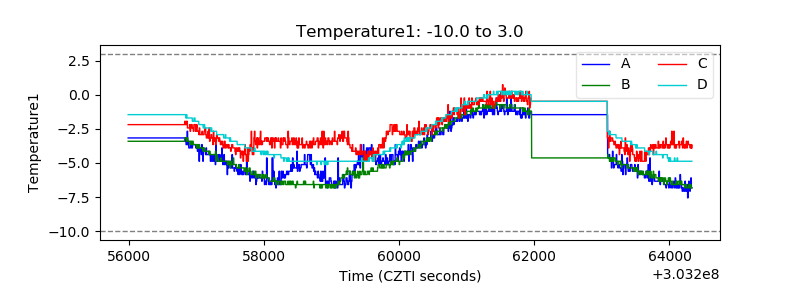 |
| Veto HV Monitor |  |
| Veto LLD | 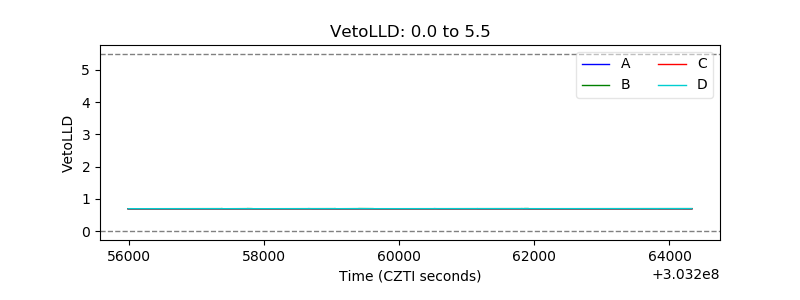 |
| Alpha Counter | 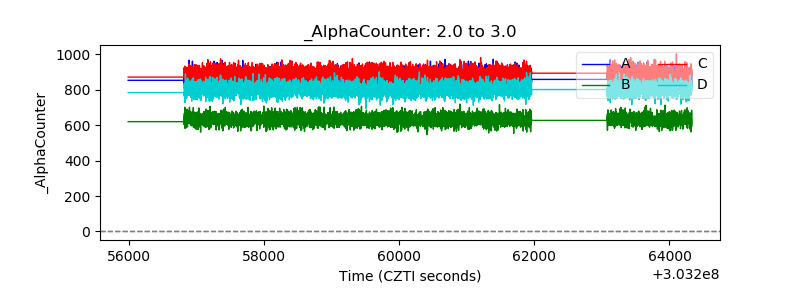 |
| _CPM_Rate | 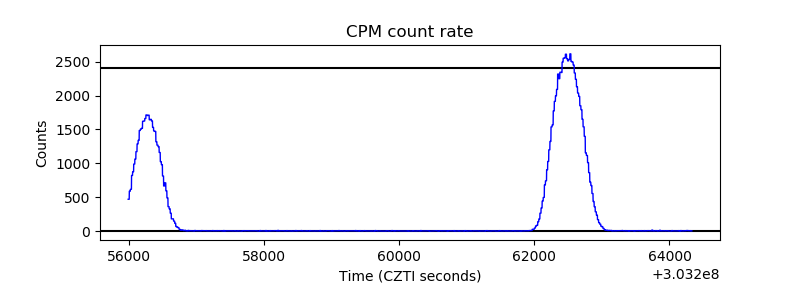 |
| CZT Counter | 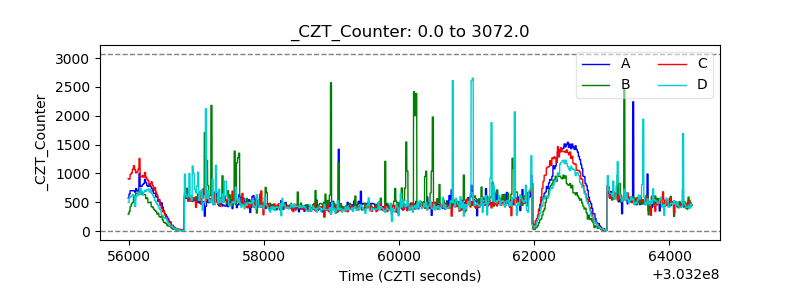 |
| +2.5 Volts monitor |  |
| +5 Volts monitor |  |
| _ROLL_ROT | 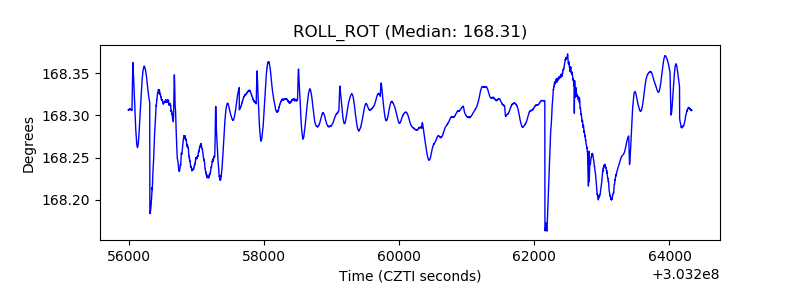 |
| _Roll_DEC |  |
| _Roll_RA | 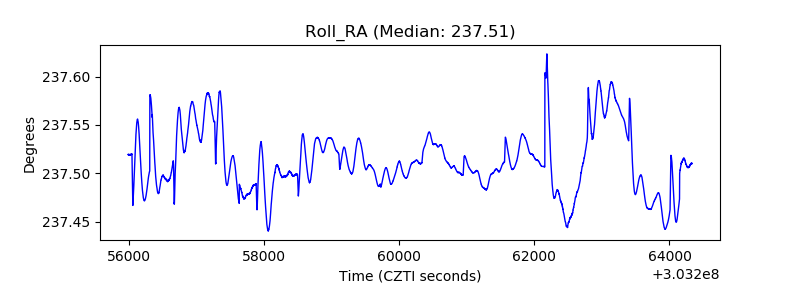 |
| Veto Counter | 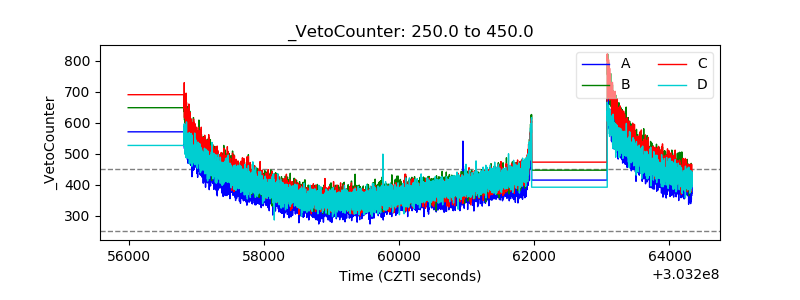 |