| Param | Original file | Final file |
|---|---|---|
| Filename | modeM0/AS1A05_025T17_9000003084cztM0_level2.fits | modeM0/AS1A05_025T17_9000003084cztM0_level2_quad_clean.evt |
| Size (bytes) | 361,984,320 | 331,384,320 |
| Size | 345.2 MB | 316.0 MB |
| Events in quadrant A | 2,257,808 | 1,973,892 |
| Events in quadrant B | 2,145,540 | 1,949,416 |
| Events in quadrant C | 2,238,540 | 1,951,494 |
| Events in quadrant D | 1,929,662 | 1,769,003 |
| Mode SS | |||
|---|---|---|---|
| Quadrant | BADHDUFLAG | Total packets | Discarded packets |
| A | 0 | 706 | 0 |
| B | 0 | 706 | 0 |
| C | 0 | 706 | 0 |
| D | 0 | 706 | 0 |
| Mode M0 | |||
|---|---|---|---|
| Quadrant | BADHDUFLAG | Total packets | Discarded packets |
| A | 0 | 71838 | 0 |
| B | 0 | 77386 | 0 |
| C | 0 | 73023 | 0 |
| D | 0 | 82426 | 0 |
| Mode M9 | |||
|---|---|---|---|
| Quadrant | BADHDUFLAG | Total packets | Discarded packets |
| A | 0 | 71 | 0 |
| B | 0 | 71 | 0 |
| C | 0 | 71 | 0 |
| D | 0 | 71 | 0 |
| Quadrant | Total seconds | Saturated seconds | Saturation percentage |
|---|---|---|---|
| A | 34820 | 432 | 1.240666% |
| B | 34820 | 673 | 1.932797% |
| C | 34820 | 678 | 1.947157% |
| D | 34820 | 853 | 2.449742% |
Noise dominated data is calculated using 1-second bins in cleaned event files. If a bin has >2000 counts, and if more than 50% of those come from <1% of pixels, then it is considered to be noise-dominated and hence unusable.
| Quadrant | # 1 sec bins | Bins with >0 counts | Bins with >2000 counts | High rate bins dominated by noise | Noise dominated (total time) | Noise dominated (detector-on time) | Marked lightcurve |
|---|---|---|---|---|---|---|---|
| A | 41139 | 34819 | 0 | 0 | 0.00% | 0.00% | 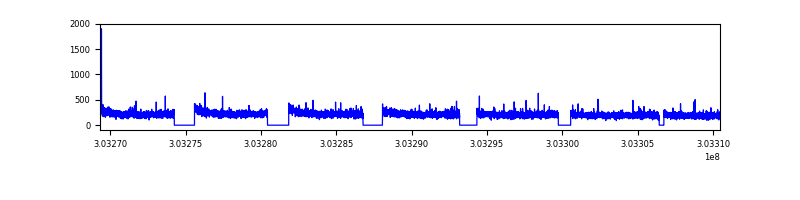 |
| B | 41139 | 34817 | 0 | 0 | 0.00% | 0.00% | 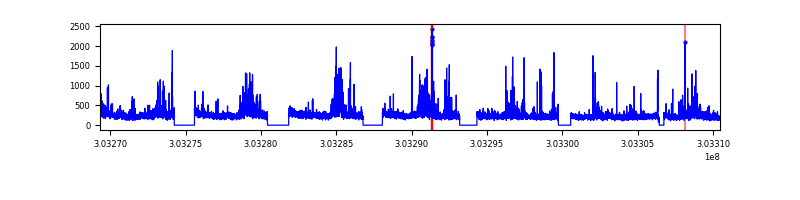 |
| C | 41139 | 34819 | 0 | 0 | 0.00% | 0.00% | 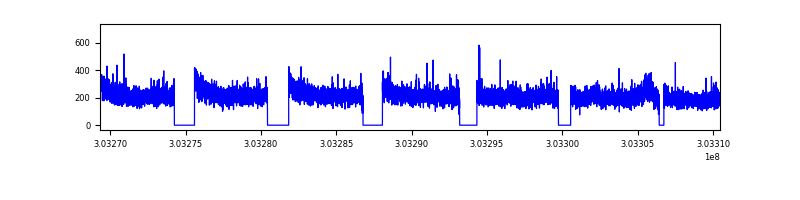 |
| D | 41139 | 34817 | 0 | 0 | 0.00% | 0.00% | 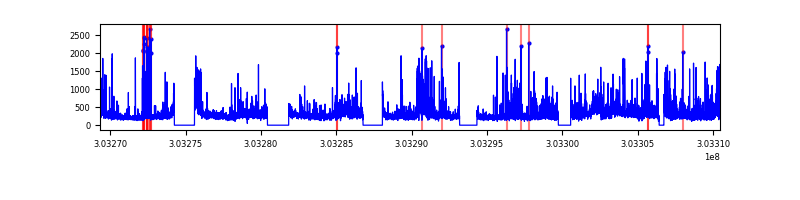 |
Top three noisy pixels from each quadrant. If the there are fewer than three noisy pixels in the level2.evt file, extra rows are filled as -1
| Pixel properties | Quadrant properties | ||||||
|---|---|---|---|---|---|---|---|
| Quadrant | DetID | PixID | Counts | Sigma | Mean | Median | Sigma |
| A | 0 | 29 | 2144 | 11.18 | 587 | 558 | 141.9 |
| A | 7 | 110 | 1769 | 8.54 | 587 | 558 | 141.9 |
| A | 9 | 19 | 1671 | 7.85 | 587 | 558 | 141.9 |
| B | 2 | 9 | 1667 | 10.12 | 569 | 547 | 110.7 |
| B | 5 | 128 | 1404 | 7.74 | 569 | 547 | 110.7 |
| B | 14 | 254 | 1369 | 7.43 | 569 | 547 | 110.7 |
| C | 1 | 81 | 1741 | 7.91 | 590 | 560 | 149.2 |
| C | 1 | 80 | 1686 | 7.55 | 590 | 560 | 149.2 |
| C | 1 | 65 | 1512 | 6.38 | 590 | 560 | 149.2 |
| D | 10 | 189 | 1457 | 6.45 | 552 | 506 | 147.4 |
| D | 6 | 231 | 1423 | 6.22 | 552 | 506 | 147.4 |
| D | 6 | 38 | 1386 | 5.97 | 552 | 506 | 147.4 |
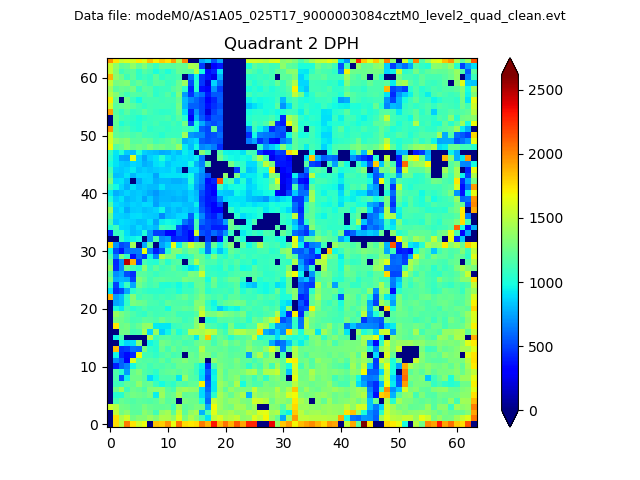
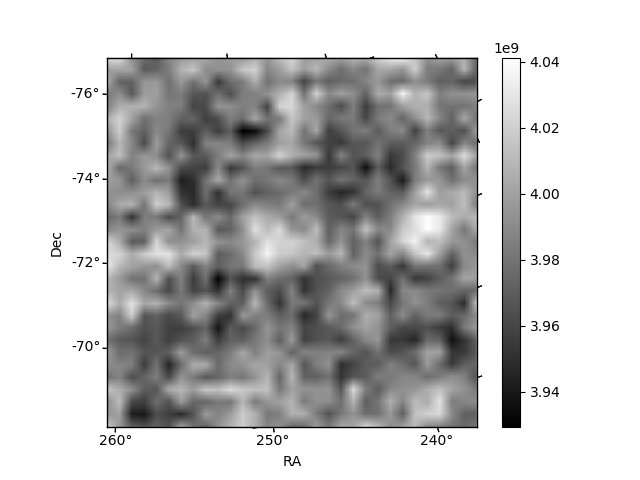
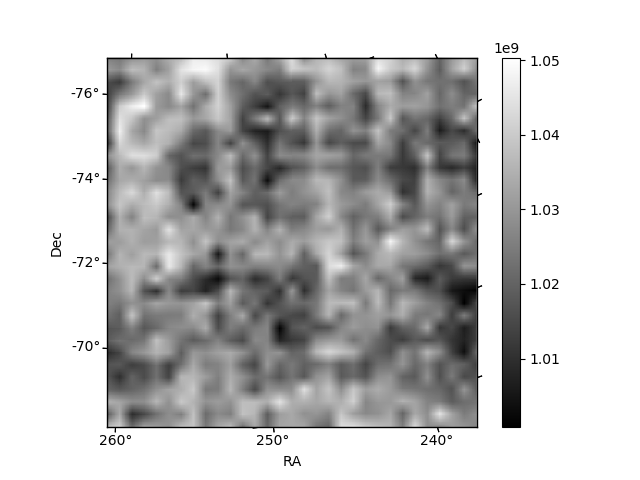
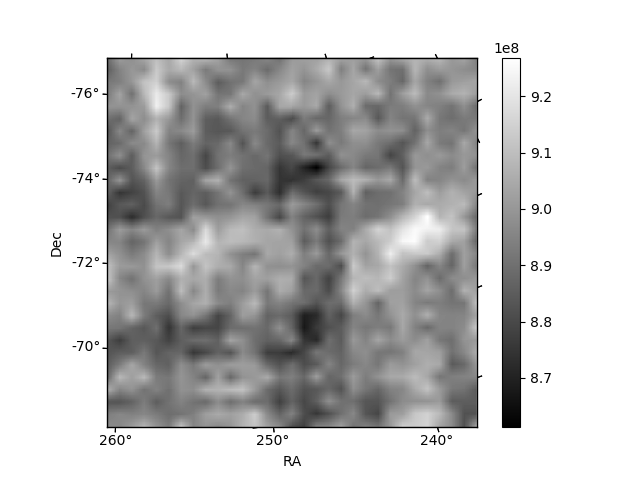
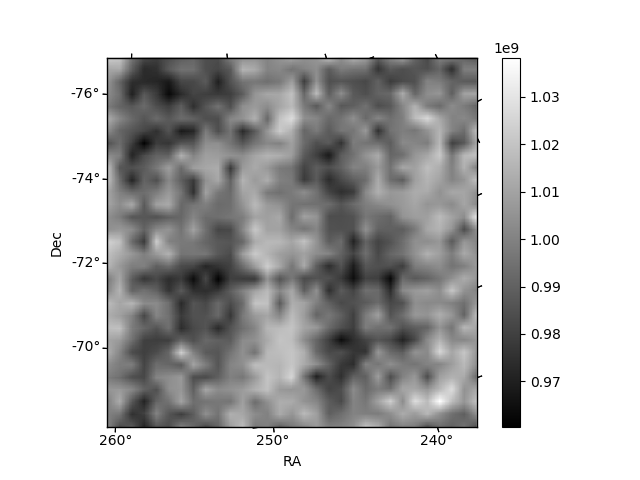
Histogram calculated using DETX and DETY for each event in the final _common_clean file
| Quadrant A | 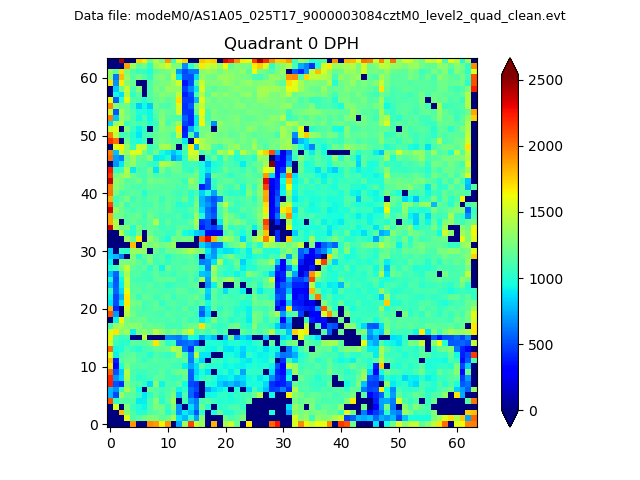 |
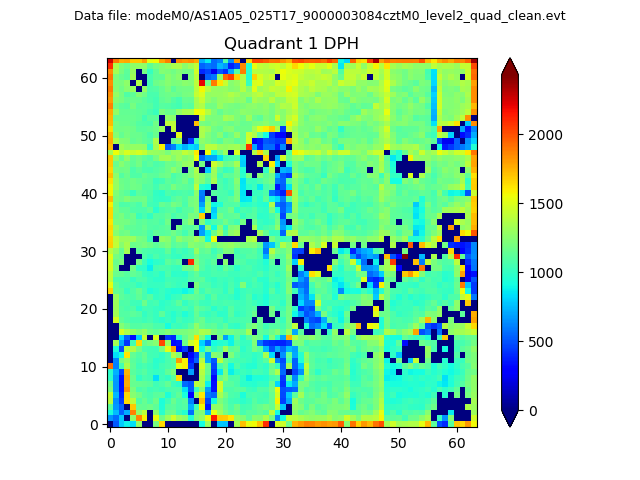 |
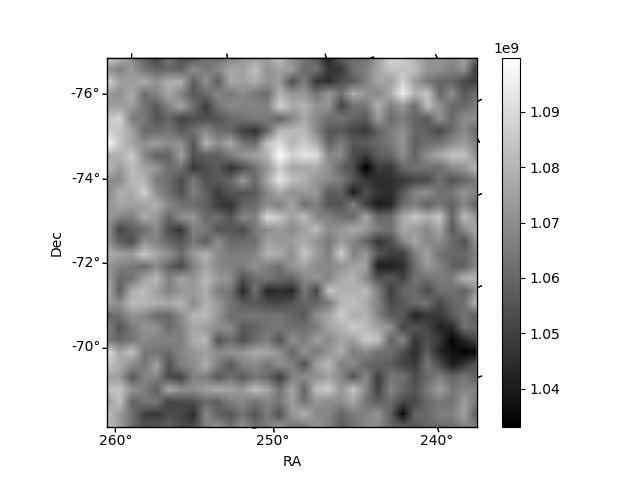
Quadrant B |
|---|---|---|---|
| Quadrant D | 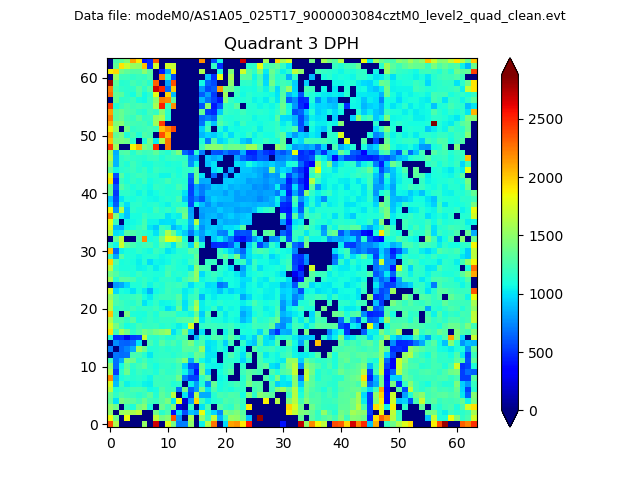 |
 |
Quadrant C |
| Plot type | Count rate plots | Images |
|---|---|---|
| Comparison with Poisson distribution Blue bars denote a histogram of data divided into 1 sec bins. Red curve is a Poisson curve with rate = median count rate of data. |
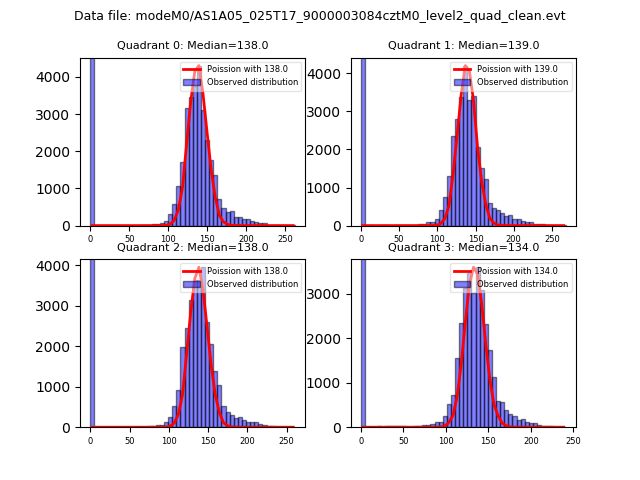 |
 |
| Quadrant-wise count rates Data is divided into 100 sec bins |
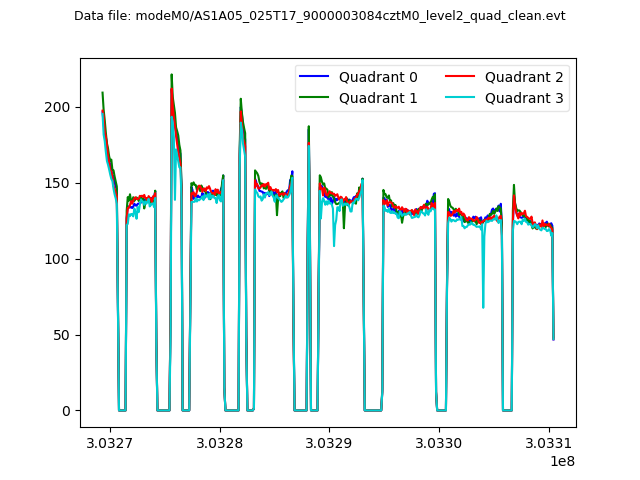 |
|
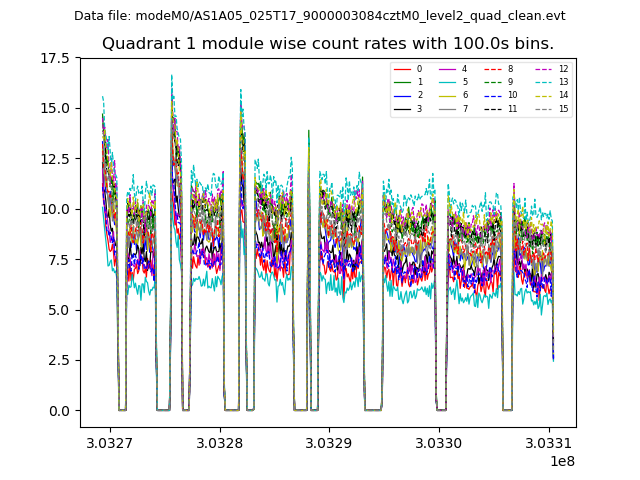
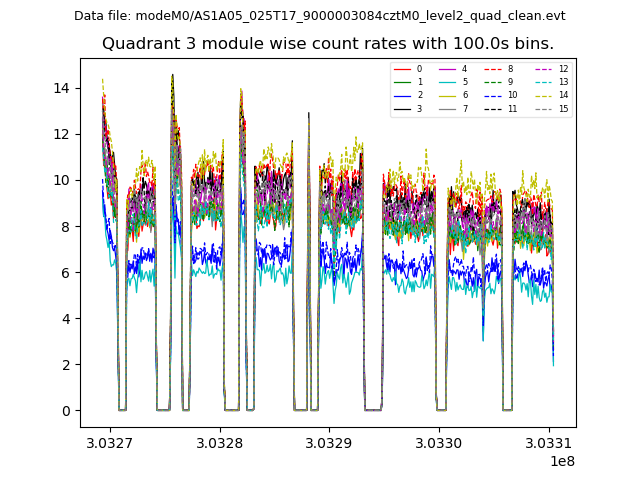
| Module-wise count rates for Quadrant A Data is divided into 100 sec bins |
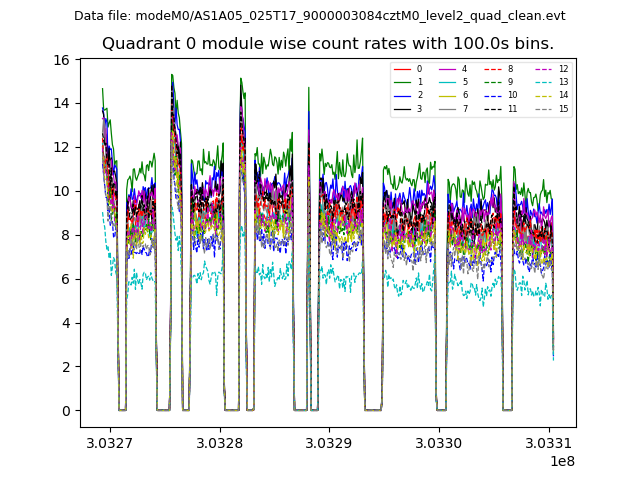 |
 |
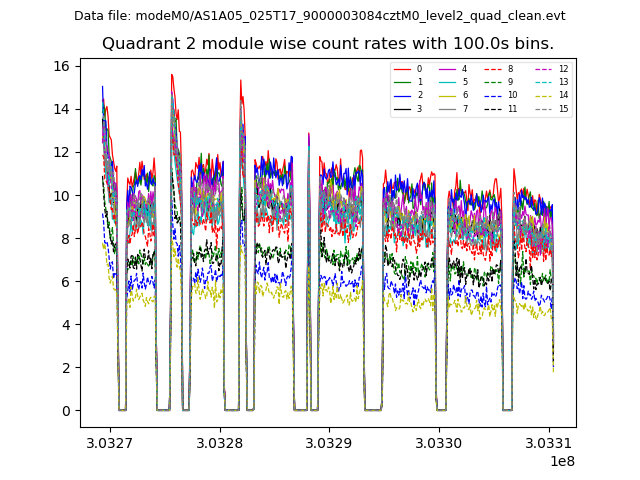
| Module-wise count rates for Quadrant B Data is divided into 100 sec bins |
 |
 |
| Module-wise count rates for Quadrant C Data is divided into 100 sec bins |
 |
 |
| Module-wise count rates for Quadrant D Data is divided into 100 sec bins |
 |
 |
| Parameter | Plot |
|---|---|
| CZT HV Monitor | 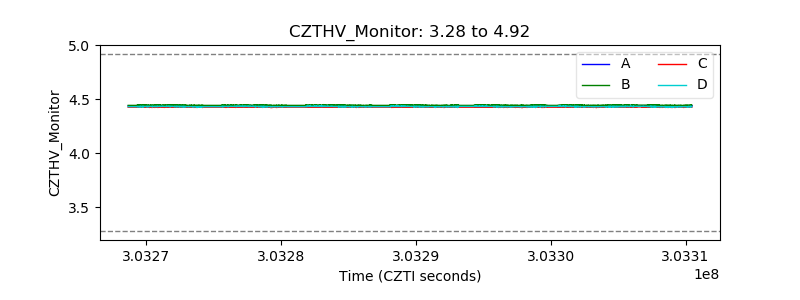 |
| D_VDD | 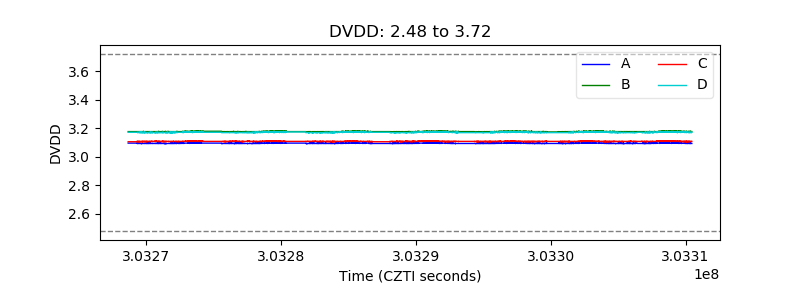 |
| Temperature 1 | 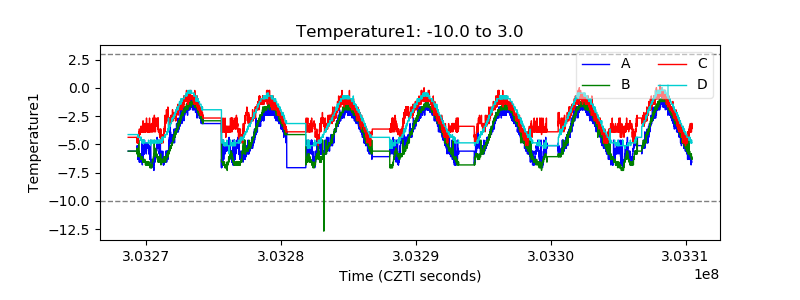 |
| Veto HV Monitor | 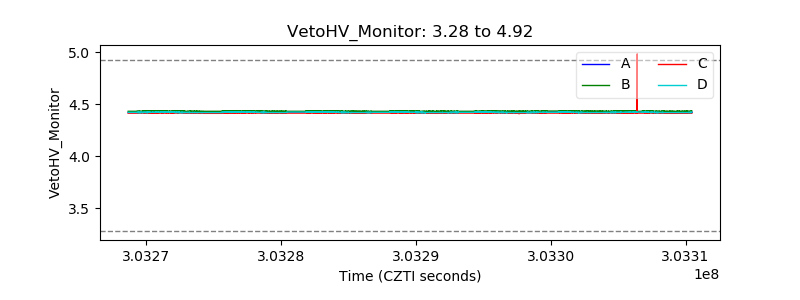 |
| Veto LLD | 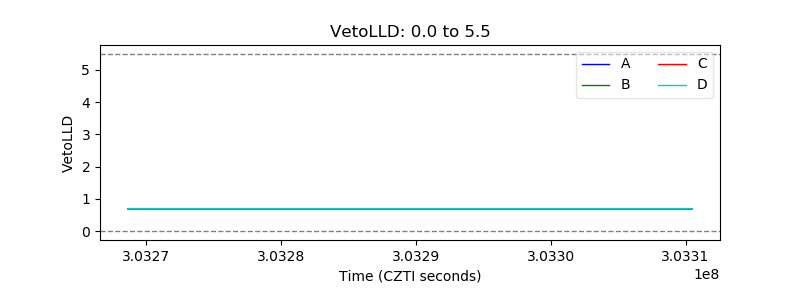 |
| Alpha Counter | 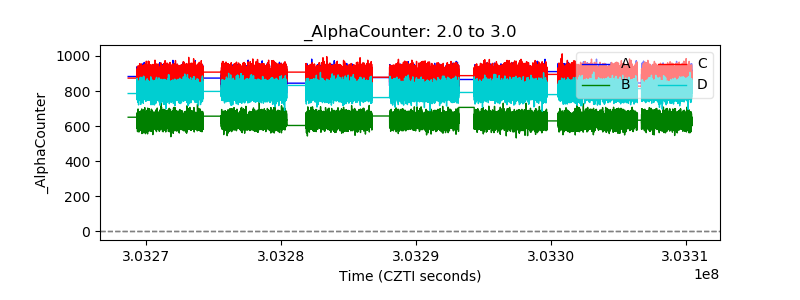 |
| _CPM_Rate | 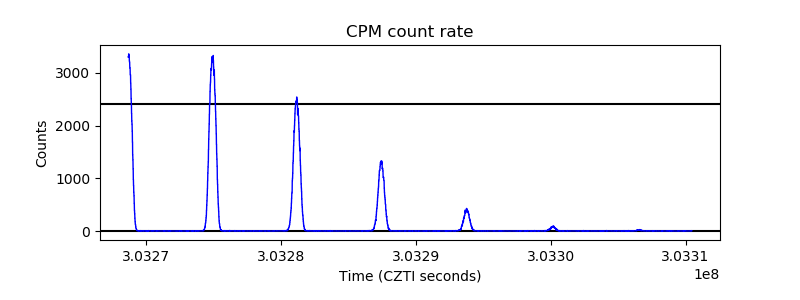 |
| CZT Counter | 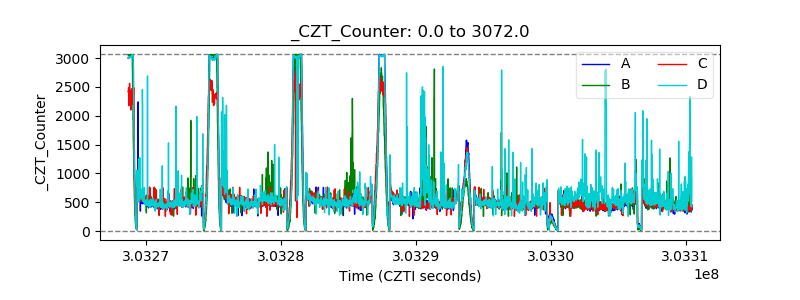 |
| +2.5 Volts monitor | 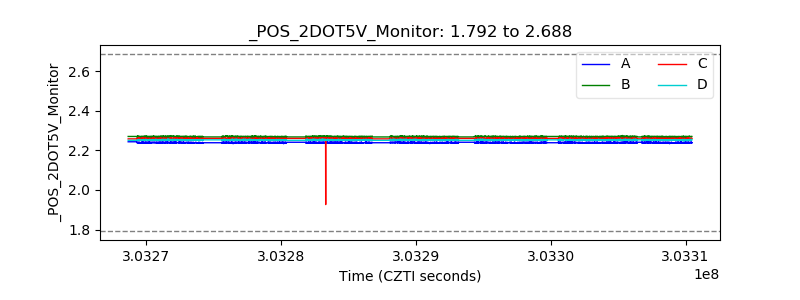 |
| +5 Volts monitor | 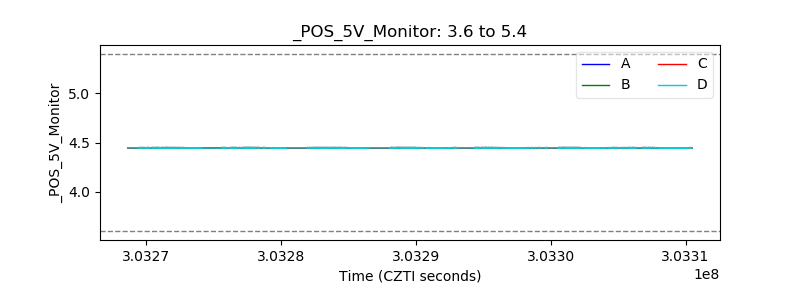 |
| _ROLL_ROT | 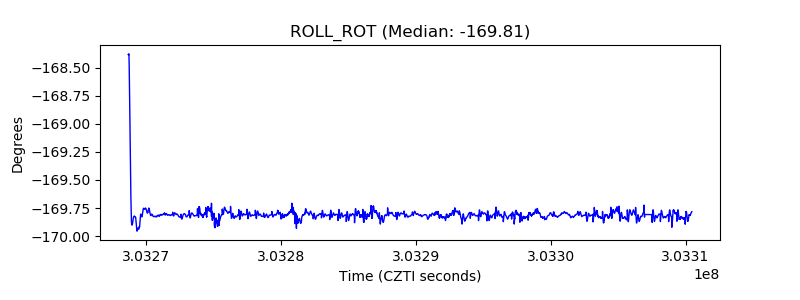 |
| _Roll_DEC | 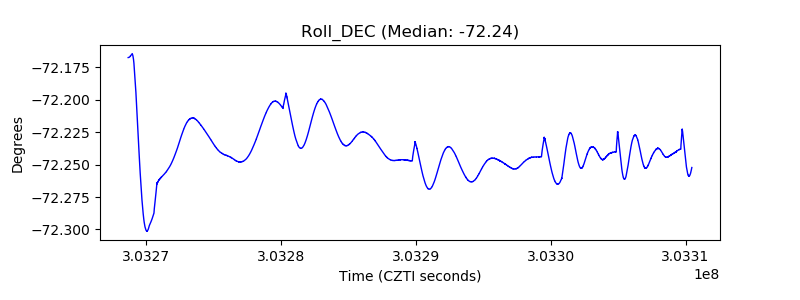 |
| _Roll_RA | 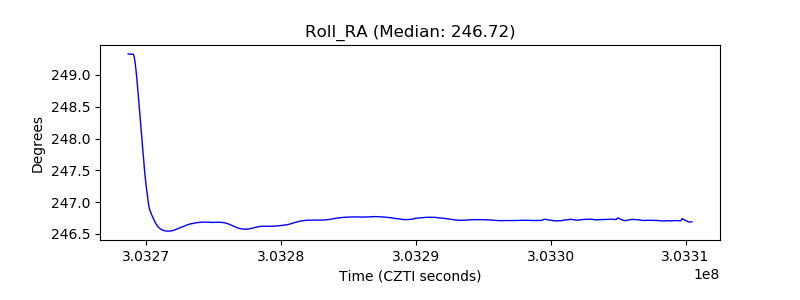 |
| Veto Counter | 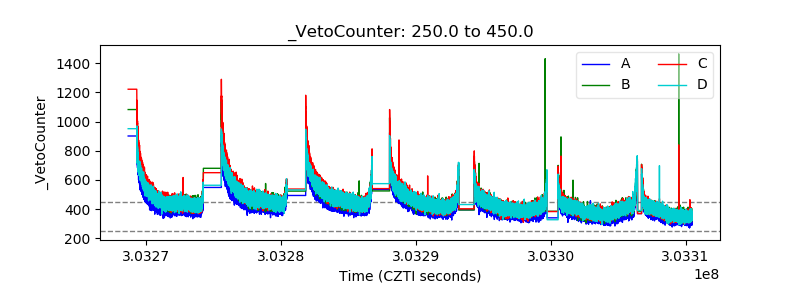 |