| Param | Original file | Final file |
|---|---|---|
| Filename | modeM0/AS1A05_025T17_9000003084_20928cztM0_level2.evt | modeM0/AS1A05_025T17_9000003084_20928cztM0_level2_quad_clean.evt |
| Size (bytes) | 115,513,920 | 35,308,800 |
| Size | 110.2 MB | 33.7 MB |
| Events in quadrant A | 820,829 | 239,893 |
| Events in quadrant B | 862,695 | 248,339 |
| Events in quadrant C | 847,121 | 238,166 |
| Events in quadrant D | 861,671 | 230,206 |
| Mode SS | |||
|---|---|---|---|
| Quadrant | BADHDUFLAG | Total packets | Discarded packets |
| A | 0 | 30 | 0 |
| B | 0 | 30 | 0 |
| C | 0 | 30 | 0 |
| D | 0 | 30 | 0 |
| Mode M0 | |||
|---|---|---|---|
| Quadrant | BADHDUFLAG | Total packets | Discarded packets |
| A | 0 | 3357 | 1 |
| B | 0 | 3487 | 1 |
| C | 0 | 3453 | 1 |
| D | 0 | 3527 | 1 |
| Mode M9 | |||
|---|---|---|---|
| Quadrant | BADHDUFLAG | Total packets | Discarded packets |
| A | 0 | 7 | 0 |
| B | 0 | 7 | 0 |
| C | 0 | 7 | 0 |
| D | 0 | 7 | 0 |
| Quadrant | Total seconds | Saturated seconds | Saturation percentage |
|---|---|---|---|
| A | 1519 | 16 | 1.053325% |
| B | 1519 | 16 | 1.053325% |
| C | 1519 | 29 | 1.909151% |
| D | 1519 | 19 | 1.250823% |
Noise dominated data is calculated using 1-second bins in cleaned event files. If a bin has >2000 counts, and if more than 50% of those come from <1% of pixels, then it is considered to be noise-dominated and hence unusable.
| Quadrant | # 1 sec bins | Bins with >0 counts | Bins with >2000 counts | High rate bins dominated by noise | Noise dominated (total time) | Noise dominated (detector-on time) | Marked lightcurve |
|---|---|---|---|---|---|---|---|
| A | 1519 | 1519 | 6 | 6 | 0.39% | 0.39% | 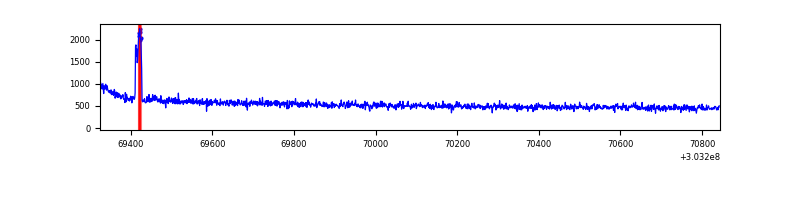 |
| B | 1519 | 1519 | 0 | 0 | 0.00% | 0.00% | 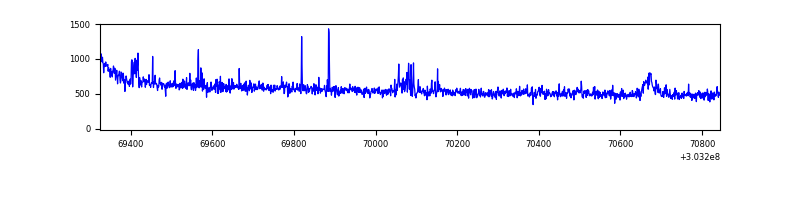 |
| C | 1519 | 1519 | 0 | 0 | 0.00% | 0.00% | 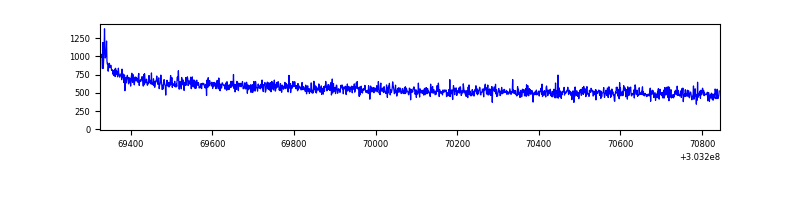 |
| D | 1519 | 1519 | 7 | 7 | 0.46% | 0.46% | 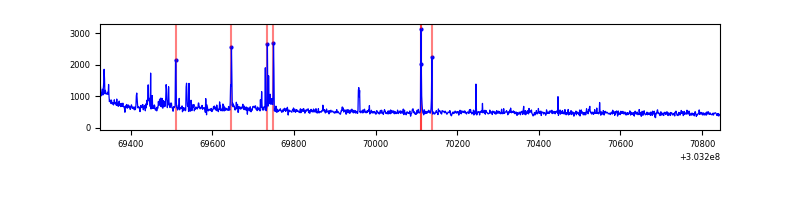 |
Top three noisy pixels from each quadrant. If the there are fewer than three noisy pixels in the level2.evt file, extra rows are filled as -1
| Pixel properties | Quadrant properties | ||||||
|---|---|---|---|---|---|---|---|
| Quadrant | DetID | PixID | Counts | Sigma | Mean | Median | Sigma |
| A | 15 | 174 | 21609 | 504.17 | 207 | 203 | 42.5 |
| A | 0 | 226 | 1847 | 38.72 | 207 | 203 | 42.5 |
| A | 3 | 137 | 1556 | 31.87 | 207 | 203 | 42.5 |
| B | 0 | 230 | 14692 | 359.66 | 212 | 208 | 40.3 |
| B | 3 | 64 | 4498 | 106.53 | 212 | 208 | 40.3 |
| B | 12 | 111 | 4453 | 105.41 | 212 | 208 | 40.3 |
| C | 14 | 238 | 33769 | 690.71 | 207 | 209 | 48.6 |
| C | 9 | 54 | 2874 | 54.85 | 207 | 209 | 48.6 |
| C | 13 | 61 | 1443 | 25.4 | 207 | 209 | 48.6 |
| D | 9 | 1 | 35385 | 702.24 | 204 | 198 | 50.1 |
| D | 7 | 38 | 18951 | 374.26 | 204 | 198 | 50.1 |
| D | 1 | 20 | 15080 | 297.01 | 204 | 198 | 50.1 |
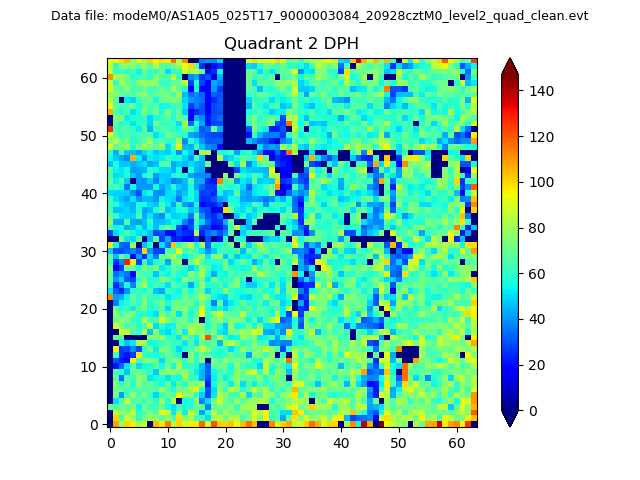
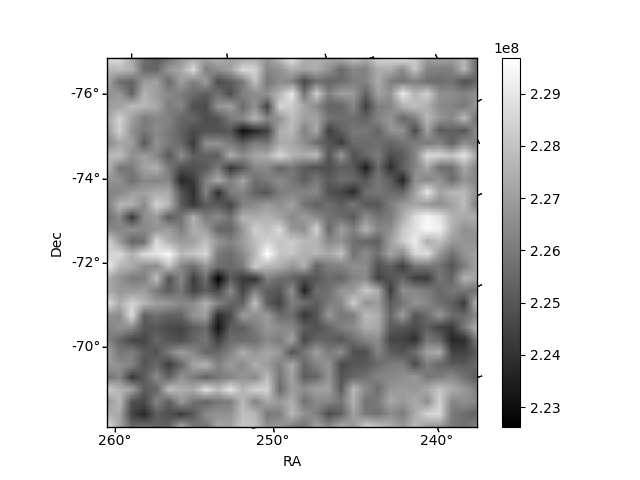
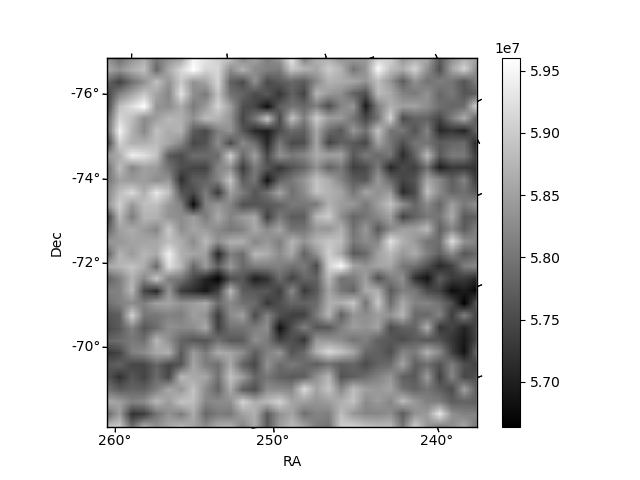
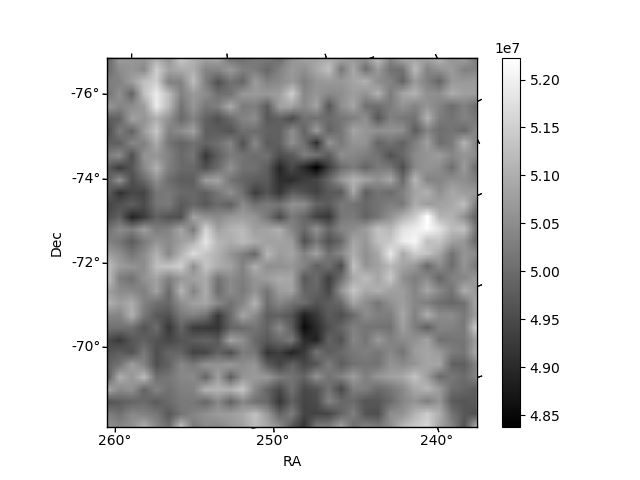
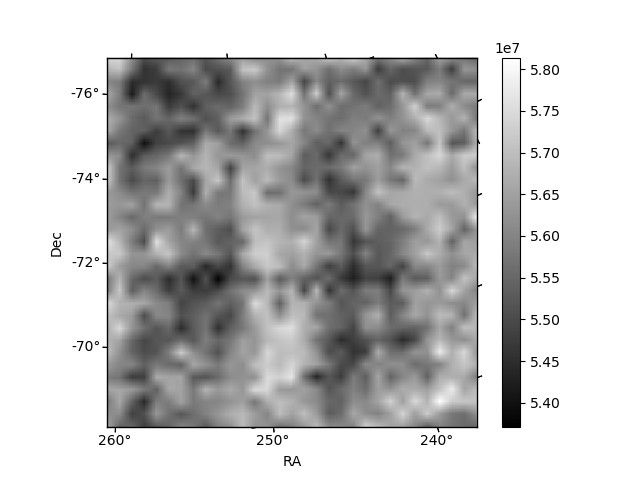
Histogram calculated using DETX and DETY for each event in the final _common_clean file
| Quadrant A | 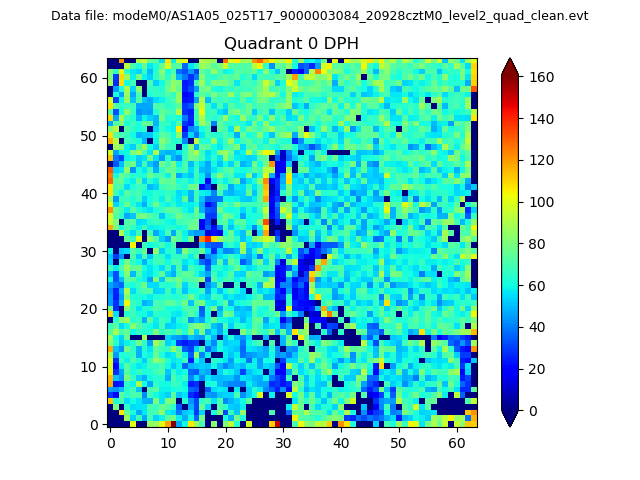 |
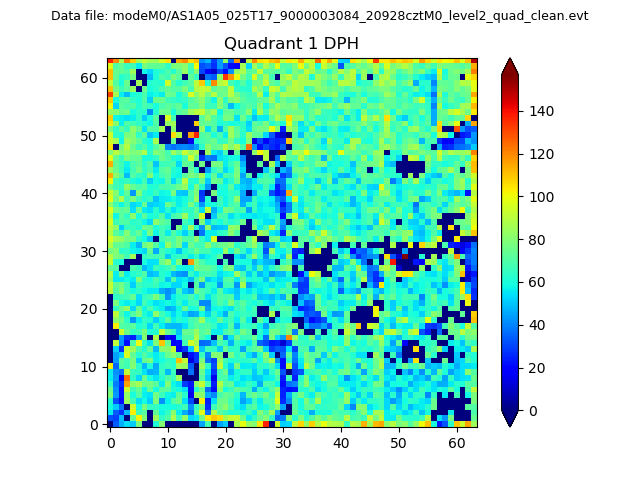 |
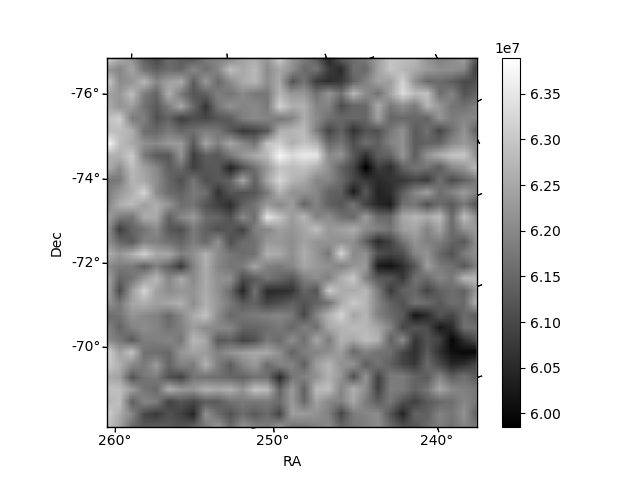
Quadrant B |
|---|---|---|---|
| Quadrant D | 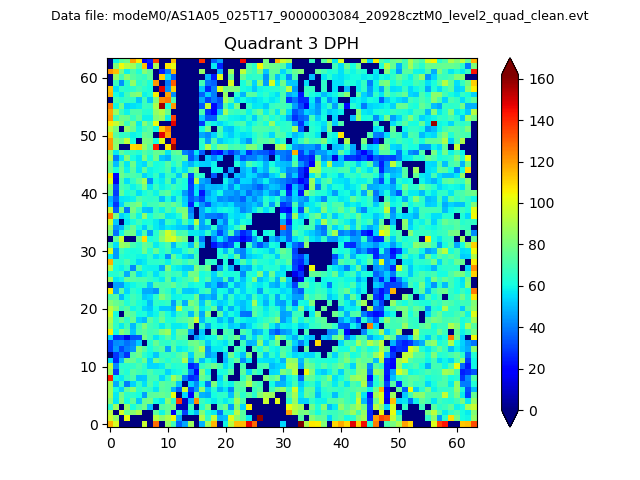 |
 |
Quadrant C |
| Plot type | Count rate plots | Images |
|---|---|---|
| Comparison with Poisson distribution Blue bars denote a histogram of data divided into 1 sec bins. Red curve is a Poisson curve with rate = median count rate of data. |
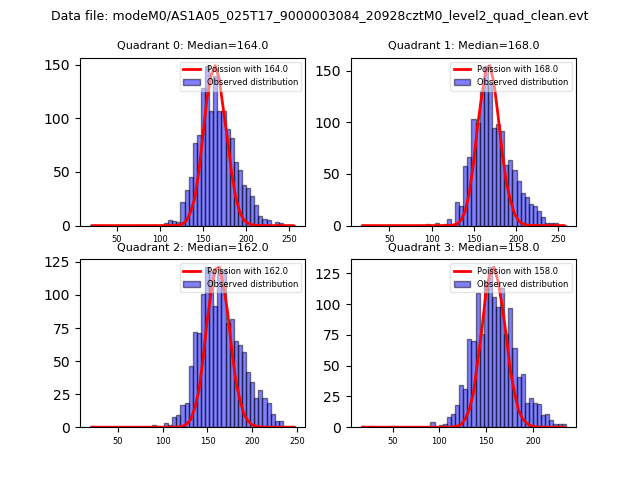 |
 |
| Quadrant-wise count rates Data is divided into 100 sec bins |
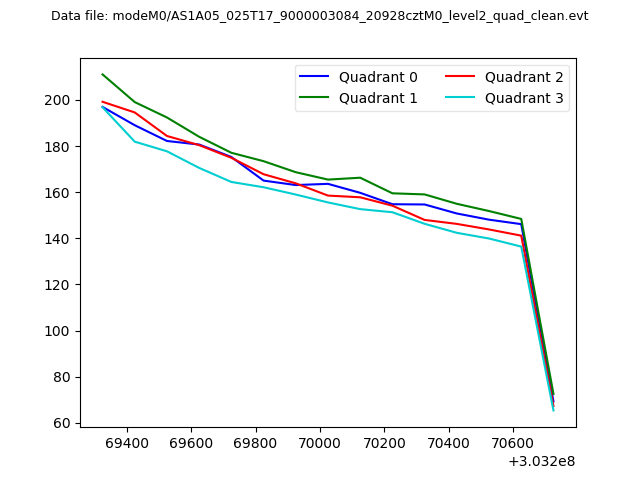 |
|
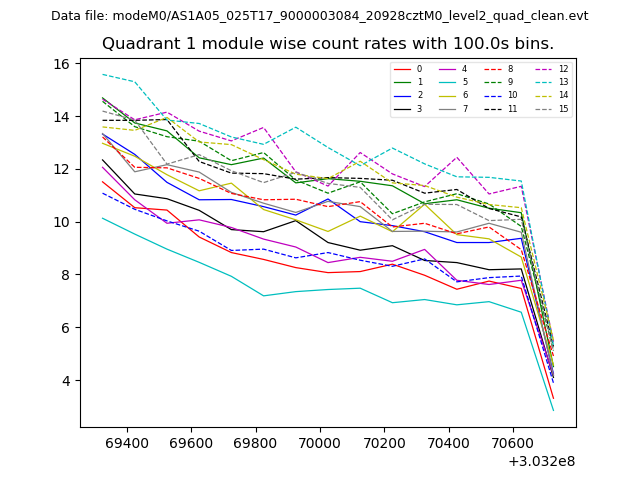
| Module-wise count rates for Quadrant A Data is divided into 100 sec bins |
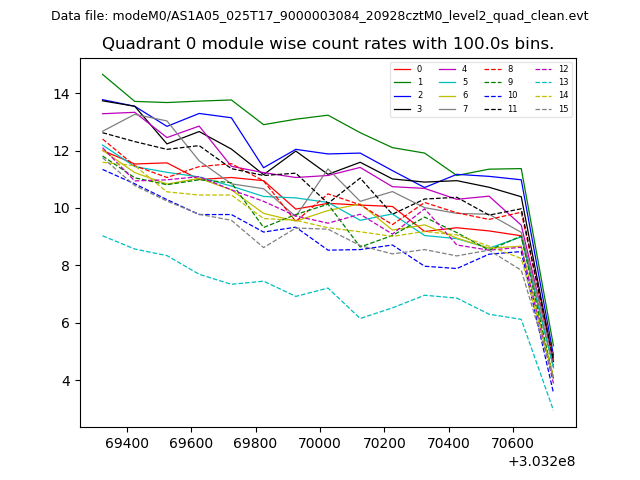 |
 |
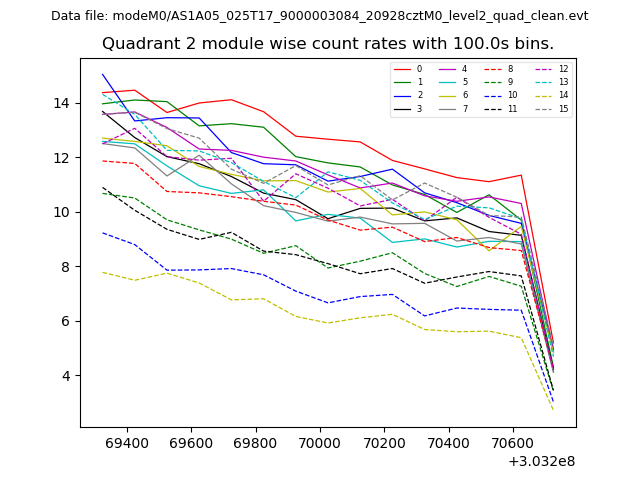
| Module-wise count rates for Quadrant B Data is divided into 100 sec bins |
 |
 |
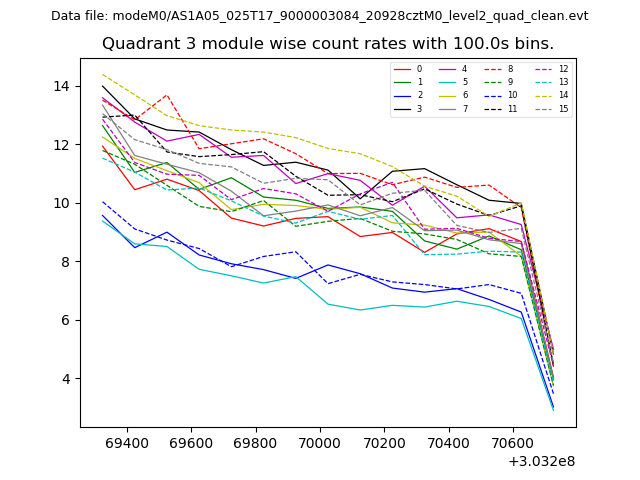
| Module-wise count rates for Quadrant C Data is divided into 100 sec bins |
 |
 |
| Module-wise count rates for Quadrant D Data is divided into 100 sec bins |
 |
 |
| Parameter | Plot |
|---|---|
| CZT HV Monitor | 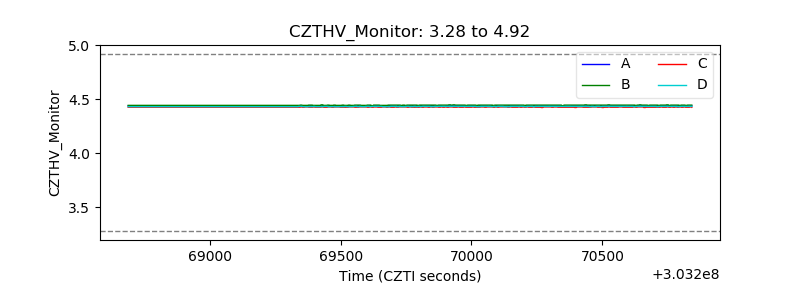 |
| D_VDD | 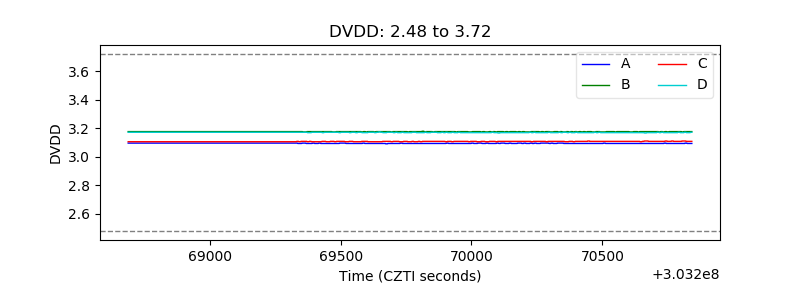 |
| Temperature 1 | 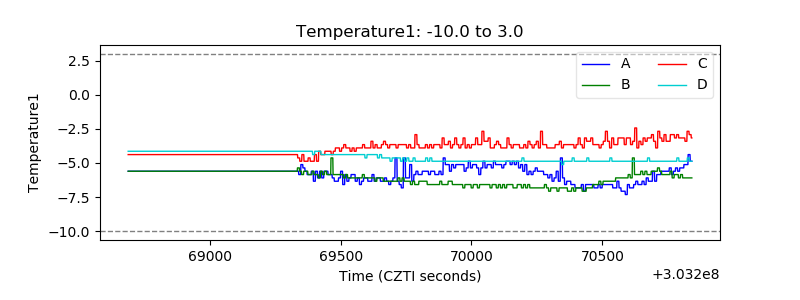 |
| Veto HV Monitor | 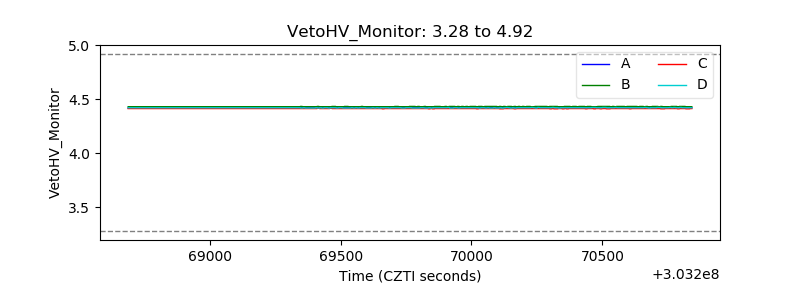 |
| Veto LLD | 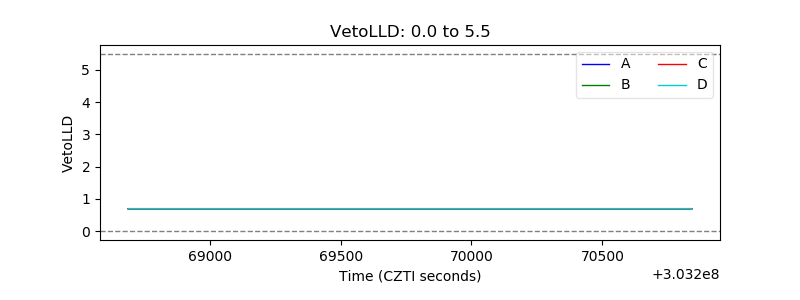 |
| Alpha Counter | 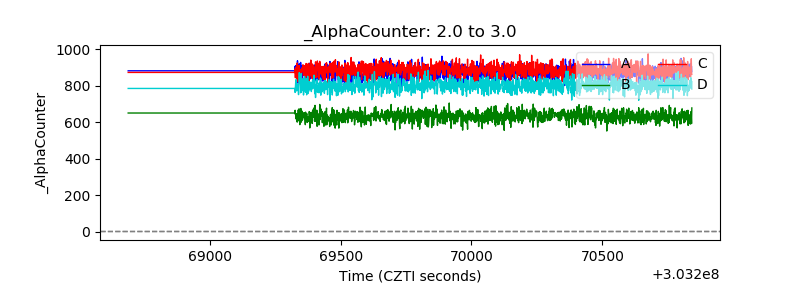 |
| _CPM_Rate | 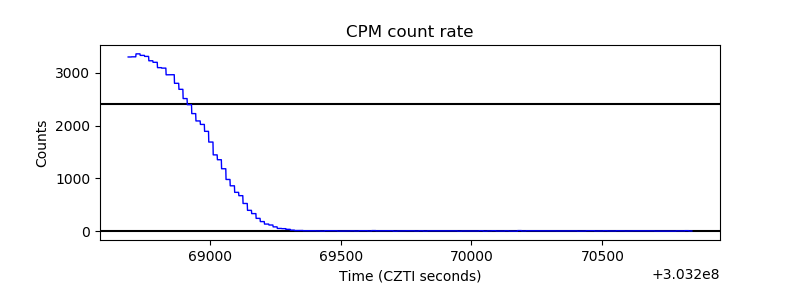 |
| CZT Counter | 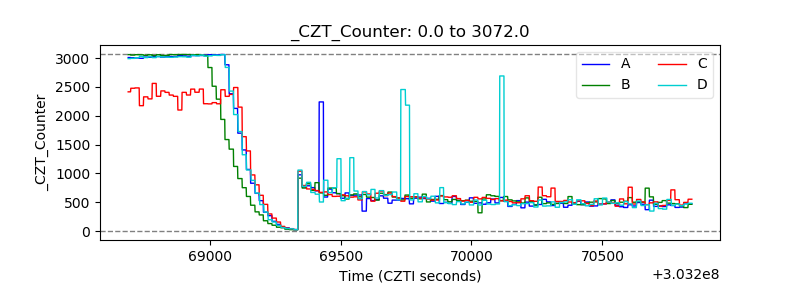 |
| +2.5 Volts monitor | 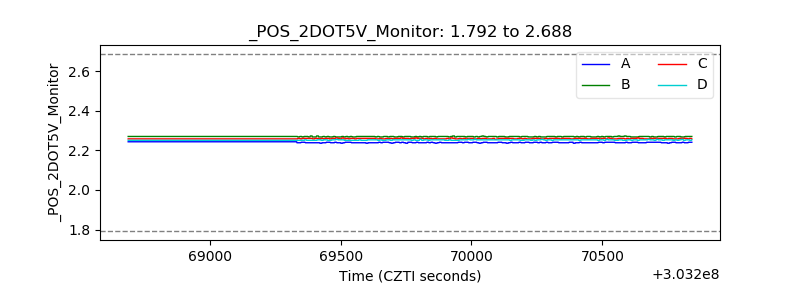 |
| +5 Volts monitor |  |
| _ROLL_ROT | 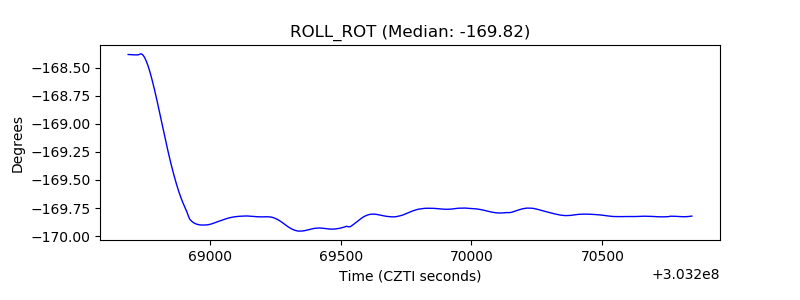 |
| _Roll_DEC | 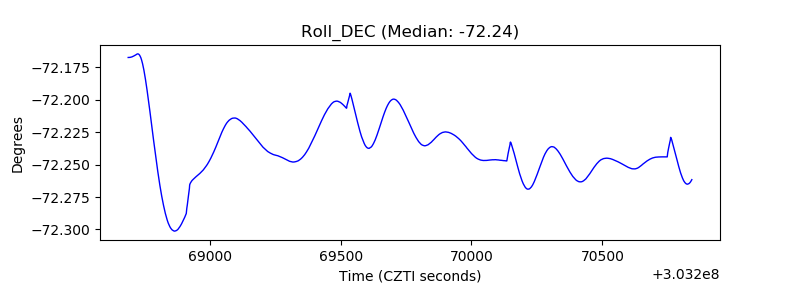 |
| _Roll_RA | 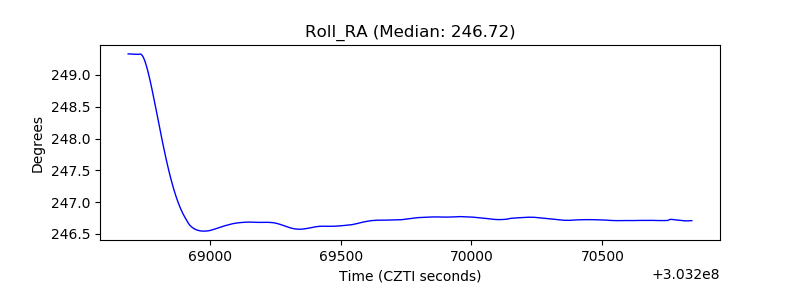 |
| Veto Counter | 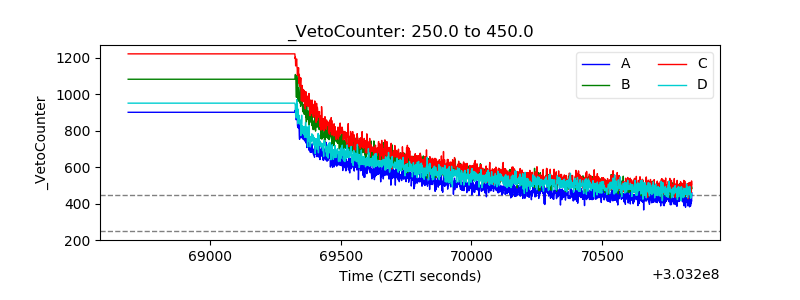 |