| Param | Original file | Final file |
|---|---|---|
| Filename | modeM0/AS1A05_025T17_9000003084_20929cztM0_level2.evt | modeM0/AS1A05_025T17_9000003084_20929cztM0_level2_quad_clean.evt |
| Size (bytes) | 477,613,440 | 120,240,000 |
| Size | 455.5 MB | 114.7 MB |
| Events in quadrant A | 3,269,666 | 801,813 |
| Events in quadrant B | 3,542,054 | 820,730 |
| Events in quadrant C | 3,386,856 | 802,643 |
| Events in quadrant D | 3,828,222 | 766,865 |
| Mode SS | |||
|---|---|---|---|
| Quadrant | BADHDUFLAG | Total packets | Discarded packets |
| A | 0 | 130 | 0 |
| B | 0 | 130 | 0 |
| C | 0 | 130 | 0 |
| D | 0 | 130 | 0 |
| Mode M0 | |||
|---|---|---|---|
| Quadrant | BADHDUFLAG | Total packets | Discarded packets |
| A | 0 | 13610 | 2 |
| B | 0 | 14500 | 2 |
| C | 0 | 13966 | 2 |
| D | 0 | 15400 | 3 |
| Mode M9 | |||
|---|---|---|---|
| Quadrant | BADHDUFLAG | Total packets | Discarded packets |
| A | 0 | 18 | 0 |
| B | 0 | 19 | 0 |
| C | 0 | 19 | 0 |
| D | 0 | 19 | 0 |
| Quadrant | Total seconds | Saturated seconds | Saturation percentage |
|---|---|---|---|
| A | 6451 | 32 | 0.496047% |
| B | 6451 | 53 | 0.821578% |
| C | 6451 | 73 | 1.131608% |
| D | 6450 | 154 | 2.387597% |
Noise dominated data is calculated using 1-second bins in cleaned event files. If a bin has >2000 counts, and if more than 50% of those come from <1% of pixels, then it is considered to be noise-dominated and hence unusable.
| Quadrant | # 1 sec bins | Bins with >0 counts | Bins with >2000 counts | High rate bins dominated by noise | Noise dominated (total time) | Noise dominated (detector-on time) | Marked lightcurve |
|---|---|---|---|---|---|---|---|
| A | 7791 | 6452 | 6 | 6 | 0.08% | 0.09% | 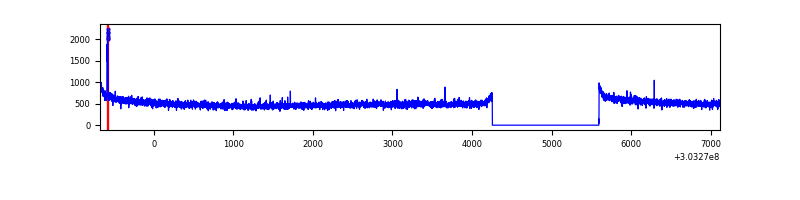 |
| B | 7791 | 6452 | 7 | 7 | 0.09% | 0.11% | 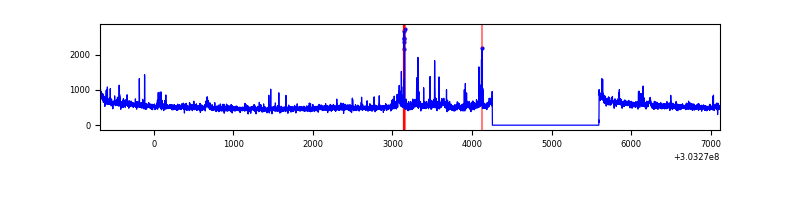 |
| C | 7791 | 6452 | 0 | 0 | 0.00% | 0.00% | 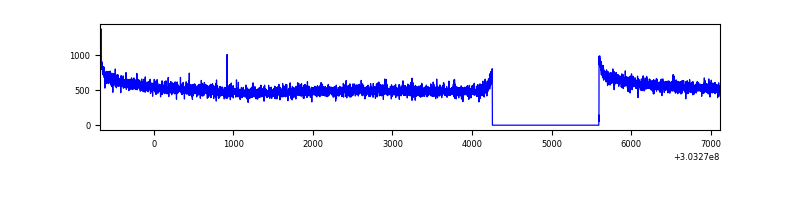 |
| D | 7790 | 6451 | 123 | 123 | 1.58% | 1.91% | 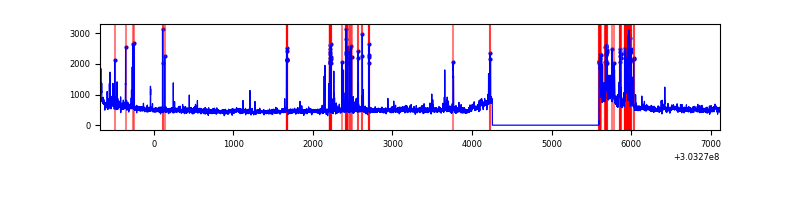 |
Top three noisy pixels from each quadrant. If the there are fewer than three noisy pixels in the level2.evt file, extra rows are filled as -1
| Pixel properties | Quadrant properties | ||||||
|---|---|---|---|---|---|---|---|
| Quadrant | DetID | PixID | Counts | Sigma | Mean | Median | Sigma |
| A | 15 | 174 | 23822 | 139.32 | 844 | 830 | 165.0 |
| A | 0 | 226 | 7295 | 39.18 | 844 | 830 | 165.0 |
| A | 3 | 137 | 6221 | 32.67 | 844 | 830 | 165.0 |
| B | 0 | 229 | 57779 | 369.03 | 851 | 832 | 154.3 |
| B | 7 | 220 | 34175 | 216.07 | 851 | 832 | 154.3 |
| B | 0 | 230 | 33361 | 210.79 | 851 | 832 | 154.3 |
| C | 14 | 238 | 134702 | 703.92 | 832 | 840 | 190.2 |
| C | 13 | 61 | 5837 | 26.27 | 832 | 840 | 190.2 |
| C | 7 | 247 | 4103 | 17.16 | 832 | 840 | 190.2 |
| D | 9 | 1 | 364464 | 1838.22 | 827 | 803 | 197.8 |
| D | 1 | 52 | 210051 | 1057.7 | 827 | 803 | 197.8 |
| D | 1 | 20 | 52840 | 263.03 | 827 | 803 | 197.8 |
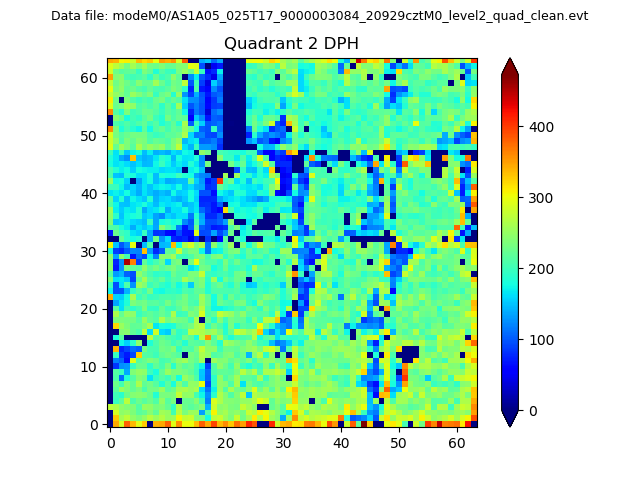
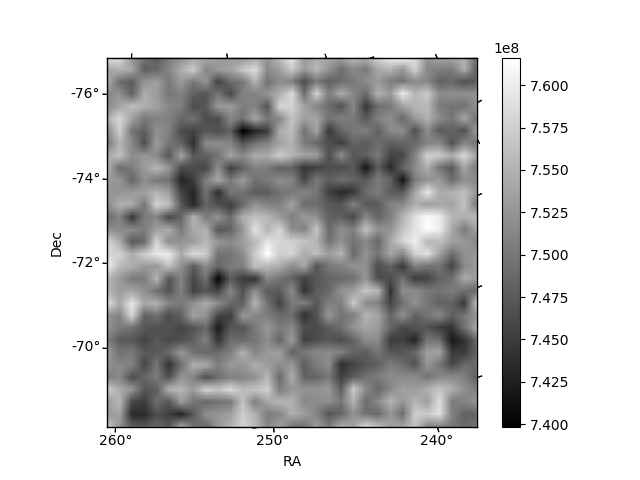
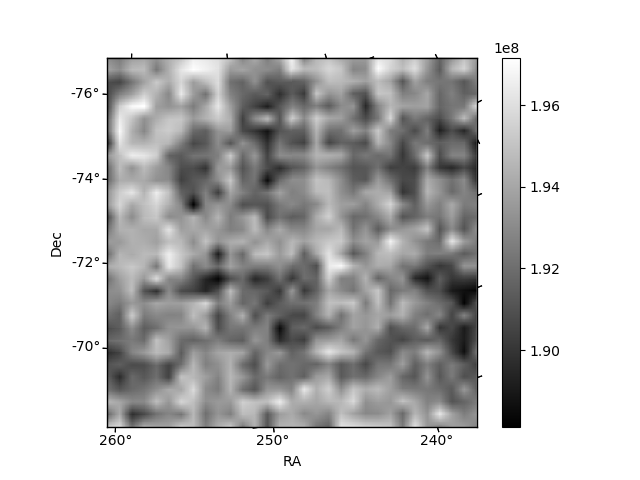
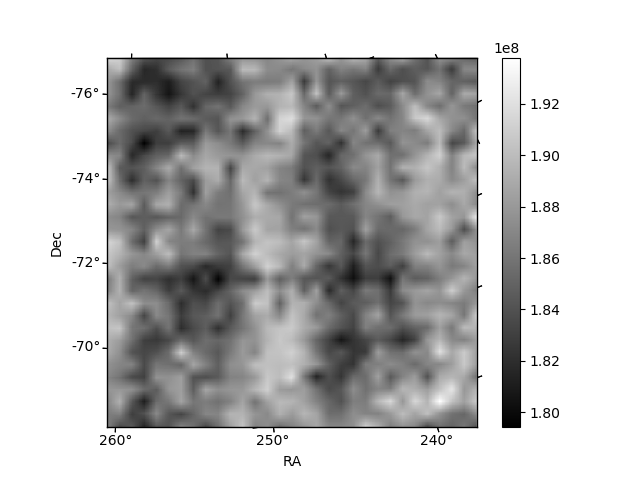
Histogram calculated using DETX and DETY for each event in the final _common_clean file
| Quadrant A | 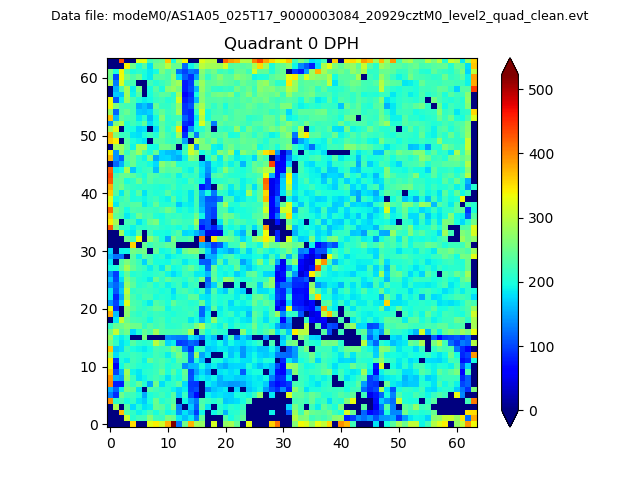 |
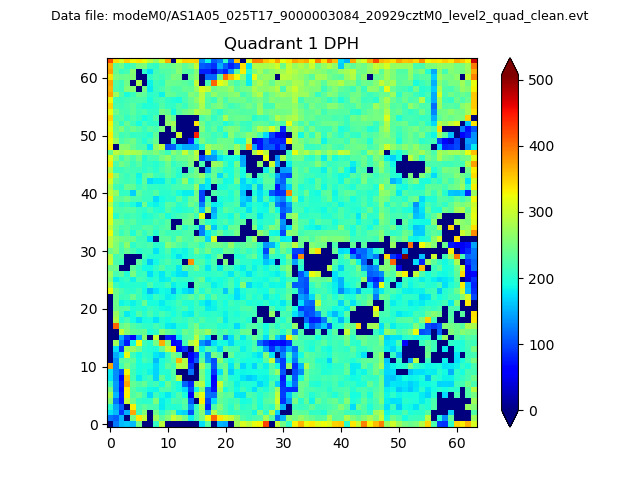 |
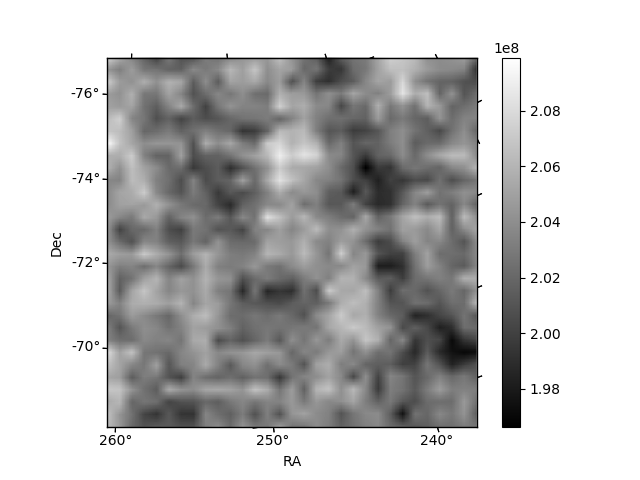
Quadrant B |
|---|---|---|---|
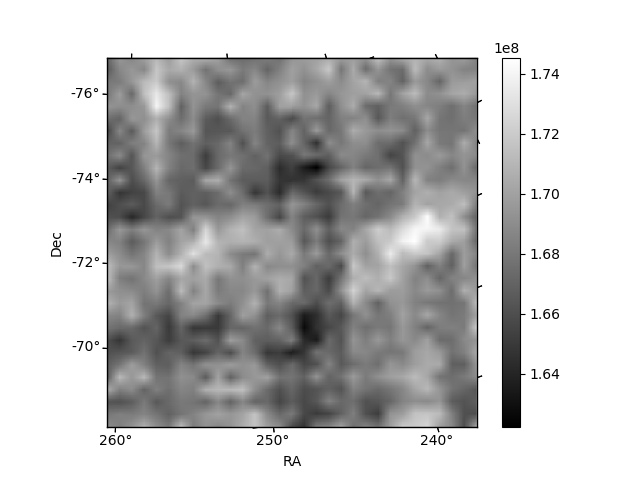
| Quadrant D | 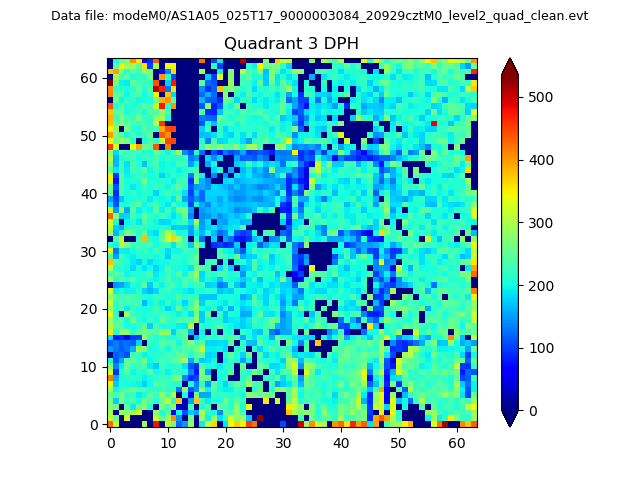 |
 |
Quadrant C |
| Plot type | Count rate plots | Images |
|---|---|---|
| Comparison with Poisson distribution Blue bars denote a histogram of data divided into 1 sec bins. Red curve is a Poisson curve with rate = median count rate of data. |
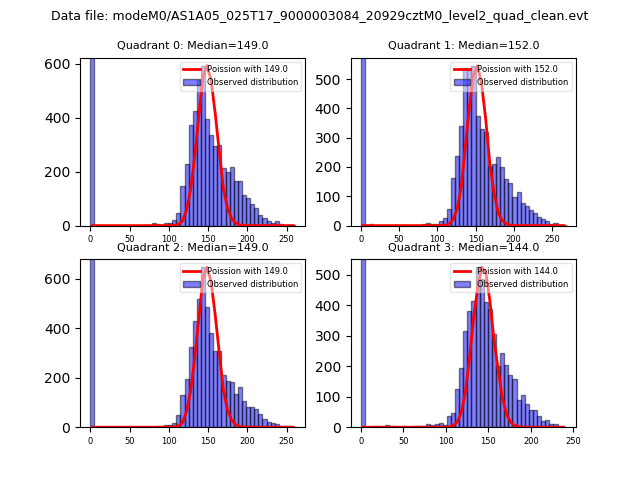 |
 |
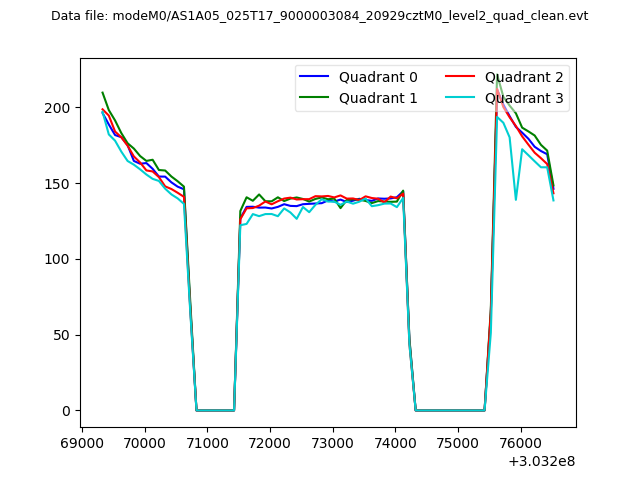
| Quadrant-wise count rates Data is divided into 100 sec bins |
 |
|
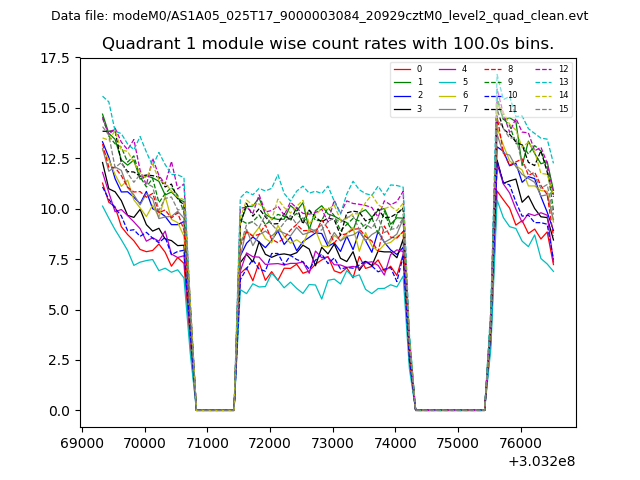
| Module-wise count rates for Quadrant A Data is divided into 100 sec bins |
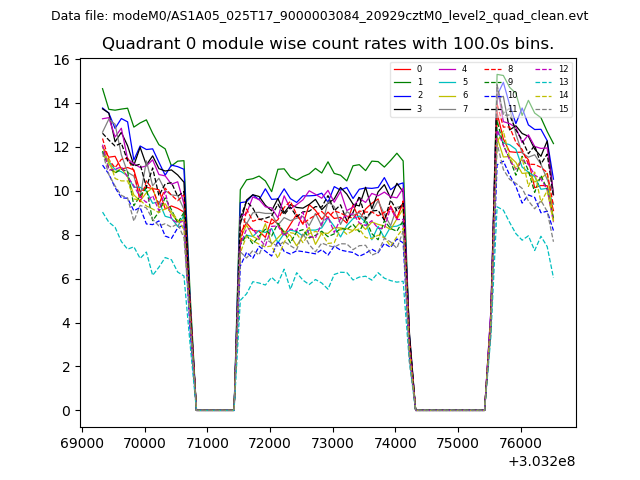 |
 |
| Module-wise count rates for Quadrant B Data is divided into 100 sec bins |
 |
 |
| Module-wise count rates for Quadrant C Data is divided into 100 sec bins |
 |
 |
| Module-wise count rates for Quadrant D Data is divided into 100 sec bins |
 |
 |
| Parameter | Plot |
|---|---|
| CZT HV Monitor | 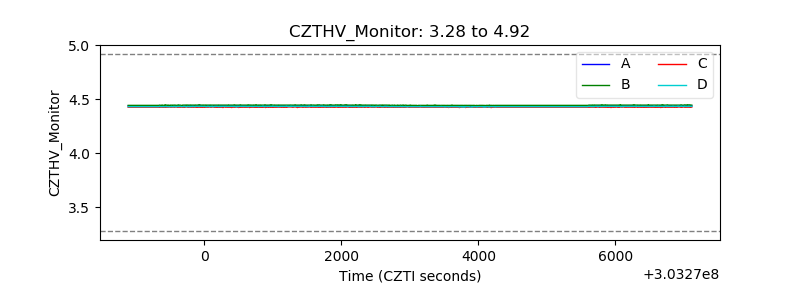 |
| D_VDD |  |
| Temperature 1 |  |
| Veto HV Monitor | 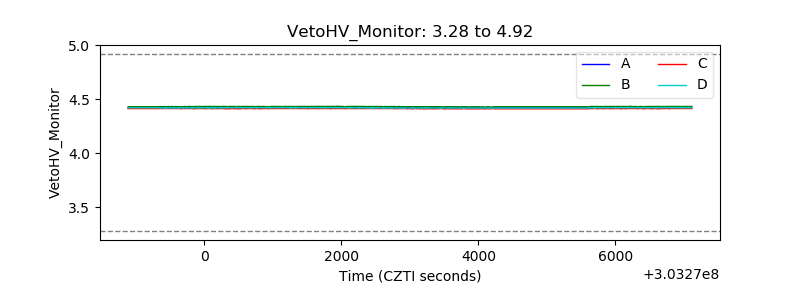 |
| Veto LLD |  |
| Alpha Counter | 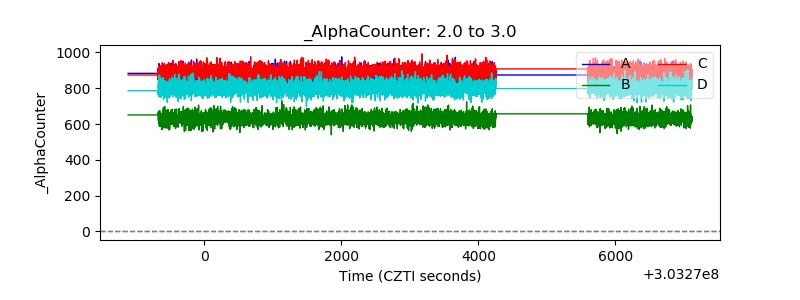 |
| _CPM_Rate | 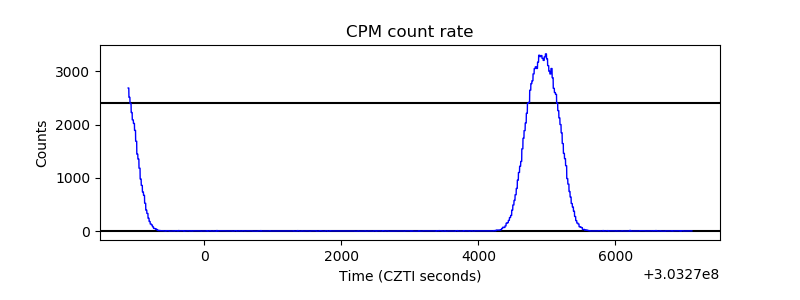 |
| CZT Counter | 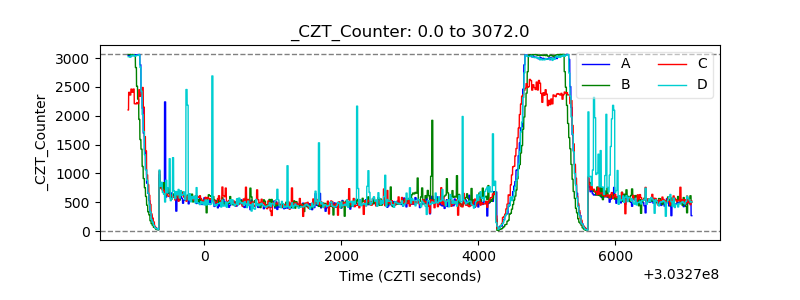 |
| +2.5 Volts monitor |  |
| +5 Volts monitor |  |
| _ROLL_ROT |  |
| _Roll_DEC | 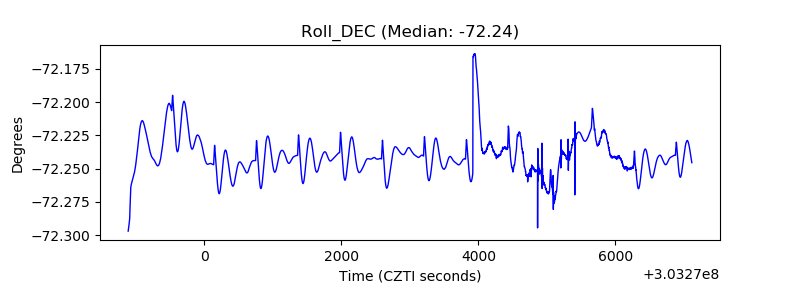 |
| _Roll_RA | 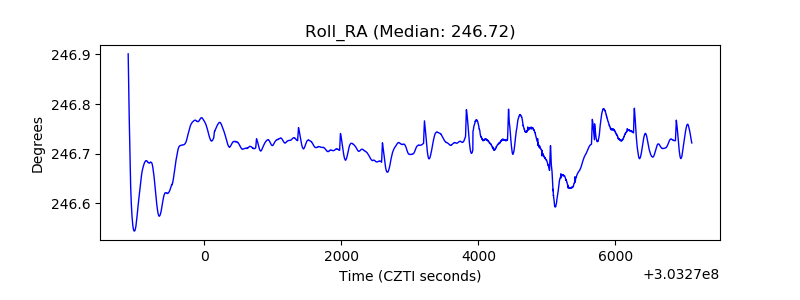 |
| Veto Counter | 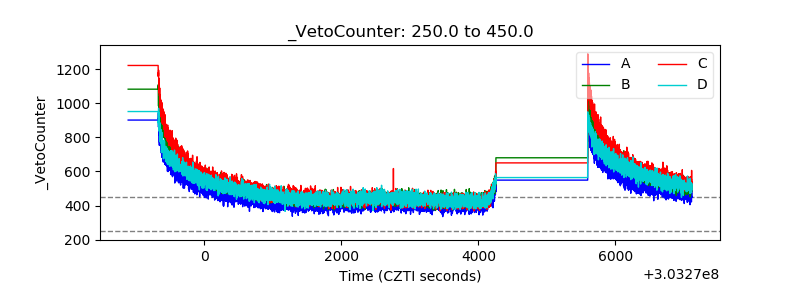 |