| Param | Original file | Final file |
|---|---|---|
| Filename | modeM0/AS1A05_025T17_9000003084_20930cztM0_level2.evt | modeM0/AS1A05_025T17_9000003084_20930cztM0_level2_quad_clean.evt |
| Size (bytes) | 398,943,360 | 91,926,720 |
| Size | 380.5 MB | 87.7 MB |
| Events in quadrant A | 2,777,167 | 602,365 |
| Events in quadrant B | 3,103,823 | 612,447 |
| Events in quadrant C | 2,886,793 | 602,469 |
| Events in quadrant D | 2,941,157 | 582,596 |
| Mode SS | |||
|---|---|---|---|
| Quadrant | BADHDUFLAG | Total packets | Discarded packets |
| A | 0 | 112 | 0 |
| B | 0 | 112 | 0 |
| C | 0 | 112 | 0 |
| D | 0 | 112 | 0 |
| Mode M0 | |||
|---|---|---|---|
| Quadrant | BADHDUFLAG | Total packets | Discarded packets |
| A | 0 | 11372 | 1 |
| B | 0 | 12497 | 1 |
| C | 0 | 11688 | 1 |
| D | 0 | 11875 | 1 |
| Mode M9 | |||
|---|---|---|---|
| Quadrant | BADHDUFLAG | Total packets | Discarded packets |
| A | 0 | 14 | 0 |
| B | 0 | 14 | 0 |
| C | 0 | 14 | 0 |
| D | 0 | 14 | 0 |
| Quadrant | Total seconds | Saturated seconds | Saturation percentage |
|---|---|---|---|
| A | 5487 | 7 | 0.127574% |
| B | 5487 | 42 | 0.765446% |
| C | 5487 | 77 | 1.403317% |
| D | 5487 | 11 | 0.200474% |
Noise dominated data is calculated using 1-second bins in cleaned event files. If a bin has >2000 counts, and if more than 50% of those come from <1% of pixels, then it is considered to be noise-dominated and hence unusable.
| Quadrant | # 1 sec bins | Bins with >0 counts | Bins with >2000 counts | High rate bins dominated by noise | Noise dominated (total time) | Noise dominated (detector-on time) | Marked lightcurve |
|---|---|---|---|---|---|---|---|
| A | 6897 | 5488 | 0 | 0 | 0.00% | 0.00% | 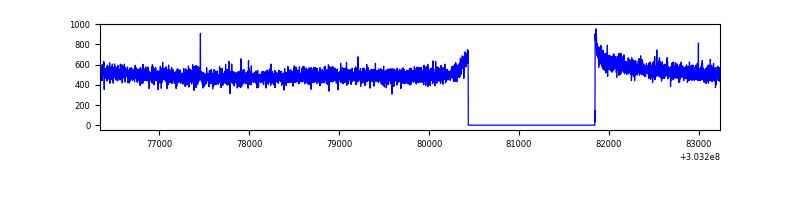 |
| B | 6897 | 5488 | 10 | 10 | 0.14% | 0.18% | 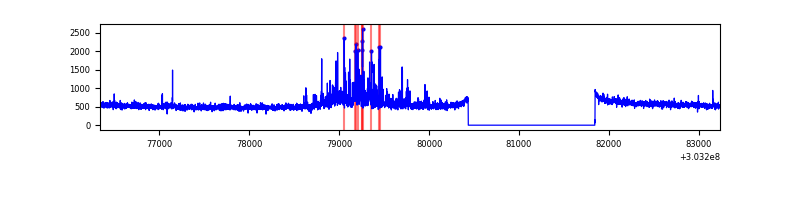 |
| C | 6897 | 5488 | 0 | 0 | 0.00% | 0.00% | 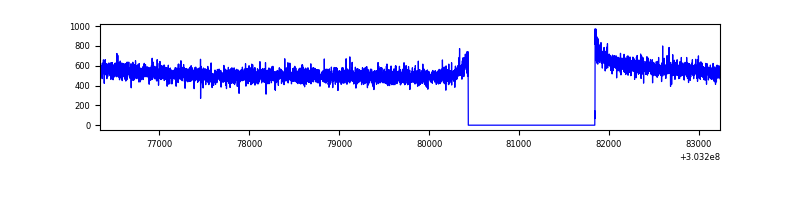 |
| D | 6897 | 5488 | 4 | 4 | 0.06% | 0.07% | 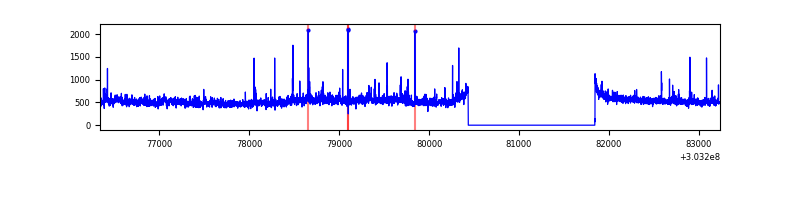 |
Top three noisy pixels from each quadrant. If the there are fewer than three noisy pixels in the level2.evt file, extra rows are filled as -1
| Pixel properties | Quadrant properties | ||||||
|---|---|---|---|---|---|---|---|
| Quadrant | DetID | PixID | Counts | Sigma | Mean | Median | Sigma |
| A | 0 | 226 | 6281 | 39.21 | 722 | 709 | 142.1 |
| A | 3 | 137 | 5161 | 31.33 | 722 | 709 | 142.1 |
| A | 12 | 194 | 5094 | 30.86 | 722 | 709 | 142.1 |
| B | 7 | 220 | 177093 | 1344.93 | 721 | 705 | 131.2 |
| B | 0 | 229 | 44844 | 336.55 | 721 | 705 | 131.2 |
| B | 0 | 219 | 33962 | 253.58 | 721 | 705 | 131.2 |
| C | 14 | 238 | 116174 | 712.8 | 708 | 715 | 162.0 |
| C | 7 | 247 | 8691 | 49.24 | 708 | 715 | 162.0 |
| C | 13 | 61 | 5153 | 27.4 | 708 | 715 | 162.0 |
| D | 1 | 52 | 173466 | 1021.88 | 713 | 695 | 169.1 |
| D | 2 | 234 | 18160 | 103.3 | 713 | 695 | 169.1 |
| D | 9 | 1 | 16501 | 93.49 | 713 | 695 | 169.1 |
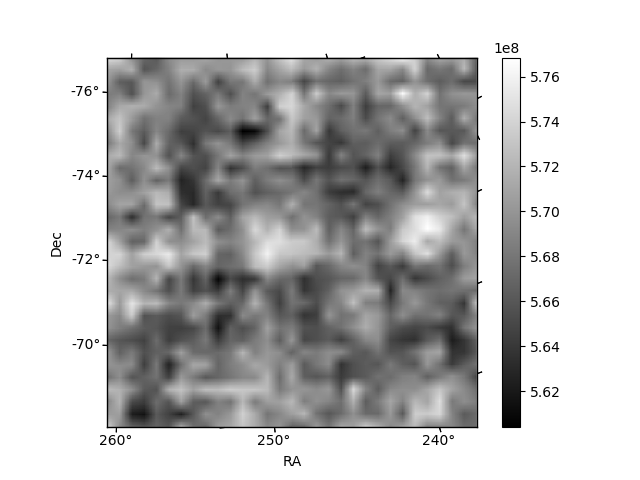
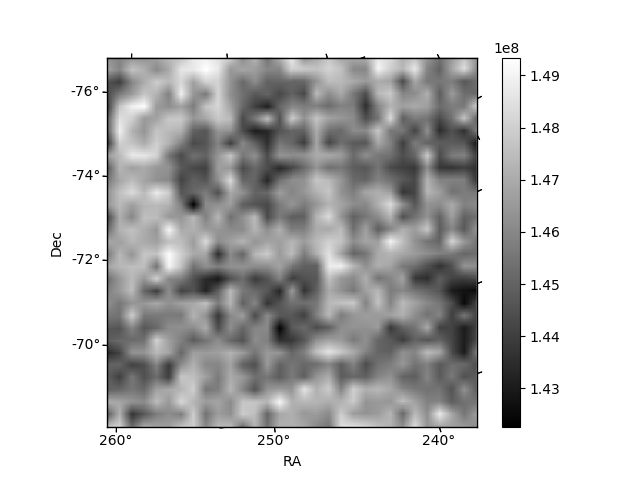
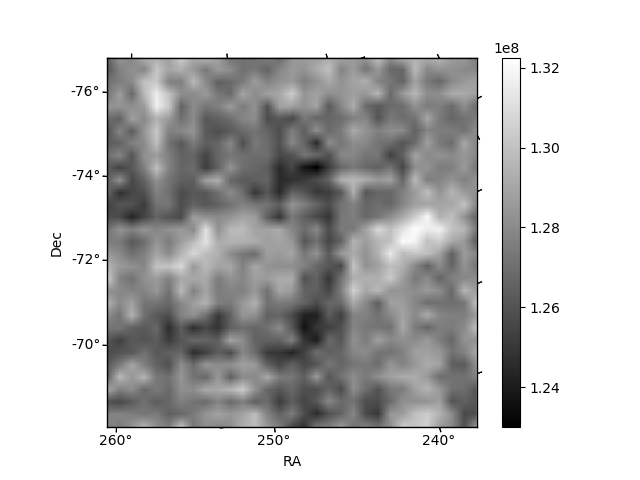
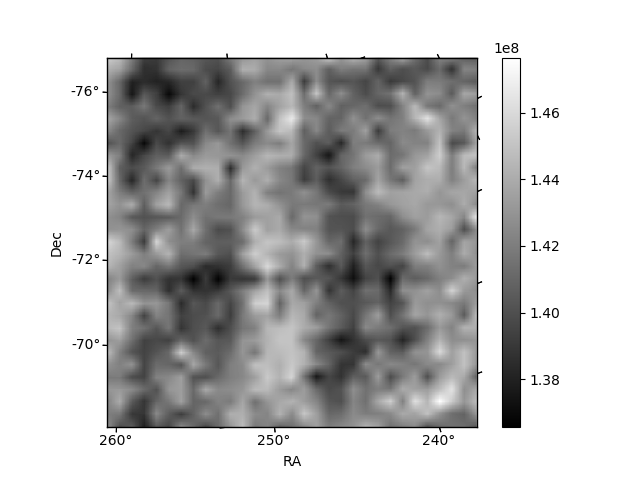
Histogram calculated using DETX and DETY for each event in the final _common_clean file
| Quadrant A | 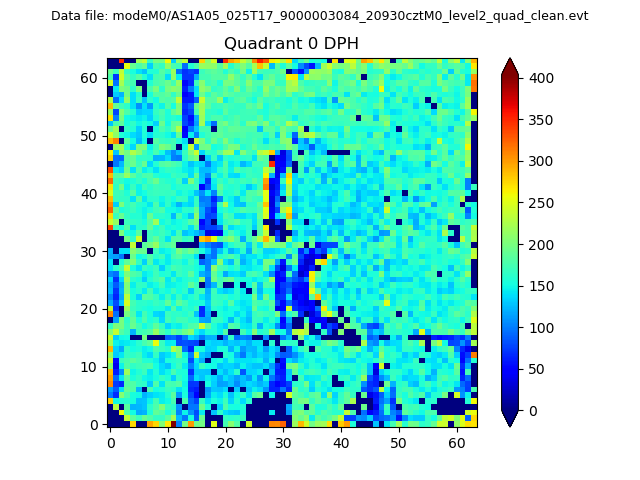 |
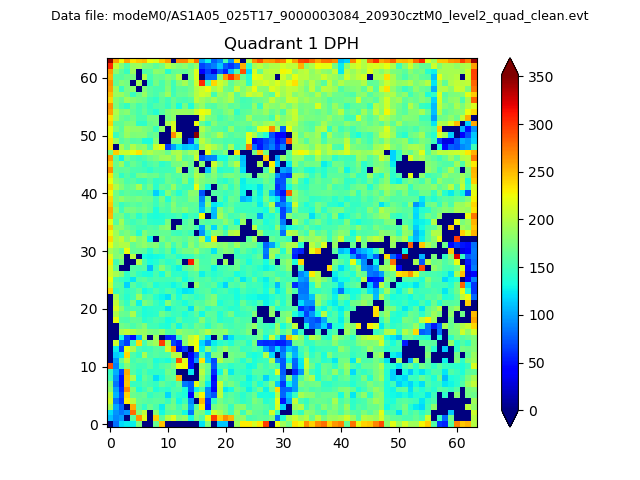 |
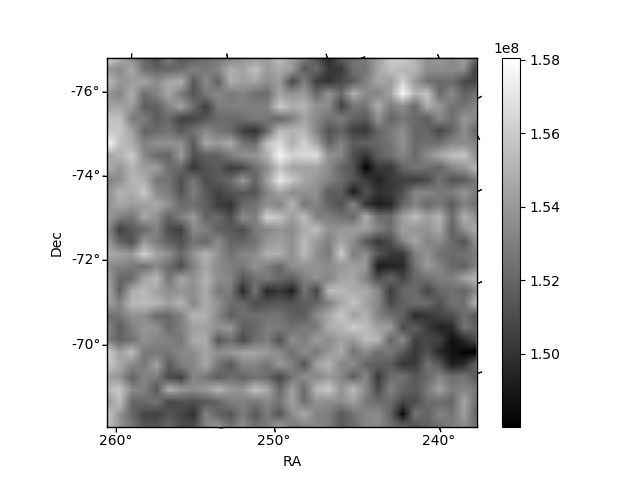
Quadrant B |
|---|---|---|---|
| Quadrant D | 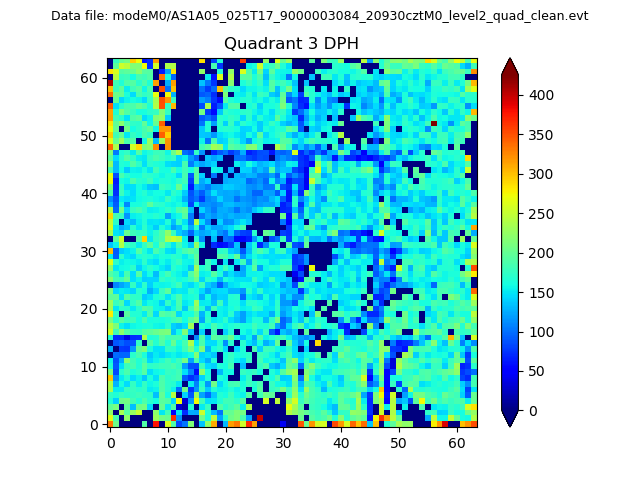 |
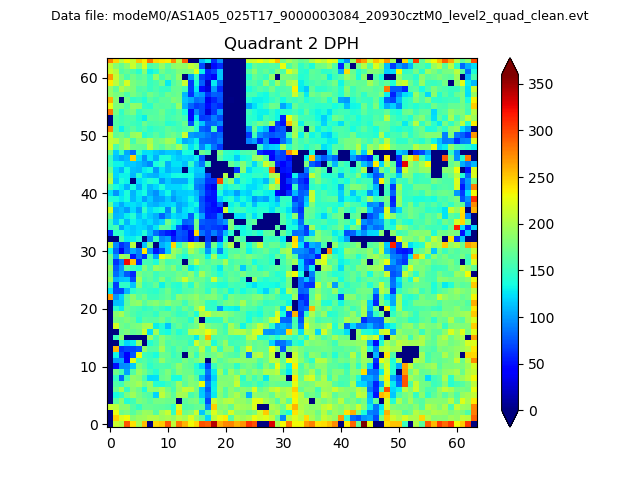 |
Quadrant C |
| Plot type | Count rate plots | Images |
|---|---|---|
| Comparison with Poisson distribution Blue bars denote a histogram of data divided into 1 sec bins. Red curve is a Poisson curve with rate = median count rate of data. |
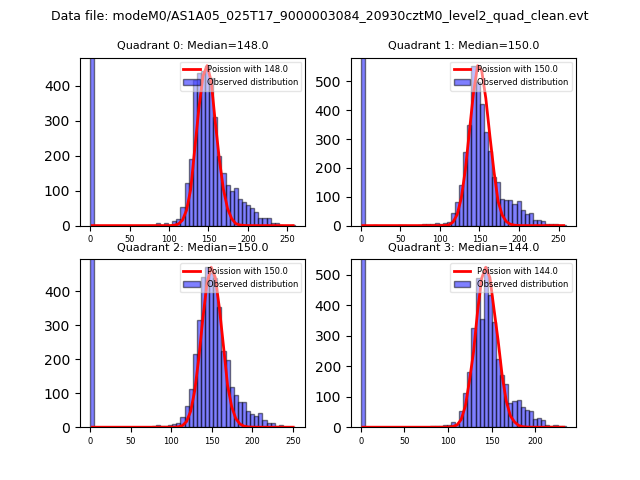 |
 |
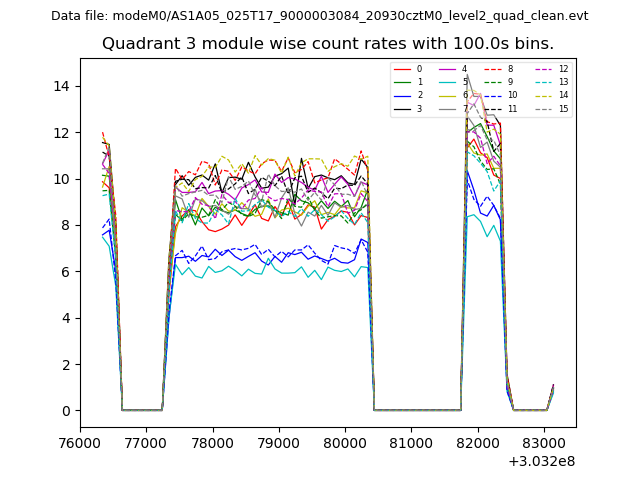
| Quadrant-wise count rates Data is divided into 100 sec bins |
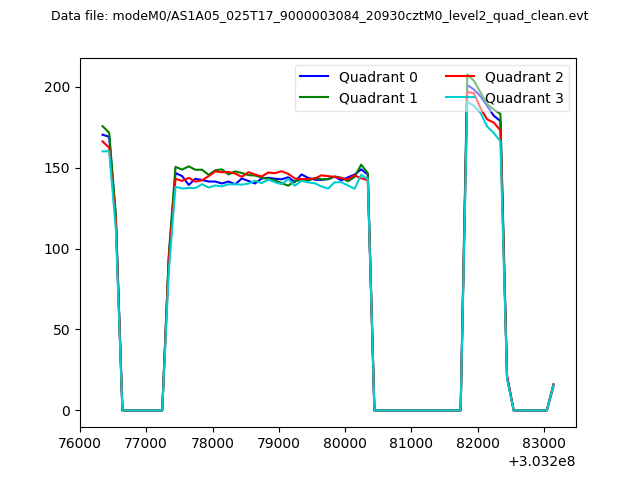 |
|
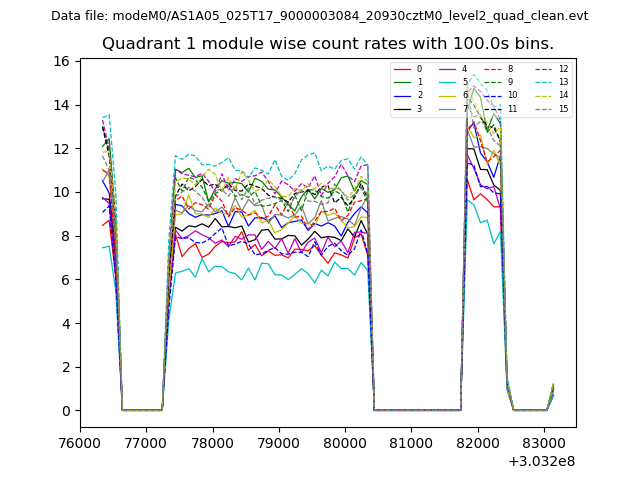
| Module-wise count rates for Quadrant A Data is divided into 100 sec bins |
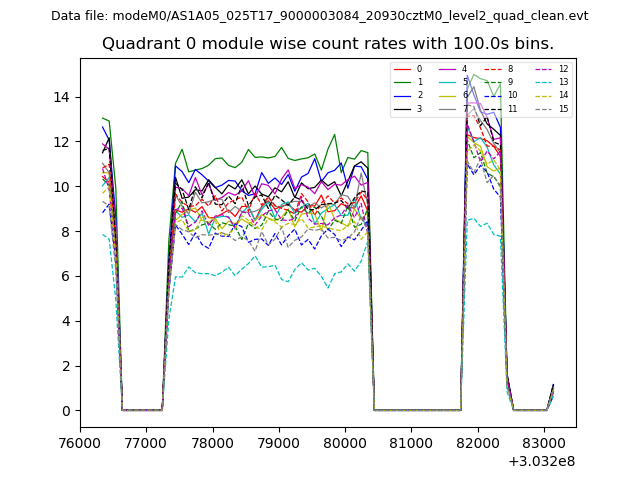 |
 |
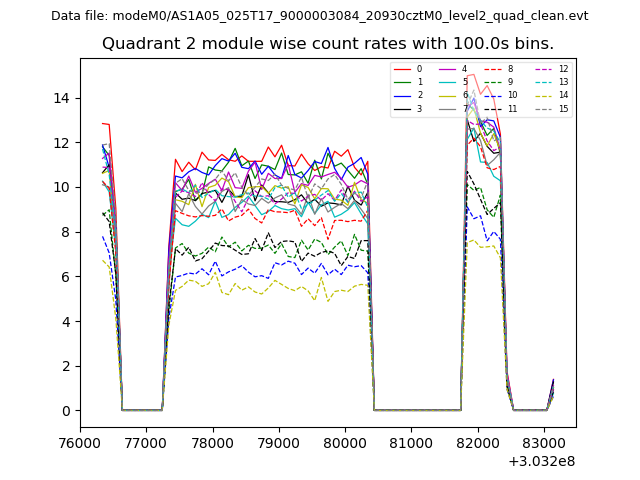
| Module-wise count rates for Quadrant B Data is divided into 100 sec bins |
 |
 |
| Module-wise count rates for Quadrant C Data is divided into 100 sec bins |
 |
 |
| Module-wise count rates for Quadrant D Data is divided into 100 sec bins |
 |
 |
| Parameter | Plot |
|---|---|
| CZT HV Monitor | 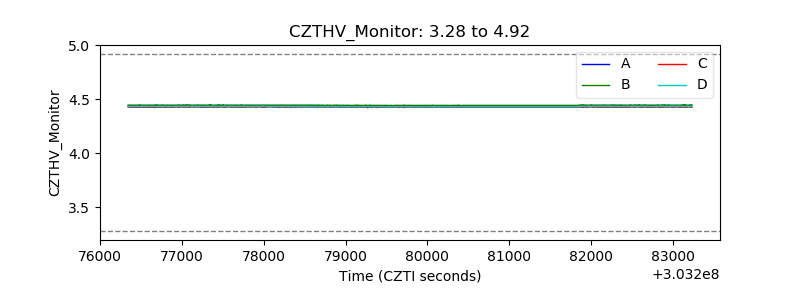 |
| D_VDD | 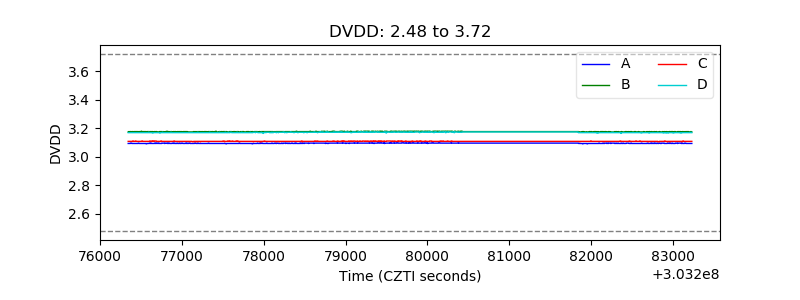 |
| Temperature 1 | 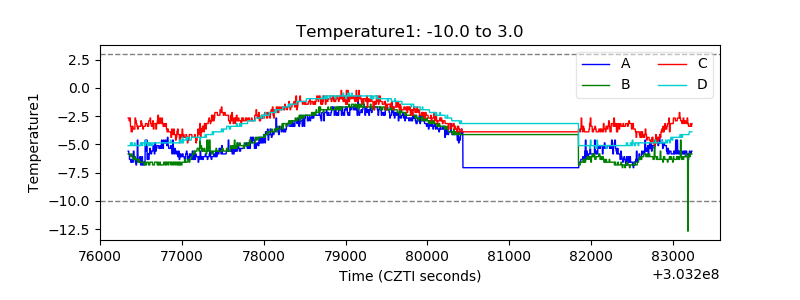 |
| Veto HV Monitor | 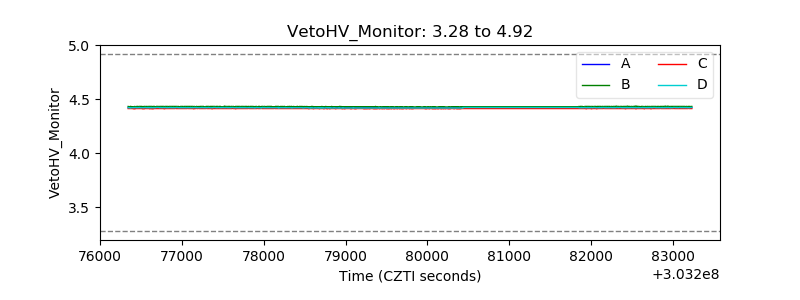 |
| Veto LLD |  |
| Alpha Counter | 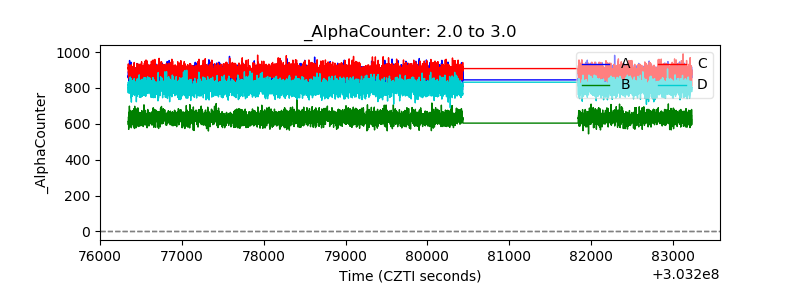 |
| _CPM_Rate | 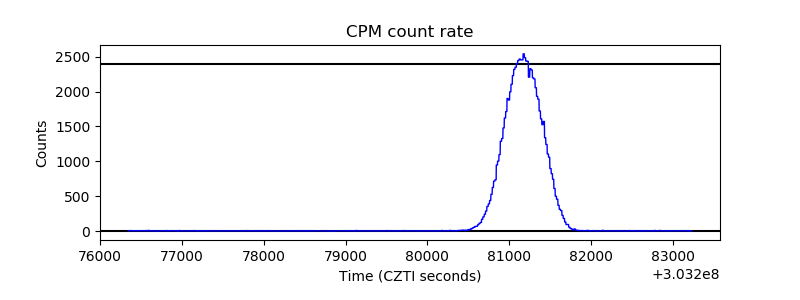 |
| CZT Counter | 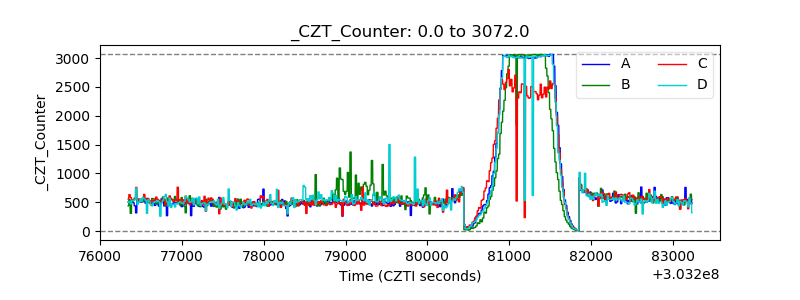 |
| +2.5 Volts monitor |  |
| +5 Volts monitor |  |
| _ROLL_ROT | 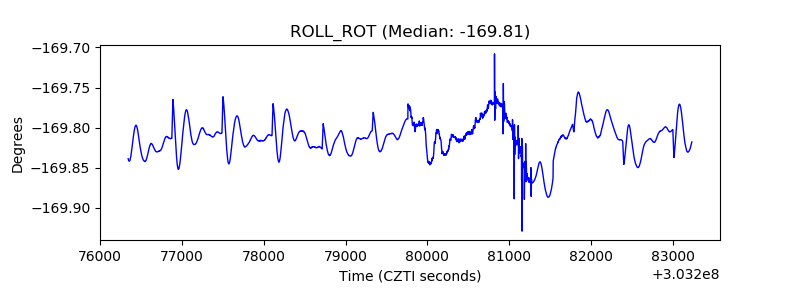 |
| _Roll_DEC | 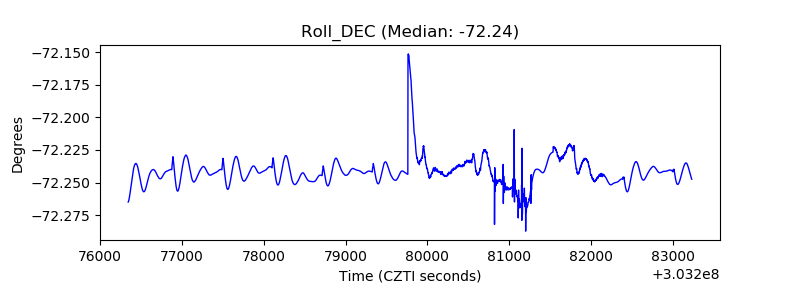 |
| _Roll_RA | 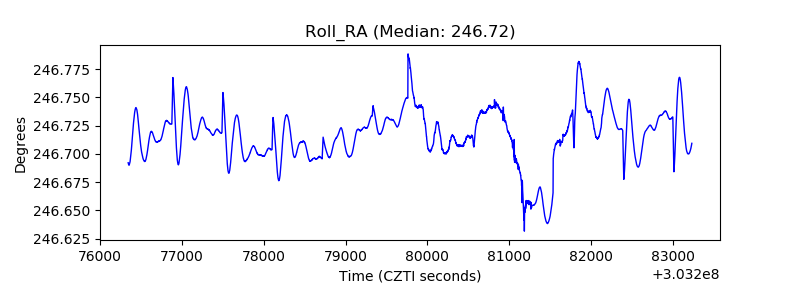 |
| Veto Counter | 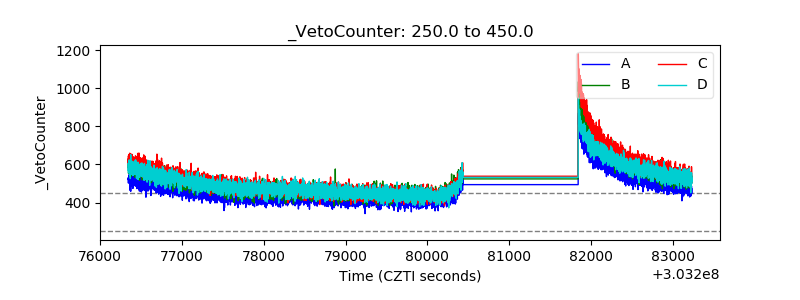 |