| Param | Original file | Final file |
|---|---|---|
| Filename | modeM0/AS1A05_025T17_9000003084_20934cztM0_level2.evt | modeM0/AS1A05_025T17_9000003084_20934cztM0_level2_quad_clean.evt |
| Size (bytes) | 537,840,000 | 132,696,000 |
| Size | 512.9 MB | 126.5 MB |
| Events in quadrant A | 3,502,161 | 881,183 |
| Events in quadrant B | 3,726,501 | 886,567 |
| Events in quadrant C | 3,679,301 | 877,935 |
| Events in quadrant D | 4,865,613 | 845,920 |
| Mode SS | |||
|---|---|---|---|
| Quadrant | BADHDUFLAG | Total packets | Discarded packets |
| A | 0 | 154 | 0 |
| B | 0 | 154 | 0 |
| C | 0 | 154 | 0 |
| D | 0 | 154 | 0 |
| Mode M0 | |||
|---|---|---|---|
| Quadrant | BADHDUFLAG | Total packets | Discarded packets |
| A | 0 | 15485 | 1 |
| B | 0 | 15876 | 1 |
| C | 0 | 15774 | 1 |
| D | 0 | 19377 | 1 |
| Mode M9 | |||
|---|---|---|---|
| Quadrant | BADHDUFLAG | Total packets | Discarded packets |
| A | 0 | 3 | 0 |
| B | 0 | 3 | 0 |
| C | 0 | 3 | 0 |
| D | 0 | 3 | 0 |
| Quadrant | Total seconds | Saturated seconds | Saturation percentage |
|---|---|---|---|
| A | 7582 | 170 | 2.242152% |
| B | 7583 | 185 | 2.439668% |
| C | 7583 | 198 | 2.611104% |
| D | 7583 | 317 | 4.180404% |
Noise dominated data is calculated using 1-second bins in cleaned event files. If a bin has >2000 counts, and if more than 50% of those come from <1% of pixels, then it is considered to be noise-dominated and hence unusable.
| Quadrant | # 1 sec bins | Bins with >0 counts | Bins with >2000 counts | High rate bins dominated by noise | Noise dominated (total time) | Noise dominated (detector-on time) | Marked lightcurve |
|---|---|---|---|---|---|---|---|
| A | 7892 | 7583 | 0 | 0 | 0.00% | 0.00% |  |
| B | 7893 | 7584 | 4 | 4 | 0.05% | 0.05% |  |
| C | 7893 | 7584 | 0 | 0 | 0.00% | 0.00% |  |
| D | 7893 | 7584 | 132 | 132 | 1.67% | 1.74% |  |
Top three noisy pixels from each quadrant. If the there are fewer than three noisy pixels in the level2.evt file, extra rows are filled as -1
| Pixel properties | Quadrant properties | ||||||
|---|---|---|---|---|---|---|---|
| Quadrant | DetID | PixID | Counts | Sigma | Mean | Median | Sigma |
| A | 0 | 226 | 7867 | 38.11 | 909 | 889 | 183.1 |
| A | 3 | 137 | 7515 | 36.19 | 909 | 889 | 183.1 |
| A | 15 | 174 | 7453 | 35.85 | 909 | 889 | 183.1 |
| B | 7 | 220 | 49769 | 288.28 | 902 | 880 | 169.6 |
| B | 3 | 64 | 47019 | 272.06 | 902 | 880 | 169.6 |
| B | 0 | 229 | 43142 | 249.2 | 902 | 880 | 169.6 |
| C | 14 | 238 | 138094 | 674.54 | 880 | 884 | 203.4 |
| C | 10 | 91 | 110822 | 540.47 | 880 | 884 | 203.4 |
| C | 13 | 61 | 6014 | 25.22 | 880 | 884 | 203.4 |
| D | 1 | 52 | 584913 | 2737.58 | 888 | 863 | 213.3 |
| D | 1 | 20 | 537934 | 2517.38 | 888 | 863 | 213.3 |
| D | 6 | 143 | 235752 | 1100.98 | 888 | 863 | 213.3 |
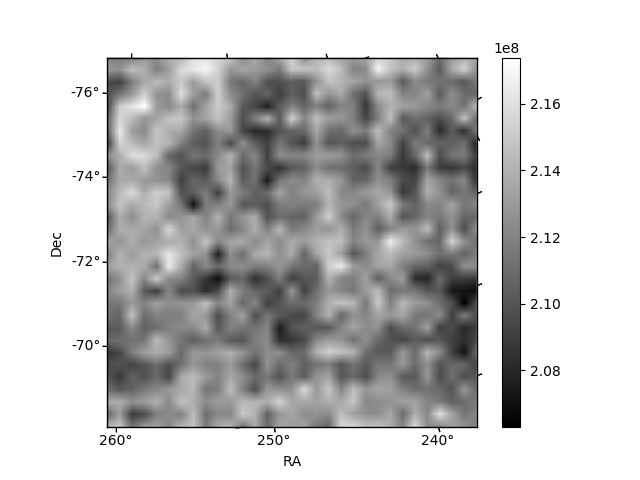
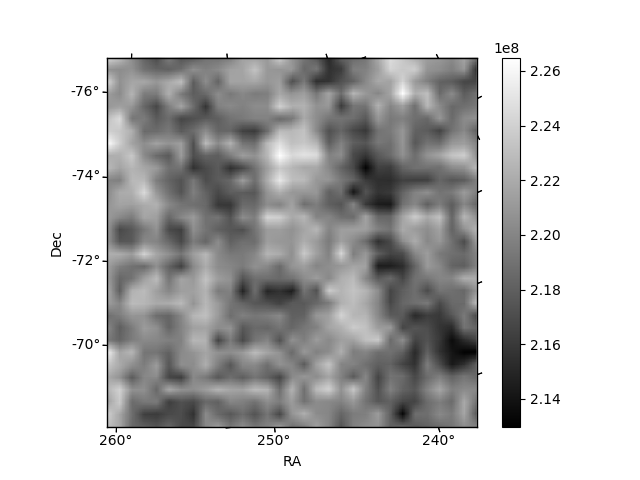
Histogram calculated using DETX and DETY for each event in the final _common_clean file
| Quadrant A | 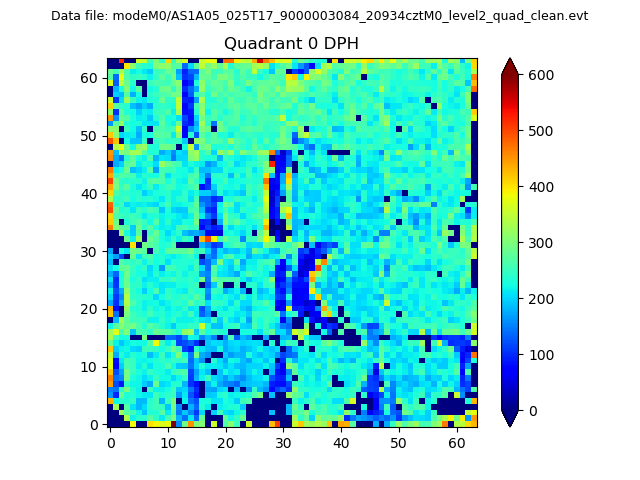 |
 |
Quadrant B |
|---|---|---|---|
| Quadrant D |  |
 |
Quadrant C |
| Plot type | Count rate plots | Images |
|---|---|---|
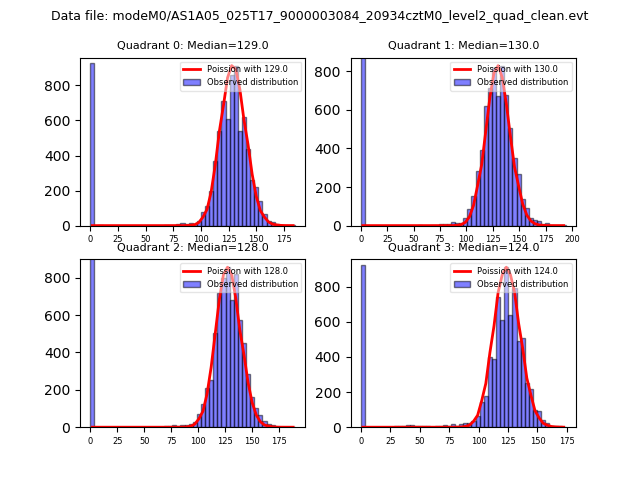
| Comparison with Poisson distribution Blue bars denote a histogram of data divided into 1 sec bins. Red curve is a Poisson curve with rate = median count rate of data. |
 |
 |
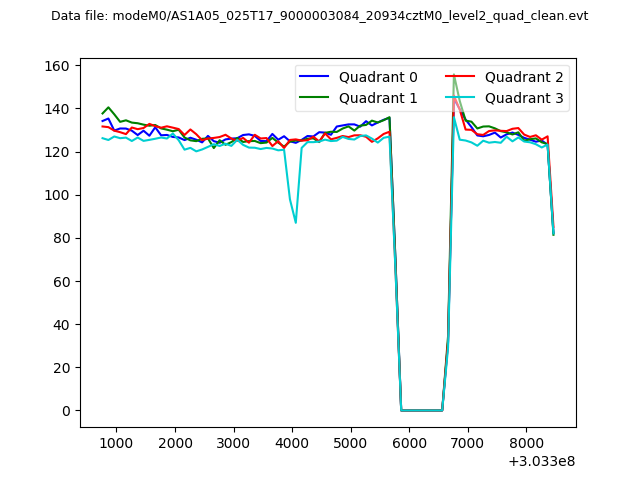
| Quadrant-wise count rates Data is divided into 100 sec bins |
 |
|
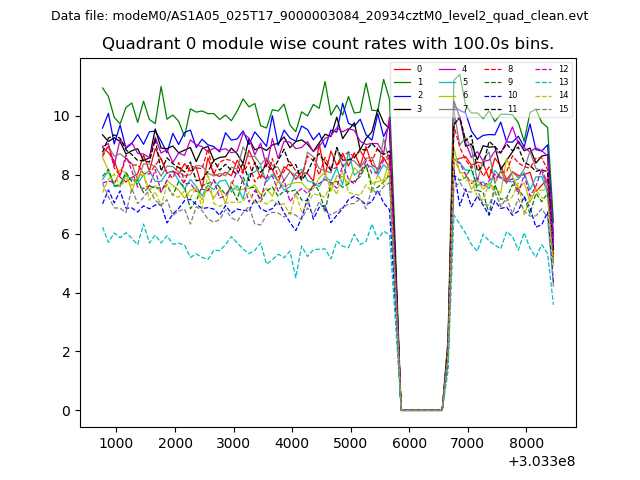
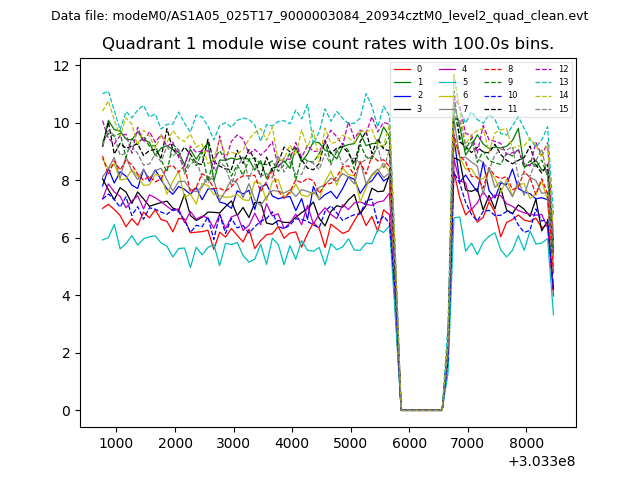
| Module-wise count rates for Quadrant A Data is divided into 100 sec bins |
 |
 |
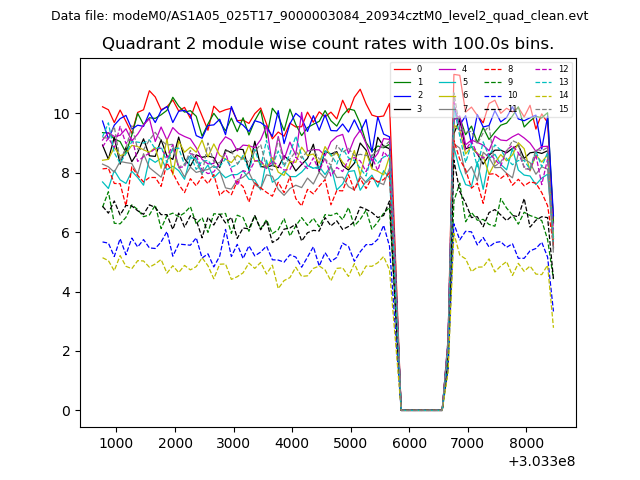
| Module-wise count rates for Quadrant B Data is divided into 100 sec bins |
 |
 |
| Module-wise count rates for Quadrant C Data is divided into 100 sec bins |
 |
 |
| Module-wise count rates for Quadrant D Data is divided into 100 sec bins |
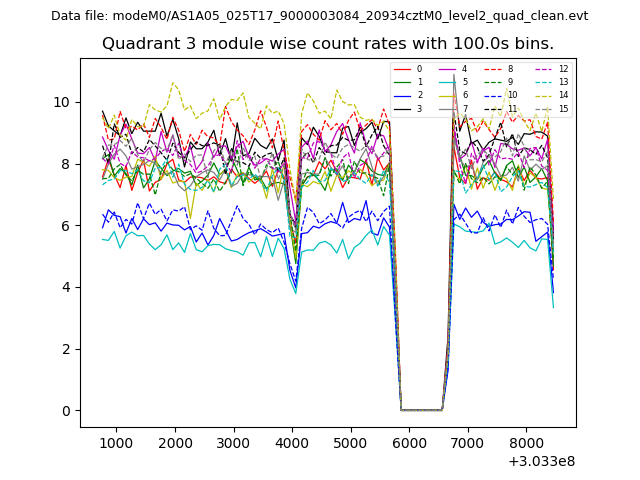 |
 |
| Parameter | Plot |
|---|---|
| CZT HV Monitor | 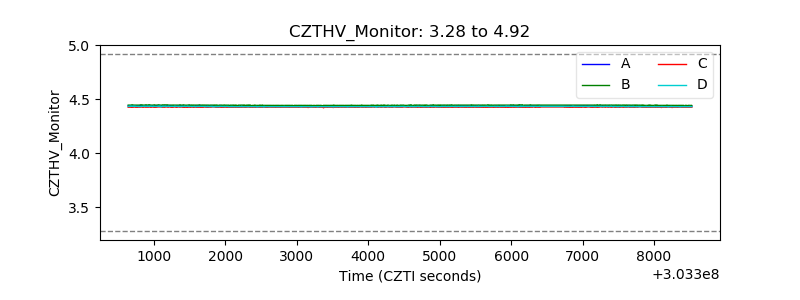 |
| D_VDD | 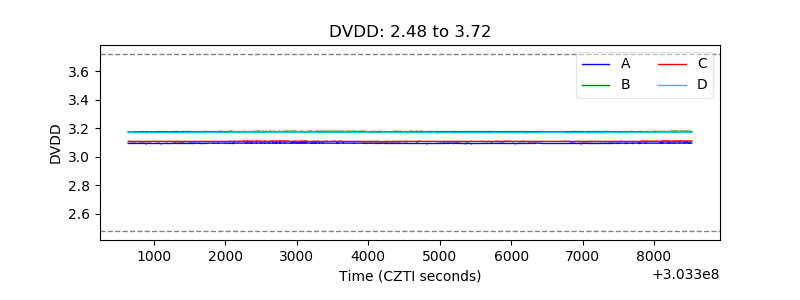 |
| Temperature 1 | 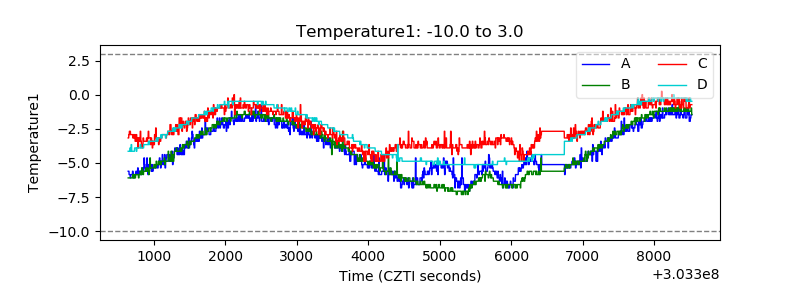 |
| Veto HV Monitor | 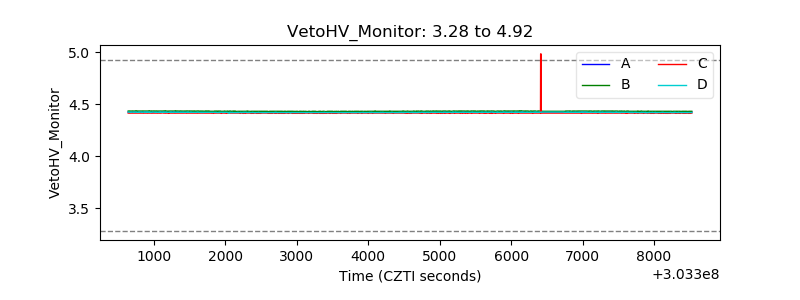 |
| Veto LLD | 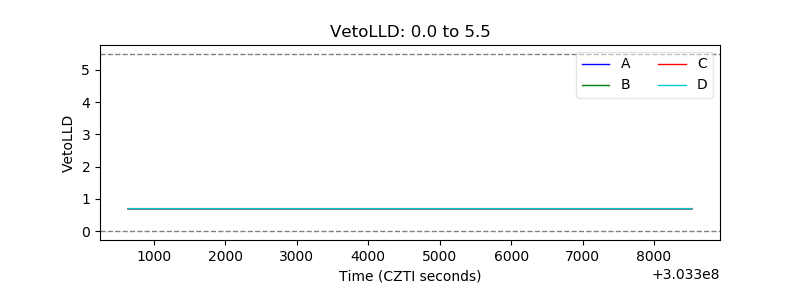 |
| Alpha Counter | 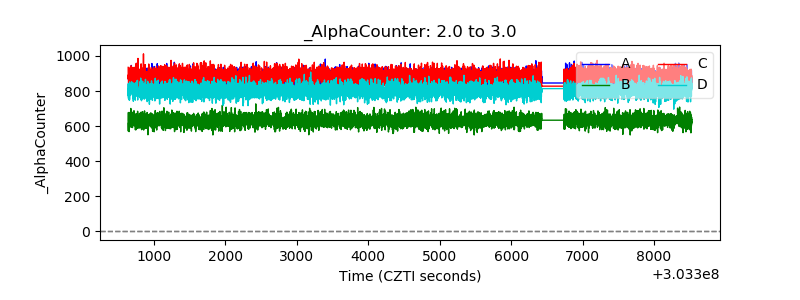 |
| _CPM_Rate | 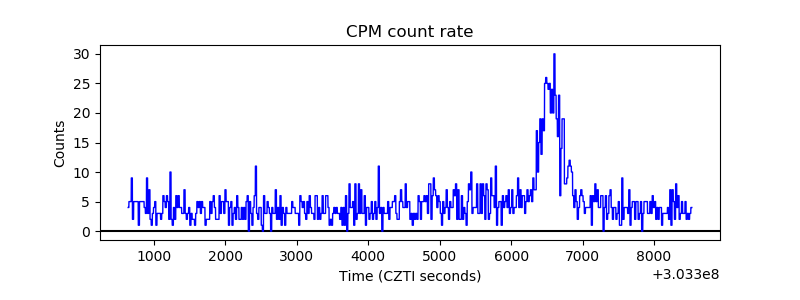 |
| CZT Counter |  |
| +2.5 Volts monitor |  |
| +5 Volts monitor | 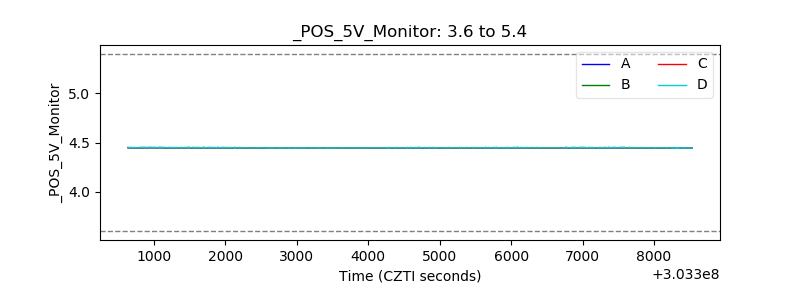 |
| _ROLL_ROT | 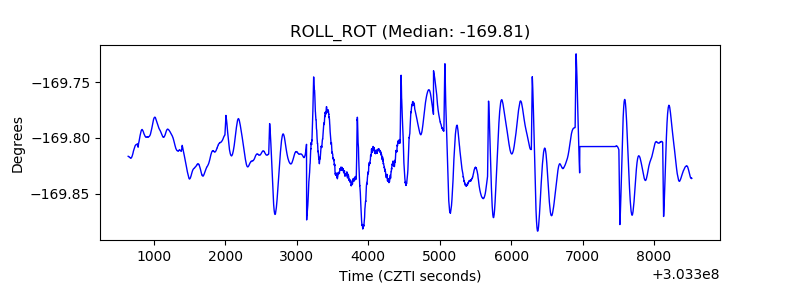 |
| _Roll_DEC | 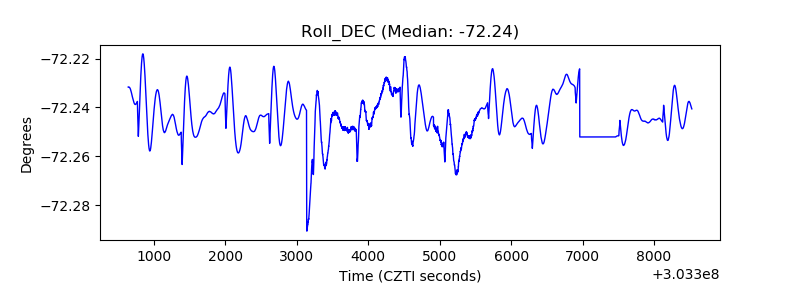 |
| _Roll_RA |  |
| Veto Counter | 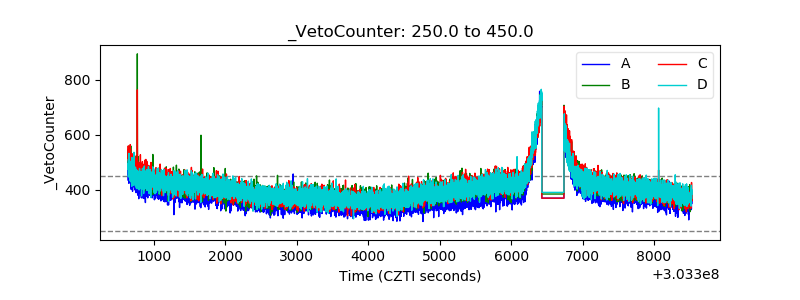 |