| Param | Original file | Final file |
|---|---|---|
| Filename | modeM0/AS1A05_025T17_9000003084_20935cztM0_level2.evt | modeM0/AS1A05_025T17_9000003084_20935cztM0_level2_quad_clean.evt |
| Size (bytes) | 195,759,360 | 55,958,400 |
| Size | 186.7 MB | 53.4 MB |
| Events in quadrant A | 1,291,179 | 372,200 |
| Events in quadrant B | 1,474,467 | 370,317 |
| Events in quadrant C | 1,288,119 | 372,644 |
| Events in quadrant D | 1,668,371 | 365,072 |
| Mode SS | |||
|---|---|---|---|
| Quadrant | BADHDUFLAG | Total packets | Discarded packets |
| A | 0 | 60 | 0 |
| B | 0 | 60 | 0 |
| C | 0 | 60 | 0 |
| D | 0 | 60 | 0 |
| Mode M0 | |||
|---|---|---|---|
| Quadrant | BADHDUFLAG | Total packets | Discarded packets |
| A | 0 | 6016 | 0 |
| B | 0 | 6408 | 0 |
| C | 0 | 6021 | 0 |
| D | 0 | 6988 | 0 |
| Quadrant | Total seconds | Saturated seconds | Saturation percentage |
|---|---|---|---|
| A | 3005 | 1 | 0.033278% |
| B | 3006 | 7 | 0.232868% |
| C | 3006 | 1 | 0.033267% |
| D | 3006 | 24 | 0.798403% |
Noise dominated data is calculated using 1-second bins in cleaned event files. If a bin has >2000 counts, and if more than 50% of those come from <1% of pixels, then it is considered to be noise-dominated and hence unusable.
| Quadrant | # 1 sec bins | Bins with >0 counts | Bins with >2000 counts | High rate bins dominated by noise | Noise dominated (total time) | Noise dominated (detector-on time) | Marked lightcurve |
|---|---|---|---|---|---|---|---|
| A | 3005 | 3005 | 0 | 0 | 0.00% | 0.00% | 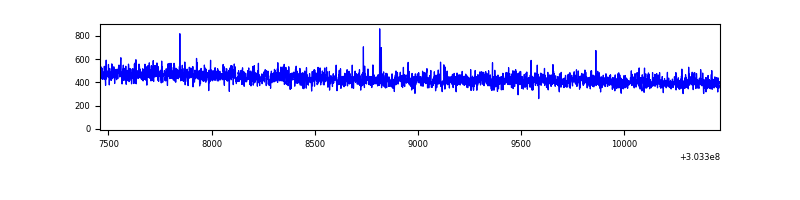 |
| B | 3006 | 3006 | 6 | 6 | 0.20% | 0.20% | 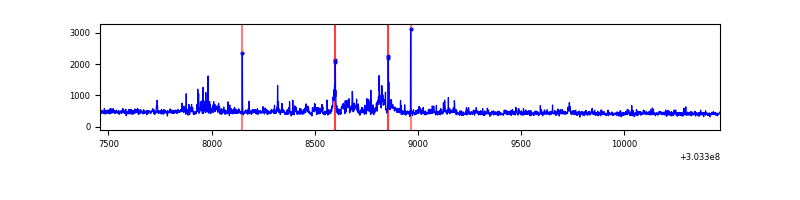 |
| C | 3006 | 3006 | 0 | 0 | 0.00% | 0.00% | 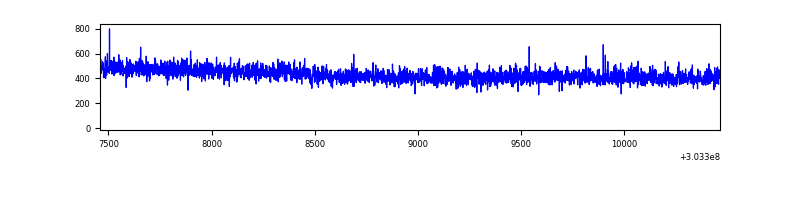 |
| D | 3006 | 3006 | 24 | 24 | 0.80% | 0.80% | 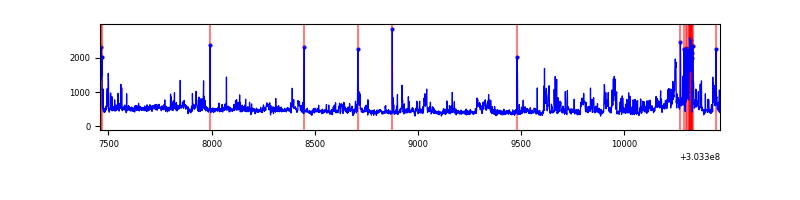 |
Top three noisy pixels from each quadrant. If the there are fewer than three noisy pixels in the level2.evt file, extra rows are filled as -1
| Pixel properties | Quadrant properties | ||||||
|---|---|---|---|---|---|---|---|
| Quadrant | DetID | PixID | Counts | Sigma | Mean | Median | Sigma |
| A | 0 | 226 | 3034 | 39.25 | 335 | 329 | 68.9 |
| A | 3 | 137 | 2731 | 34.86 | 335 | 329 | 68.9 |
| A | 12 | 194 | 2400 | 30.05 | 335 | 329 | 68.9 |
| B | 0 | 229 | 71137 | 1101.33 | 330 | 322 | 64.3 |
| B | 0 | 190 | 50449 | 779.58 | 330 | 322 | 64.3 |
| B | 7 | 220 | 23078 | 353.9 | 330 | 322 | 64.3 |
| C | 14 | 238 | 49338 | 652.73 | 317 | 319 | 75.1 |
| C | 13 | 61 | 2216 | 25.26 | 317 | 319 | 75.1 |
| C | 7 | 247 | 1568 | 16.63 | 317 | 319 | 75.1 |
| D | 1 | 20 | 134840 | 1689.43 | 324 | 314 | 79.6 |
| D | 9 | 1 | 125639 | 1573.88 | 324 | 314 | 79.6 |
| D | 1 | 52 | 81031 | 1013.68 | 324 | 314 | 79.6 |
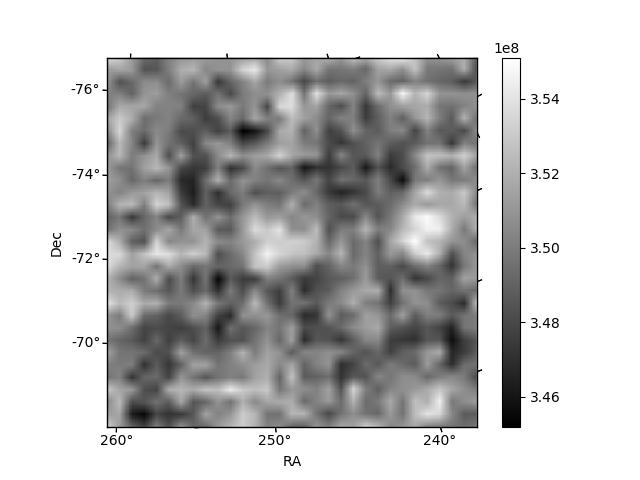
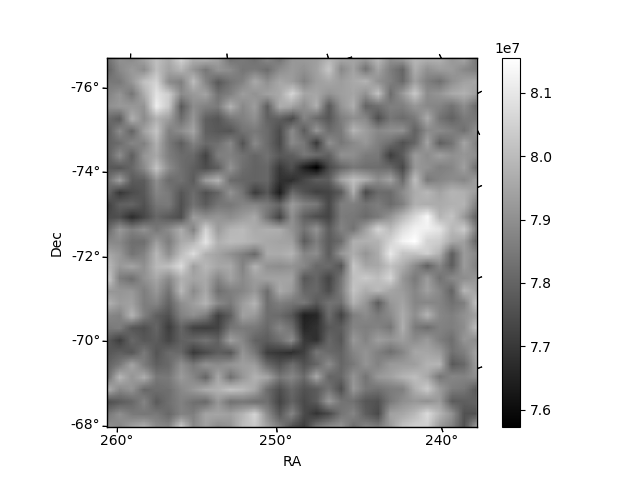
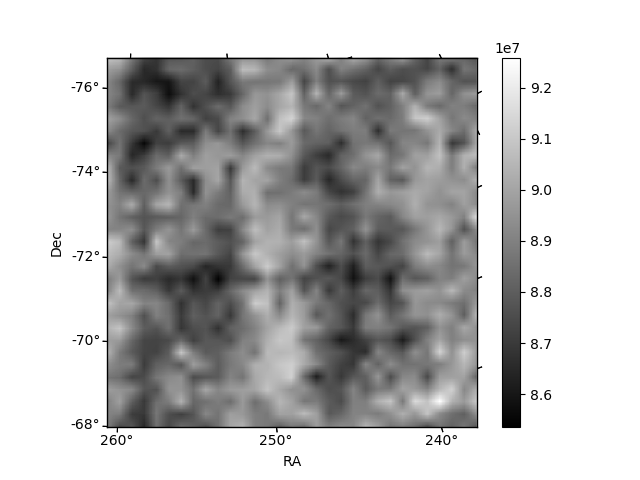
Histogram calculated using DETX and DETY for each event in the final _common_clean file
| Quadrant A | 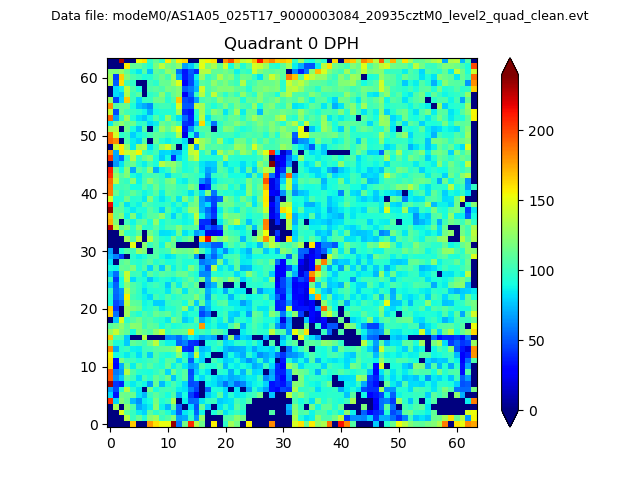 |
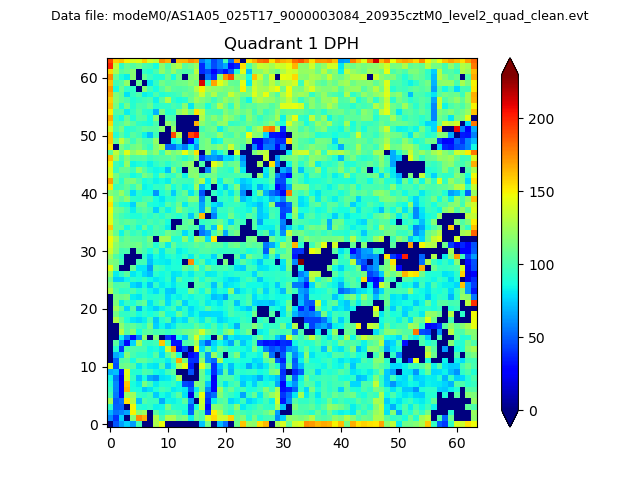 |
Quadrant B |
|---|---|---|---|
| Quadrant D | 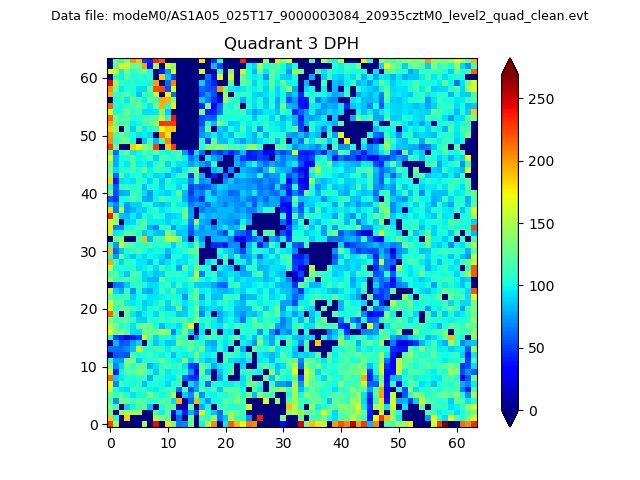 |
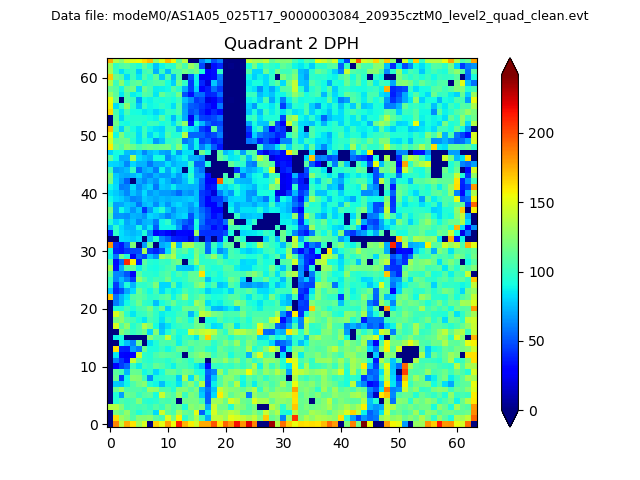 |
Quadrant C |
| Plot type | Count rate plots | Images |
|---|---|---|
| Comparison with Poisson distribution Blue bars denote a histogram of data divided into 1 sec bins. Red curve is a Poisson curve with rate = median count rate of data. |
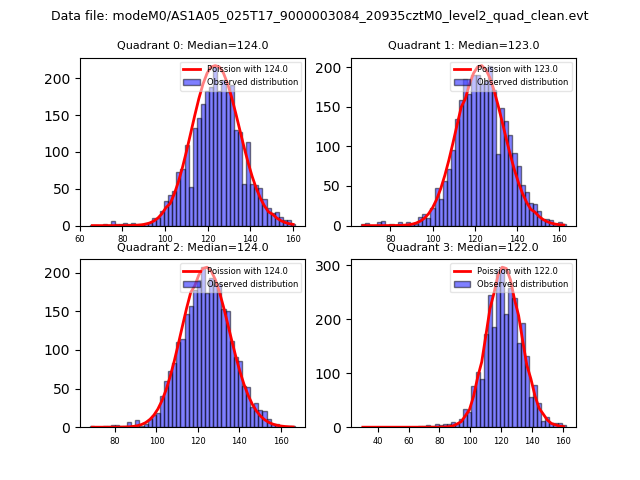 |
 |
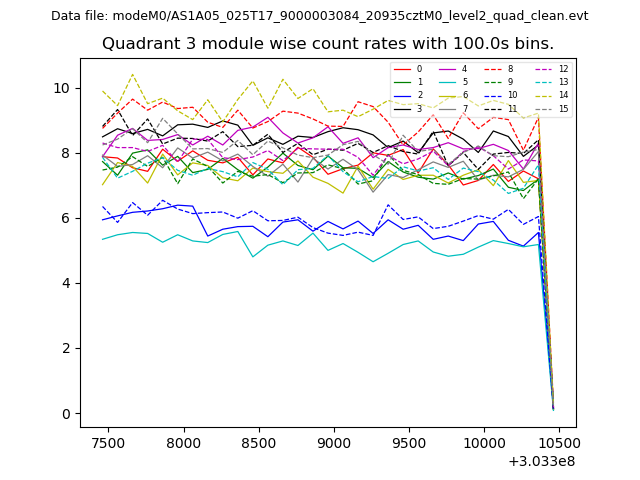
| Quadrant-wise count rates Data is divided into 100 sec bins |
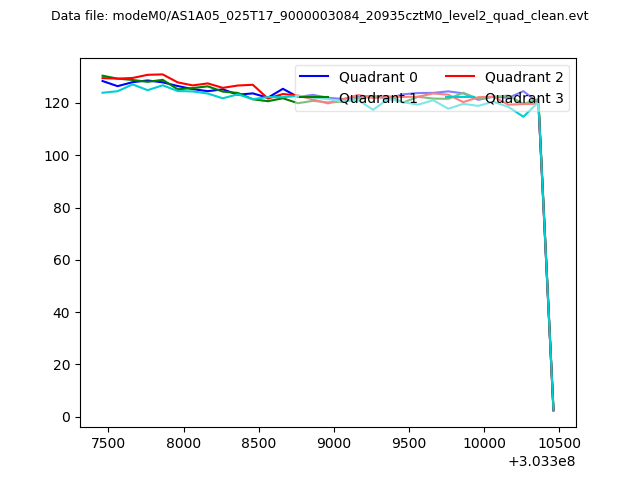 |
|
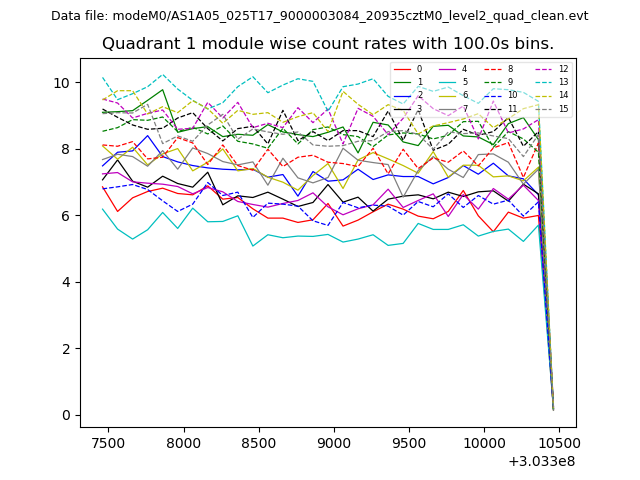
| Module-wise count rates for Quadrant A Data is divided into 100 sec bins |
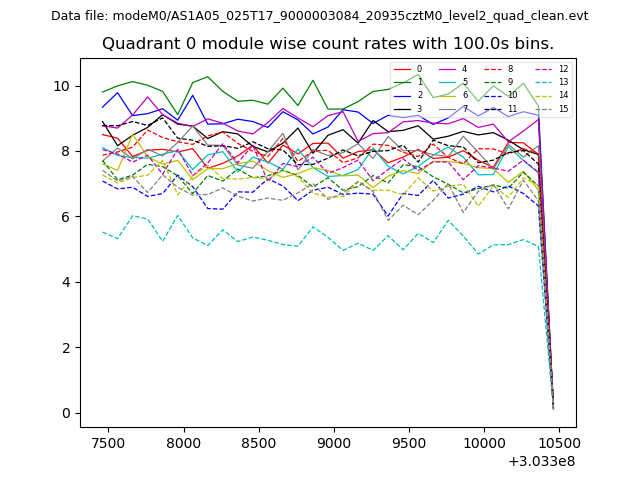 |
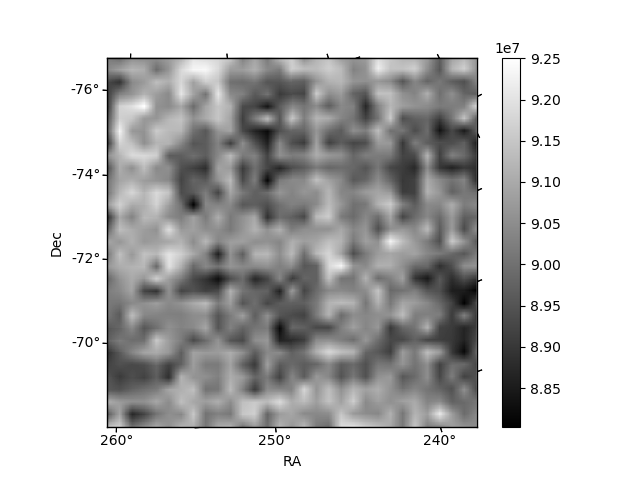 |
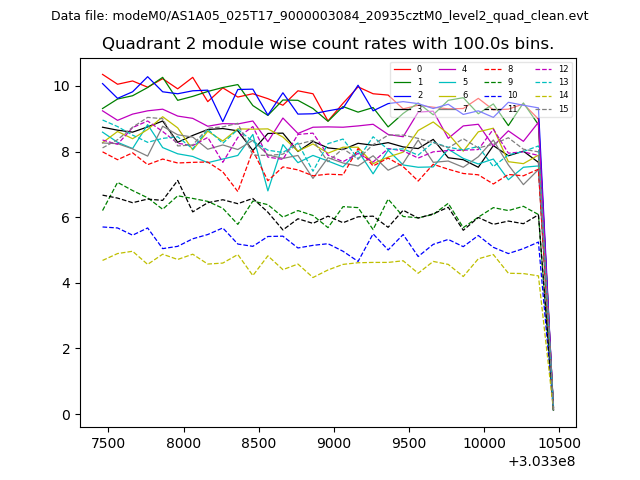
| Module-wise count rates for Quadrant B Data is divided into 100 sec bins |
 |
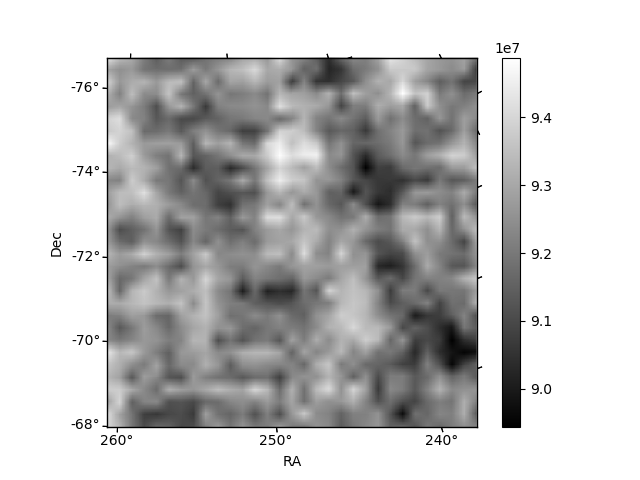 |
| Module-wise count rates for Quadrant C Data is divided into 100 sec bins |
 |
 |
| Module-wise count rates for Quadrant D Data is divided into 100 sec bins |
 |
 |
| Parameter | Plot |
|---|---|
| CZT HV Monitor | 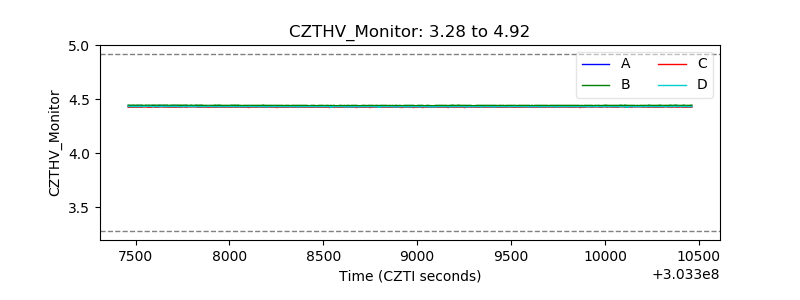 |
| D_VDD | 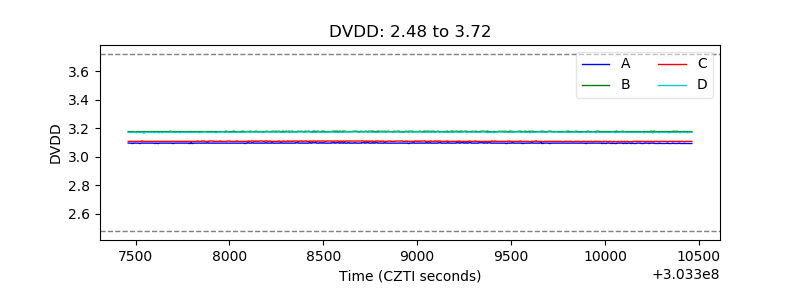 |
| Temperature 1 | 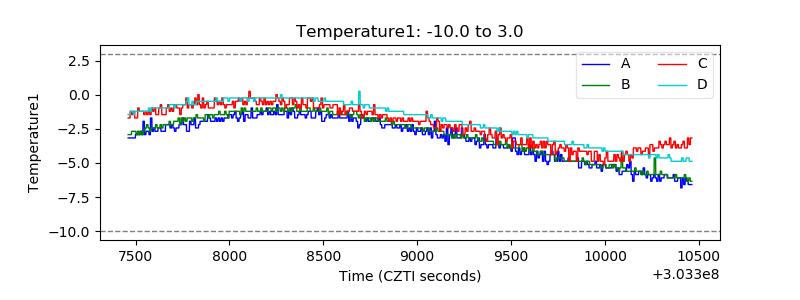 |
| Veto HV Monitor | 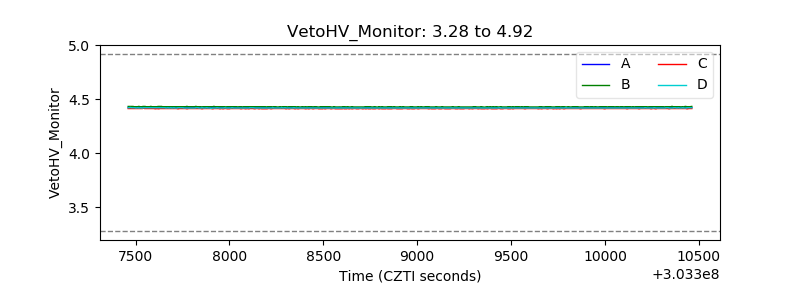 |
| Veto LLD | 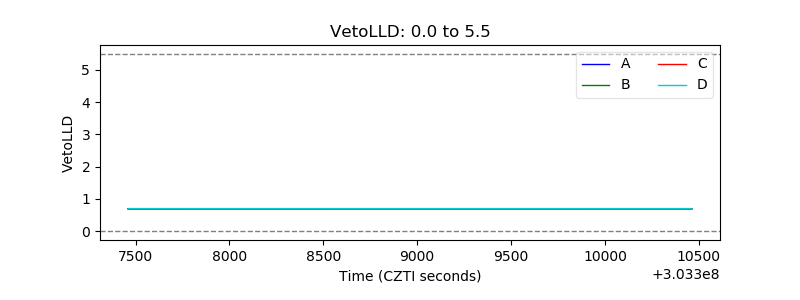 |
| Alpha Counter | 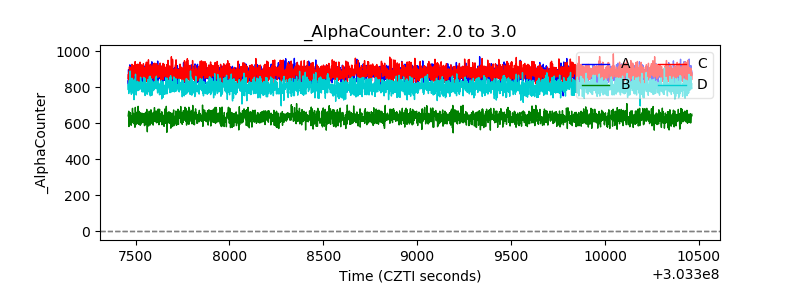 |
| _CPM_Rate |  |
| CZT Counter | 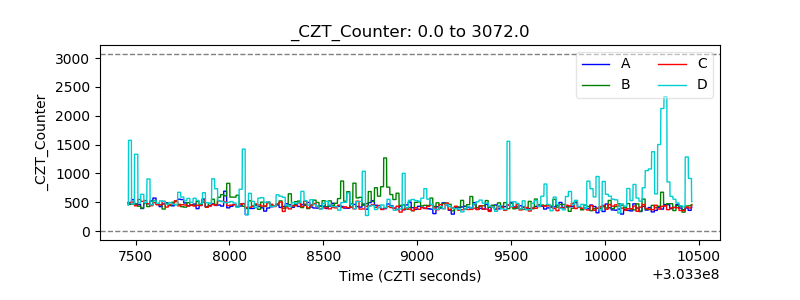 |
| +2.5 Volts monitor |  |
| +5 Volts monitor |  |
| _ROLL_ROT |  |
| _Roll_DEC | 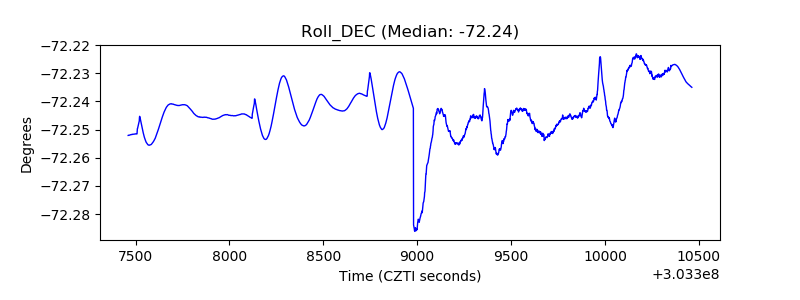 |
| _Roll_RA | 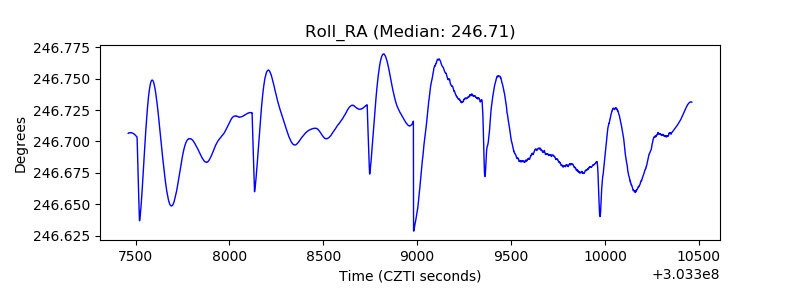 |
| Veto Counter | 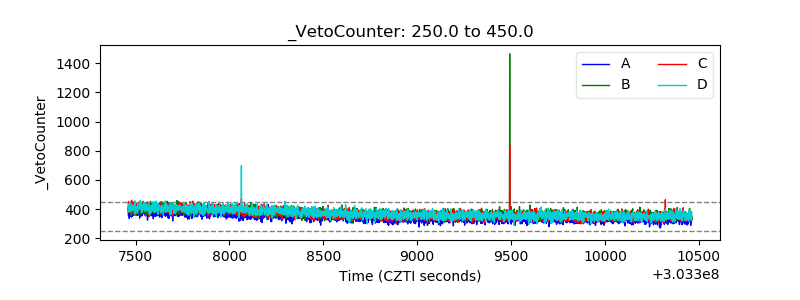 |