| Param | Original file | Final file |
|---|---|---|
| Filename | modeM0/AS1A05_088T05_9000003088cztM0_level2.fits | modeM0/AS1A05_088T05_9000003088cztM0_level2_quad_clean.evt |
| Size (bytes) | 362,214,720 | 282,441,600 |
| Size | 345.4 MB | 269.4 MB |
| Events in quadrant A | 2,296,268 | 1,621,119 |
| Events in quadrant B | 2,182,924 | 1,610,594 |
| Events in quadrant C | 2,197,079 | 1,529,574 |
| Events in quadrant D | 1,871,034 | 1,368,070 |
| Mode M9 | |||
|---|---|---|---|
| Quadrant | BADHDUFLAG | Total packets | Discarded packets |
| A | 0 | 167 | 0 |
| B | 0 | 167 | 0 |
| C | 0 | 81 | 0 |
| D | 0 | 167 | 0 |
| Mode M0 | |||
|---|---|---|---|
| Quadrant | BADHDUFLAG | Total packets | Discarded packets |
| A | 0 | 73749 | 0 |
| B | 0 | 79768 | 0 |
| C | 0 | 74176 | 0 |
| D | 0 | 93198 | 0 |
| Mode SS | |||
|---|---|---|---|
| Quadrant | BADHDUFLAG | Total packets | Discarded packets |
| A | 0 | 714 | 0 |
| B | 0 | 716 | 0 |
| C | 0 | 720 | 0 |
| D | 0 | 716 | 0 |
| Quadrant | Total seconds | Saturated seconds | Saturation percentage |
|---|---|---|---|
| A | 35292 | 266 | 0.753712% |
| B | 35300 | 569 | 1.611898% |
| C | 35318 | 385 | 1.090096% |
| D | 35189 | 1472 | 4.183125% |
Noise dominated data is calculated using 1-second bins in cleaned event files. If a bin has >2000 counts, and if more than 50% of those come from <1% of pixels, then it is considered to be noise-dominated and hence unusable.
| Quadrant | # 1 sec bins | Bins with >0 counts | Bins with >2000 counts | High rate bins dominated by noise | Noise dominated (total time) | Noise dominated (detector-on time) | Marked lightcurve |
|---|---|---|---|---|---|---|---|
| A | 42801 | 34938 | 0 | 0 | 0.00% | 0.00% |  |
| B | 42802 | 34938 | 0 | 0 | 0.00% | 0.00% |  |
| C | 42802 | 34939 | 0 | 0 | 0.00% | 0.00% |  |
| D | 42802 | 34923 | 0 | 0 | 0.00% | 0.00% |  |
Top three noisy pixels from each quadrant. If the there are fewer than three noisy pixels in the level2.evt file, extra rows are filled as -1
| Pixel properties | Quadrant properties | ||||||
|---|---|---|---|---|---|---|---|
| Quadrant | DetID | PixID | Counts | Sigma | Mean | Median | Sigma |
| A | 0 | 29 | 2110 | 10.43 | 598 | 564 | 148.2 |
| A | 7 | 110 | 1790 | 8.27 | 598 | 564 | 148.2 |
| A | 9 | 19 | 1721 | 7.81 | 598 | 564 | 148.2 |
| B | 2 | 9 | 1677 | 9.87 | 578 | 555 | 113.7 |
| B | 2 | 8 | 1429 | 7.69 | 578 | 555 | 113.7 |
| B | 5 | 225 | 1414 | 7.56 | 578 | 555 | 113.7 |
| C | 1 | 80 | 1737 | 8.02 | 579 | 543 | 148.8 |
| C | 1 | 81 | 1718 | 7.89 | 579 | 543 | 148.8 |
| C | 3 | 126 | 1479 | 6.29 | 579 | 543 | 148.8 |
| D | 7 | 3 | 1379 | 6.26 | 535 | 489 | 142.1 |
| D | 10 | 189 | 1357 | 6.11 | 535 | 489 | 142.1 |
| D | 3 | 14 | 1345 | 6.02 | 535 | 489 | 142.1 |
Histogram calculated using DETX and DETY for each event in the final _common_clean file
| Quadrant A | 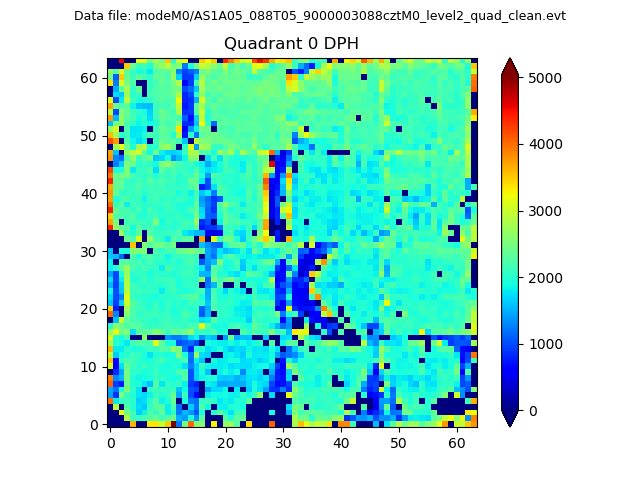 |
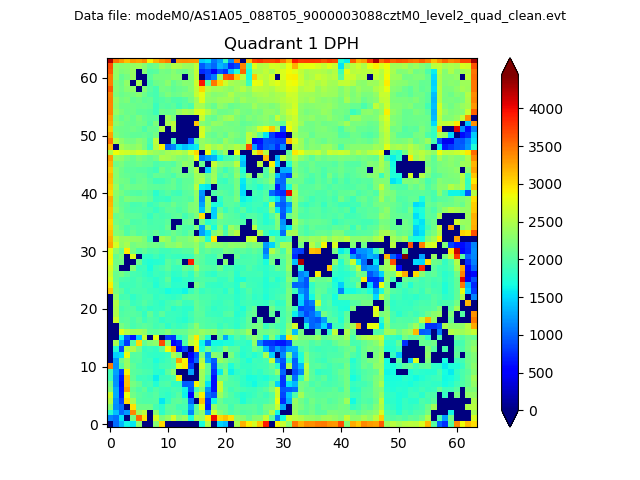 |
Quadrant B |
|---|---|---|---|
| Quadrant D |  |
 |
Quadrant C |
| Plot type | Count rate plots | Images |
|---|---|---|
| Comparison with Poisson distribution Blue bars denote a histogram of data divided into 1 sec bins. Red curve is a Poisson curve with rate = median count rate of data. |
 |
 |
| Quadrant-wise count rates Data is divided into 100 sec bins |
 |
|
| Module-wise count rates for Quadrant A Data is divided into 100 sec bins |
 |
 |
| Module-wise count rates for Quadrant B Data is divided into 100 sec bins |
 |
 |
| Module-wise count rates for Quadrant C Data is divided into 100 sec bins |
 |
 |
| Module-wise count rates for Quadrant D Data is divided into 100 sec bins |
 |
 |
| Parameter | Plot |
|---|---|
| CZT HV Monitor |  |
| D_VDD |  |
| Temperature 1 |  |
| Veto HV Monitor |  |
| Veto LLD |  |
| Alpha Counter |  |
| _CPM_Rate |  |
| CZT Counter |  |
| +2.5 Volts monitor |  |
| +5 Volts monitor |  |
| _ROLL_ROT |  |
| _Roll_DEC |  |
| _Roll_RA |  |
| Veto Counter |  |