| Param | Original file | Final file |
|---|---|---|
| Filename | modeM0/AS1A05_088T05_9000003088_20938cztM0_level2.evt | modeM0/AS1A05_088T05_9000003088_20938cztM0_level2_quad_clean.evt |
| Size (bytes) | 317,606,400 | 57,513,600 |
| Size | 302.9 MB | 54.8 MB |
| Events in quadrant A | 2,113,558 | 364,365 |
| Events in quadrant B | 2,321,739 | 367,254 |
| Events in quadrant C | 2,173,497 | 352,807 |
| Events in quadrant D | 2,703,174 | 340,476 |
| Mode M9 | |||
|---|---|---|---|
| Quadrant | BADHDUFLAG | Total packets | Discarded packets |
| A | 0 | 8 | 0 |
| B | 0 | 8 | 0 |
| C | 0 | 8 | 0 |
| D | 0 | 8 | 0 |
| Mode M0 | |||
|---|---|---|---|
| Quadrant | BADHDUFLAG | Total packets | Discarded packets |
| A | 0 | 9178 | 1 |
| B | 0 | 9748 | 1 |
| C | 0 | 9222 | 1 |
| D | 0 | 11071 | 3 |
| Mode SS | |||
|---|---|---|---|
| Quadrant | BADHDUFLAG | Total packets | Discarded packets |
| A | 0 | 92 | 0 |
| B | 0 | 92 | 0 |
| C | 0 | 92 | 0 |
| D | 0 | 92 | 0 |
| Quadrant | Total seconds | Saturated seconds | Saturation percentage |
|---|---|---|---|
| A | 4498 | 33 | 0.733659% |
| B | 4498 | 51 | 1.133837% |
| C | 4498 | 48 | 1.067141% |
| D | 4497 | 126 | 2.801868% |
Noise dominated data is calculated using 1-second bins in cleaned event files. If a bin has >2000 counts, and if more than 50% of those come from <1% of pixels, then it is considered to be noise-dominated and hence unusable.
| Quadrant | # 1 sec bins | Bins with >0 counts | Bins with >2000 counts | High rate bins dominated by noise | Noise dominated (total time) | Noise dominated (detector-on time) | Marked lightcurve |
|---|---|---|---|---|---|---|---|
| A | 5238 | 4499 | 0 | 0 | 0.00% | 0.00% | 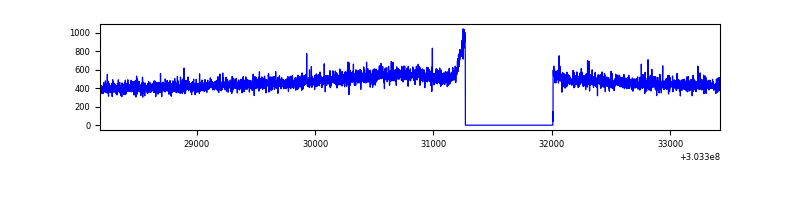 |
| B | 5238 | 4499 | 2 | 2 | 0.04% | 0.04% | 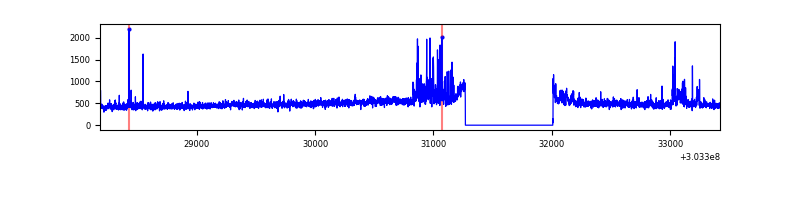 |
| C | 5238 | 4499 | 0 | 0 | 0.00% | 0.00% | 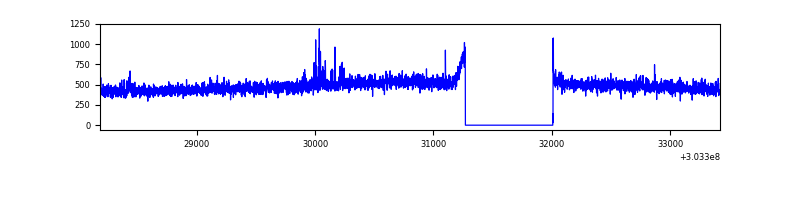 |
| D | 5237 | 4498 | 103 | 103 | 1.97% | 2.29% | 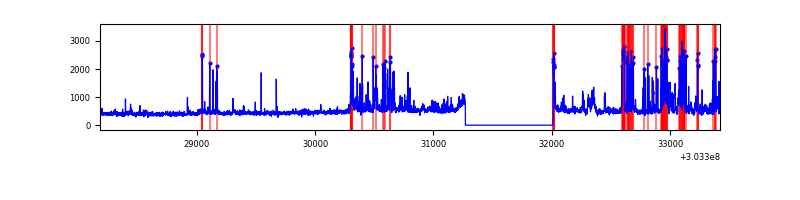 |
Top three noisy pixels from each quadrant. If the there are fewer than three noisy pixels in the level2.evt file, extra rows are filled as -1
| Pixel properties | Quadrant properties | ||||||
|---|---|---|---|---|---|---|---|
| Quadrant | DetID | PixID | Counts | Sigma | Mean | Median | Sigma |
| A | 0 | 226 | 4818 | 37.93 | 549 | 537 | 112.9 |
| A | 3 | 137 | 4565 | 35.69 | 549 | 537 | 112.9 |
| A | 12 | 194 | 3917 | 29.95 | 549 | 537 | 112.9 |
| B | 7 | 220 | 90616 | 840.87 | 546 | 531 | 107.1 |
| B | 0 | 229 | 31093 | 285.27 | 546 | 531 | 107.1 |
| B | 3 | 64 | 27238 | 249.29 | 546 | 531 | 107.1 |
| C | 14 | 238 | 82049 | 655.38 | 526 | 529 | 124.4 |
| C | 5 | 4 | 17492 | 136.37 | 526 | 529 | 124.4 |
| C | 8 | 128 | 6140 | 45.11 | 526 | 529 | 124.4 |
| D | 9 | 1 | 405957 | 3149.33 | 530 | 515 | 128.7 |
| D | 1 | 20 | 78051 | 602.27 | 530 | 515 | 128.7 |
| D | 5 | 222 | 65801 | 507.12 | 530 | 515 | 128.7 |
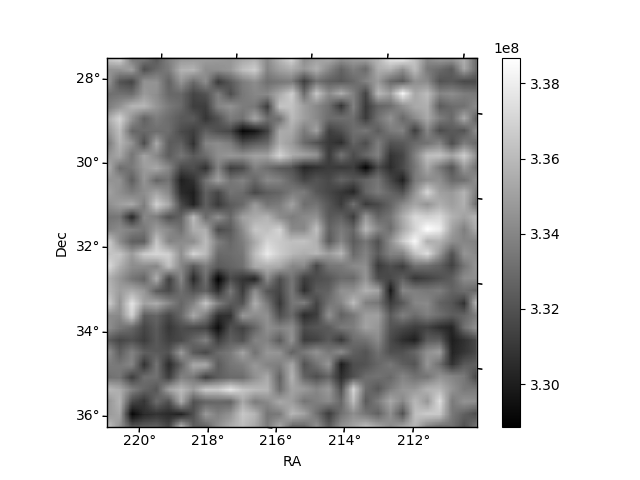
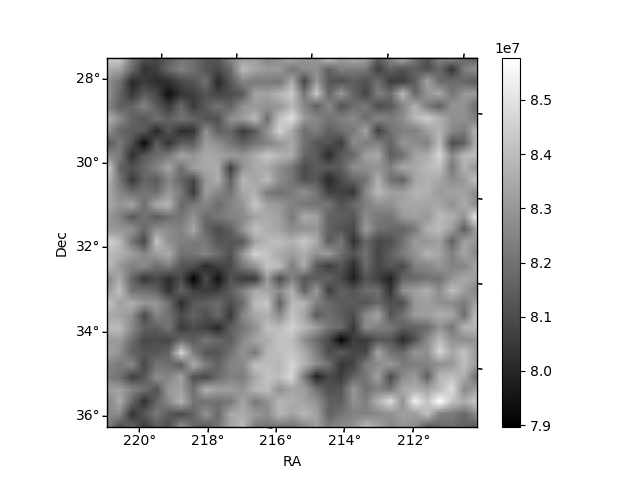
Histogram calculated using DETX and DETY for each event in the final _common_clean file
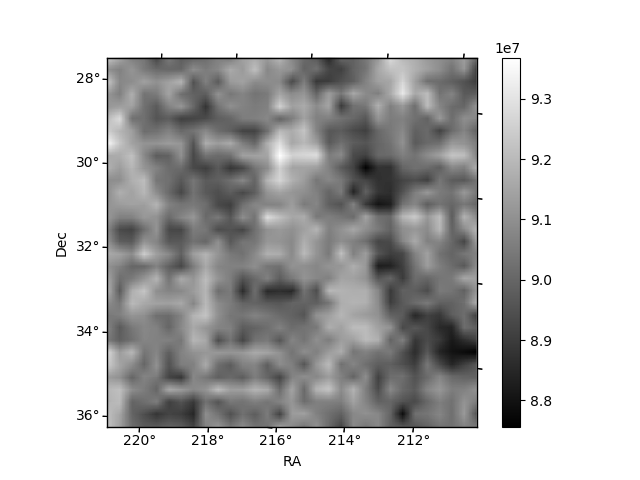
| Quadrant A | 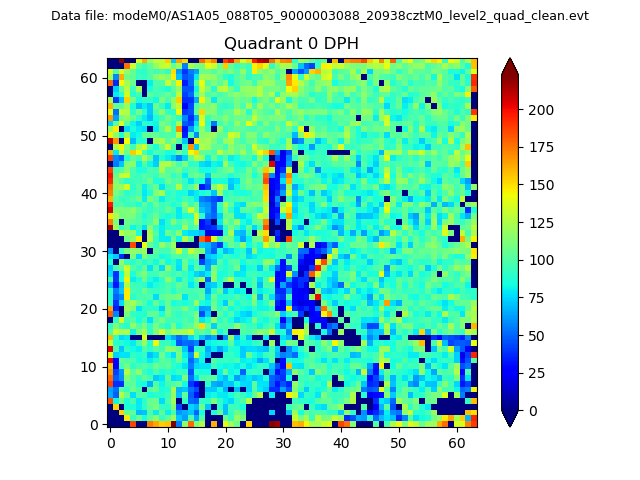 |
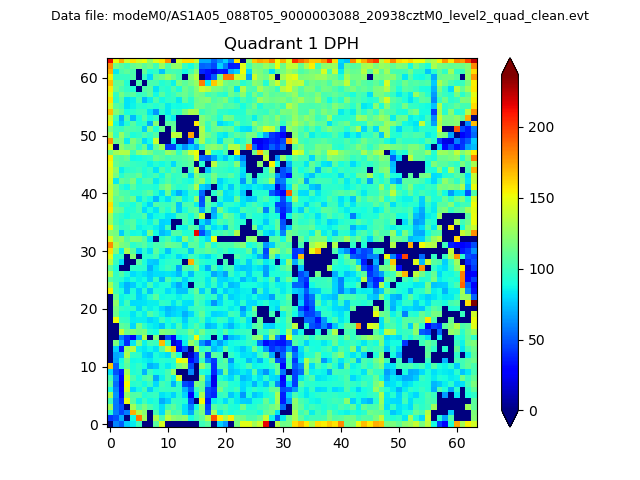 |
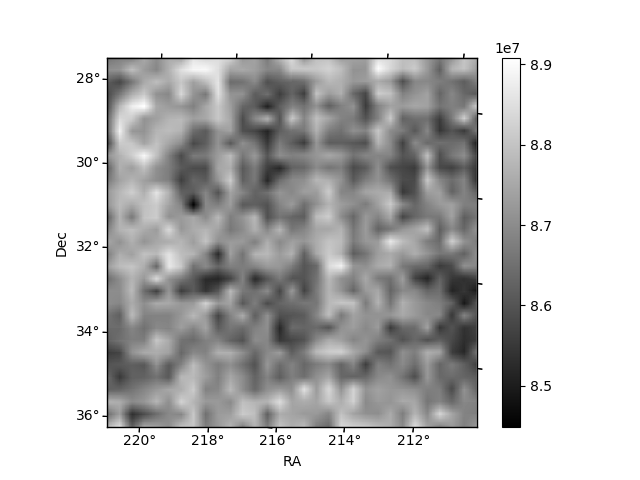
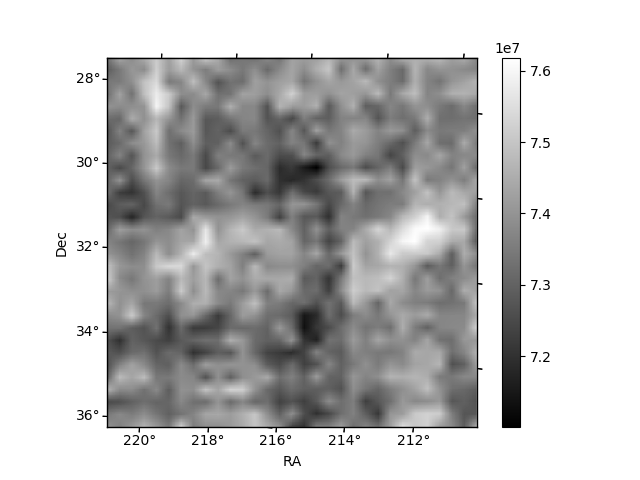
Quadrant B |
|---|---|---|---|
| Quadrant D |  |
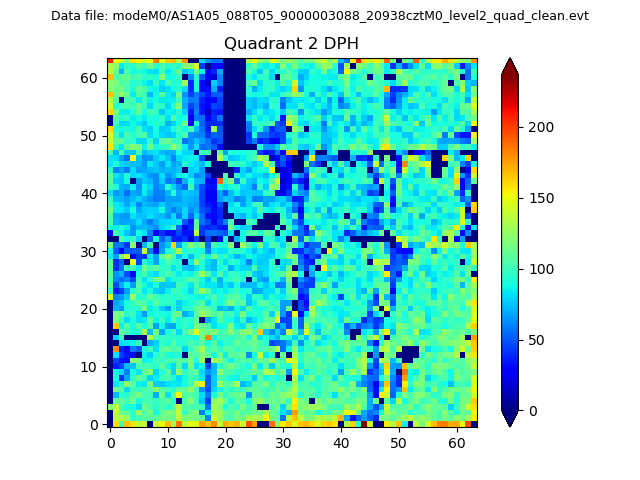 |
Quadrant C |
| Plot type | Count rate plots | Images |
|---|---|---|
| Comparison with Poisson distribution Blue bars denote a histogram of data divided into 1 sec bins. Red curve is a Poisson curve with rate = median count rate of data. |
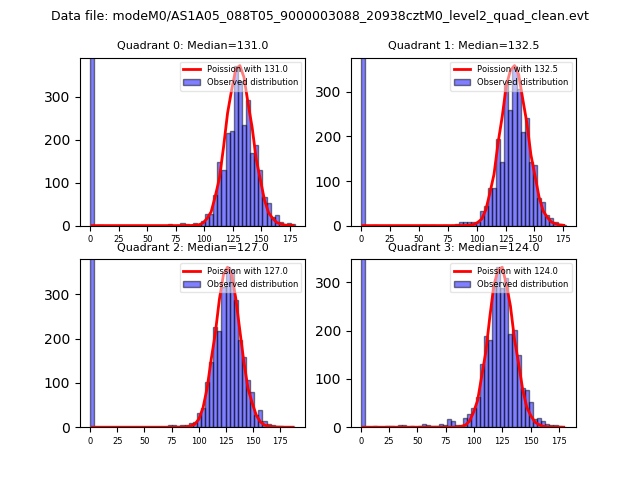 |
 |
| Quadrant-wise count rates Data is divided into 100 sec bins |
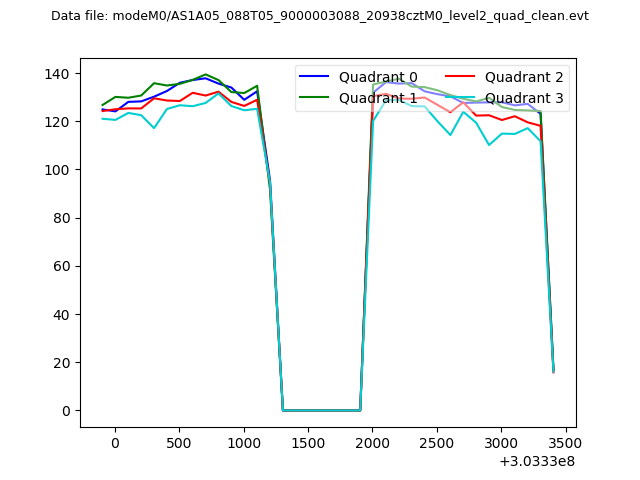 |
|
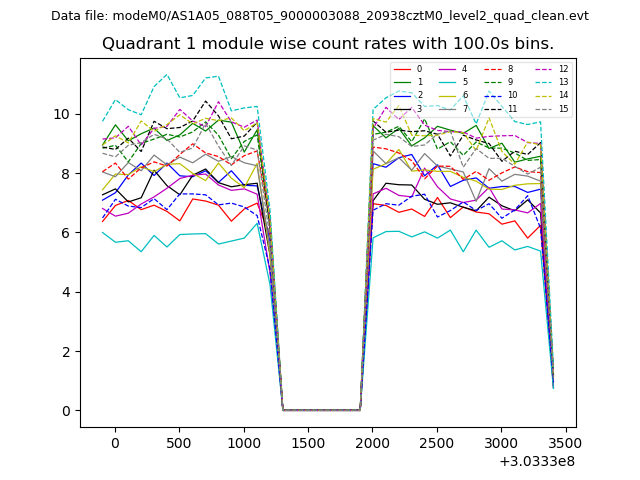
| Module-wise count rates for Quadrant A Data is divided into 100 sec bins |
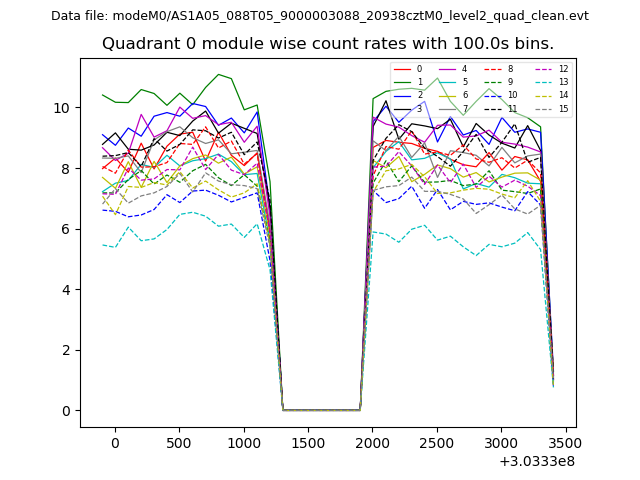 |
 |
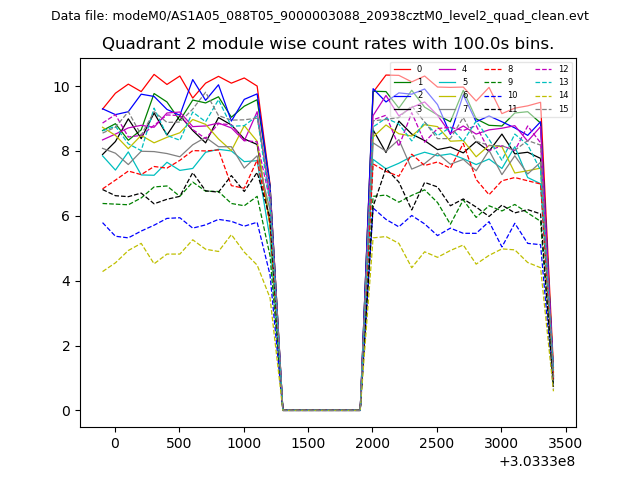
| Module-wise count rates for Quadrant B Data is divided into 100 sec bins |
 |
 |
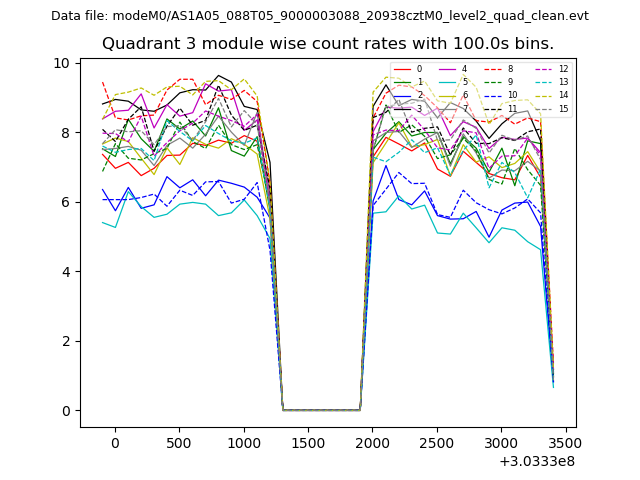
| Module-wise count rates for Quadrant C Data is divided into 100 sec bins |
 |
 |
| Module-wise count rates for Quadrant D Data is divided into 100 sec bins |
 |
 |
| Parameter | Plot |
|---|---|
| CZT HV Monitor | 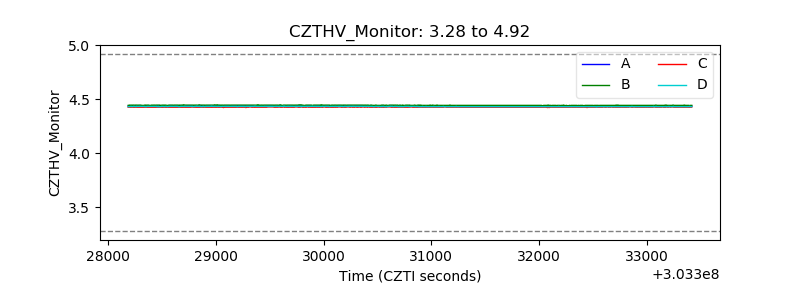 |
| D_VDD |  |
| Temperature 1 | 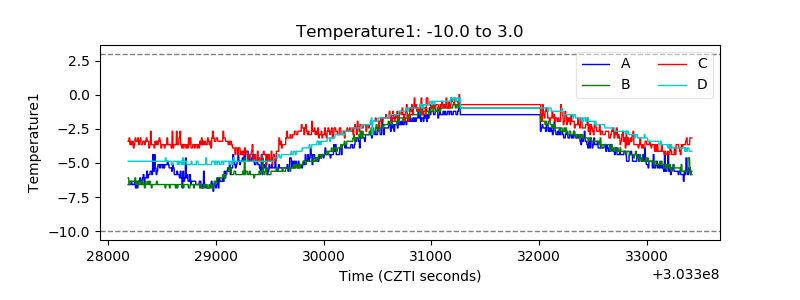 |
| Veto HV Monitor | 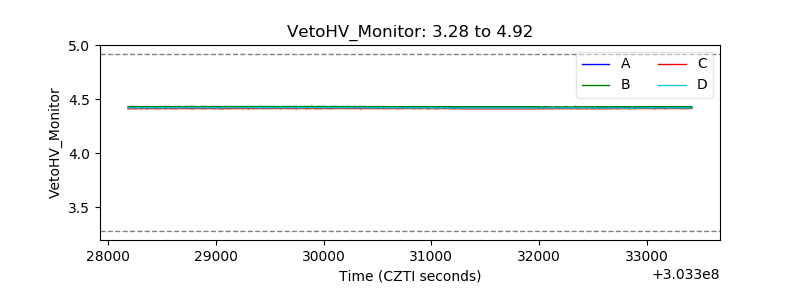 |
| Veto LLD | 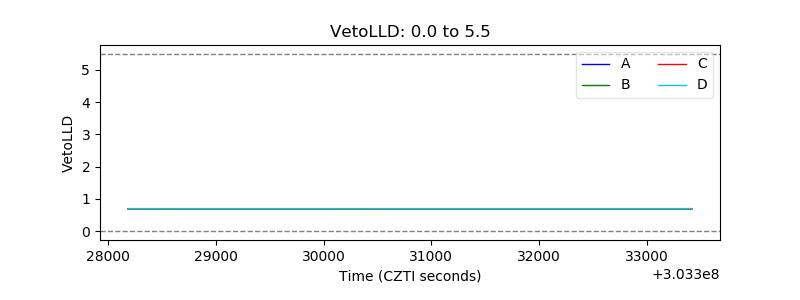 |
| Alpha Counter | 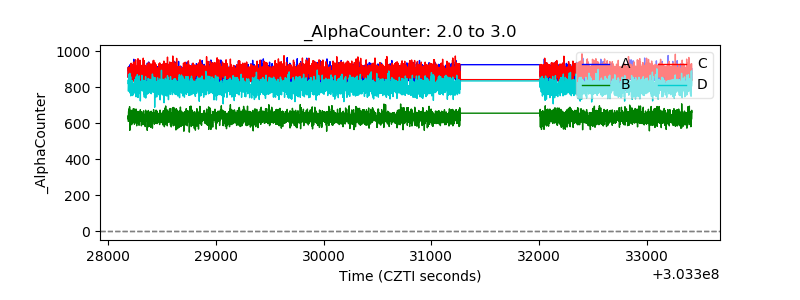 |
| _CPM_Rate | 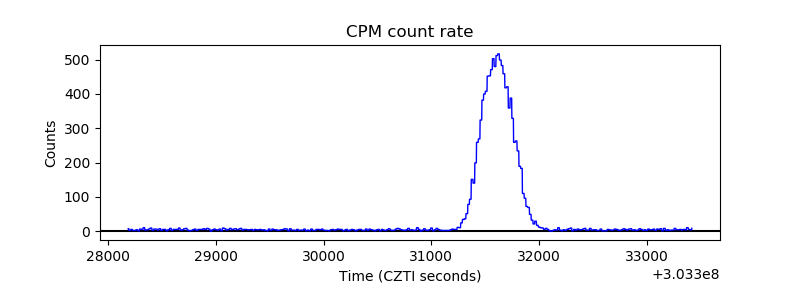 |
| CZT Counter | 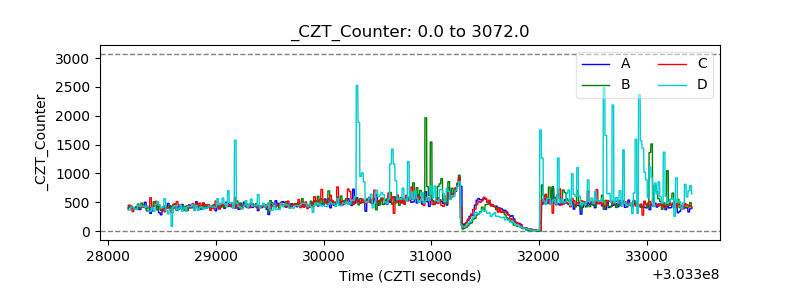 |
| +2.5 Volts monitor |  |
| +5 Volts monitor | 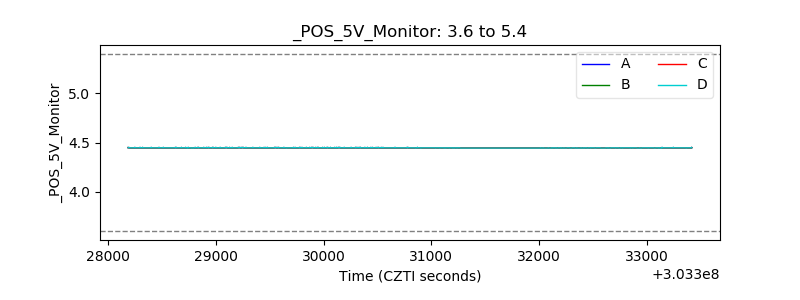 |
| _ROLL_ROT | 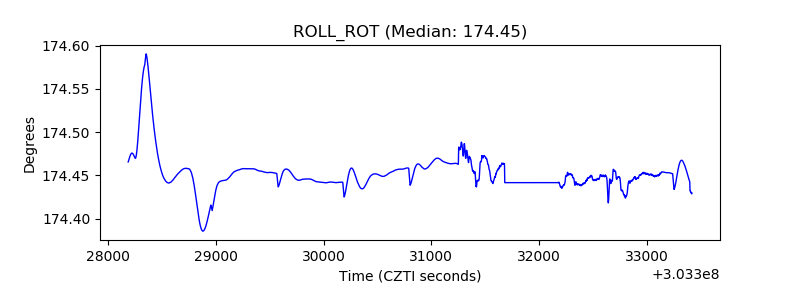 |
| _Roll_DEC | 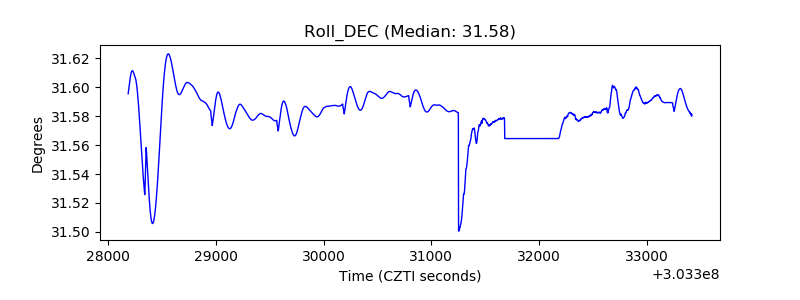 |
| _Roll_RA | 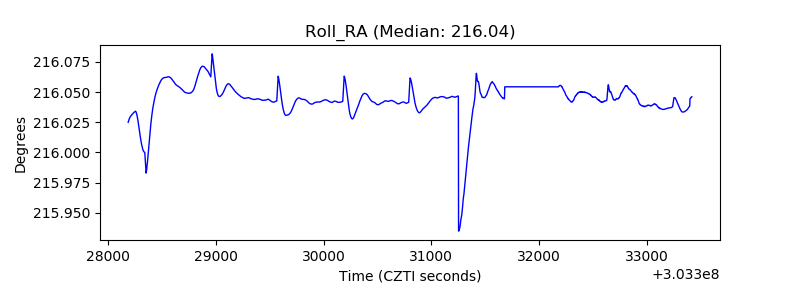 |
| Veto Counter | 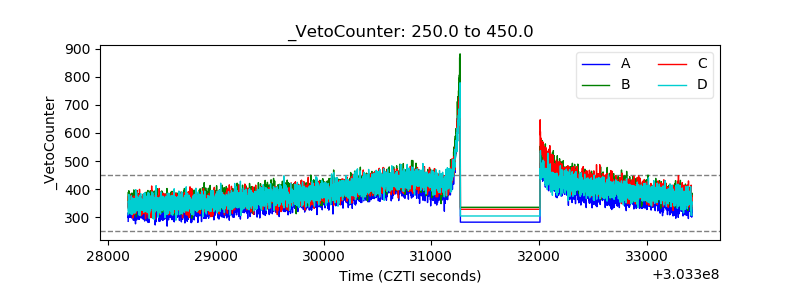 |