| Param | Original file | Final file |
|---|---|---|
| Filename | modeM0/AS1A05_088T05_9000003088_20940cztM0_level2.evt | modeM0/AS1A05_088T05_9000003088_20940cztM0_level2_quad_clean.evt |
| Size (bytes) | 490,674,240 | 81,282,240 |
| Size | 467.9 MB | 77.5 MB |
| Events in quadrant A | 3,057,741 | 519,132 |
| Events in quadrant B | 3,458,549 | 524,682 |
| Events in quadrant C | 3,186,777 | 498,643 |
| Events in quadrant D | 4,716,101 | 465,811 |
| Mode M9 | |||
|---|---|---|---|
| Quadrant | BADHDUFLAG | Total packets | Discarded packets |
| A | 0 | 17 | 0 |
| B | 0 | 18 | 0 |
| C | 0 | 18 | 0 |
| D | 0 | 18 | 0 |
| Mode M0 | |||
|---|---|---|---|
| Quadrant | BADHDUFLAG | Total packets | Discarded packets |
| A | 0 | 13280 | 3 |
| B | 0 | 14475 | 2 |
| C | 0 | 13459 | 2 |
| D | 0 | 18585 | 2 |
| Mode SS | |||
|---|---|---|---|
| Quadrant | BADHDUFLAG | Total packets | Discarded packets |
| A | 0 | 130 | 0 |
| B | 0 | 130 | 0 |
| C | 0 | 130 | 0 |
| D | 0 | 130 | 0 |
| Quadrant | Total seconds | Saturated seconds | Saturation percentage |
|---|---|---|---|
| A | 6501 | 24 | 0.369174% |
| B | 6501 | 89 | 1.369020% |
| C | 6501 | 47 | 0.722966% |
| D | 6501 | 300 | 4.614675% |
Noise dominated data is calculated using 1-second bins in cleaned event files. If a bin has >2000 counts, and if more than 50% of those come from <1% of pixels, then it is considered to be noise-dominated and hence unusable.
| Quadrant | # 1 sec bins | Bins with >0 counts | Bins with >2000 counts | High rate bins dominated by noise | Noise dominated (total time) | Noise dominated (detector-on time) | Marked lightcurve |
|---|---|---|---|---|---|---|---|
| A | 7562 | 6502 | 0 | 0 | 0.00% | 0.00% | 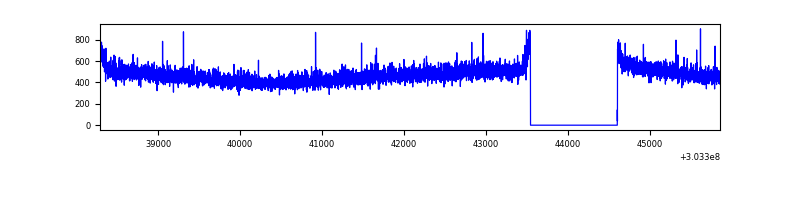 |
| B | 7562 | 6502 | 20 | 20 | 0.26% | 0.31% | 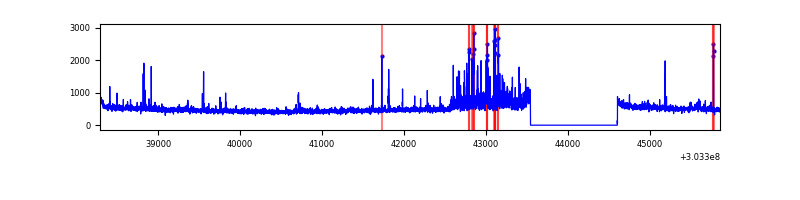 |
| C | 7562 | 6502 | 0 | 0 | 0.00% | 0.00% | 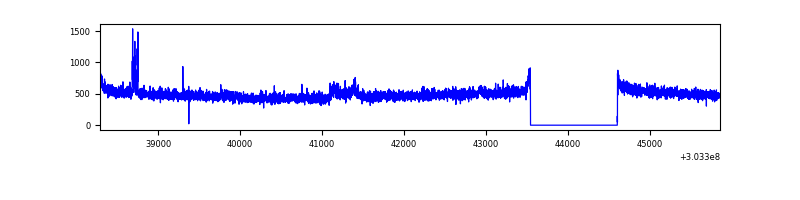 |
| D | 7562 | 6502 | 272 | 272 | 3.60% | 4.18% | 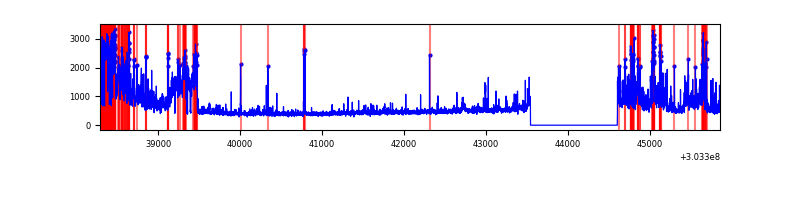 |
Top three noisy pixels from each quadrant. If the there are fewer than three noisy pixels in the level2.evt file, extra rows are filled as -1
| Pixel properties | Quadrant properties | ||||||
|---|---|---|---|---|---|---|---|
| Quadrant | DetID | PixID | Counts | Sigma | Mean | Median | Sigma |
| A | 0 | 226 | 6967 | 38.53 | 795 | 777 | 160.7 |
| A | 3 | 137 | 6288 | 34.3 | 795 | 777 | 160.7 |
| A | 12 | 194 | 5783 | 31.16 | 795 | 777 | 160.7 |
| B | 7 | 220 | 206689 | 1333.49 | 797 | 775 | 154.4 |
| B | 3 | 64 | 65367 | 418.3 | 797 | 775 | 154.4 |
| B | 0 | 230 | 19494 | 121.22 | 797 | 775 | 154.4 |
| C | 14 | 238 | 118628 | 662.72 | 764 | 770 | 177.8 |
| C | 3 | 233 | 46817 | 258.92 | 764 | 770 | 177.8 |
| C | 9 | 54 | 25657 | 139.94 | 764 | 770 | 177.8 |
| D | 7 | 238 | 1038856 | 5648.59 | 752 | 730 | 183.8 |
| D | 1 | 52 | 400385 | 2174.58 | 752 | 730 | 183.8 |
| D | 5 | 222 | 195160 | 1057.92 | 752 | 730 | 183.8 |
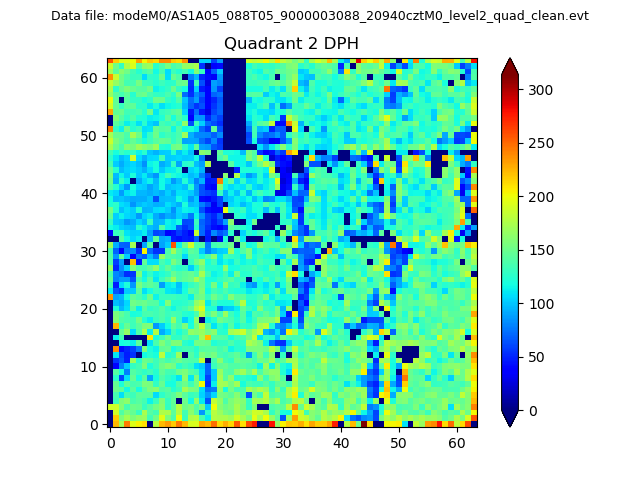
Histogram calculated using DETX and DETY for each event in the final _common_clean file
| Quadrant A | 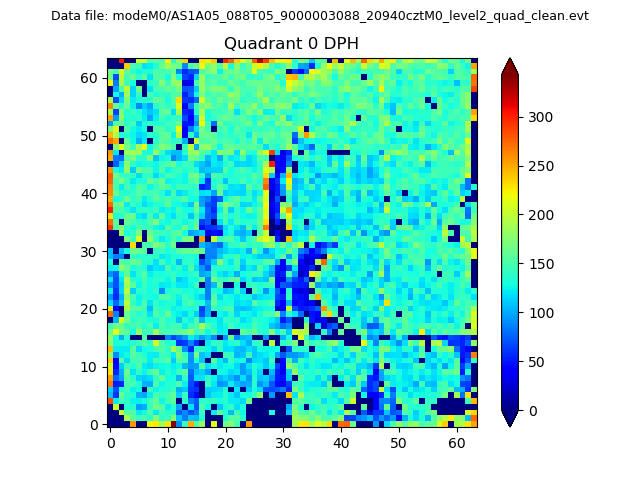 |
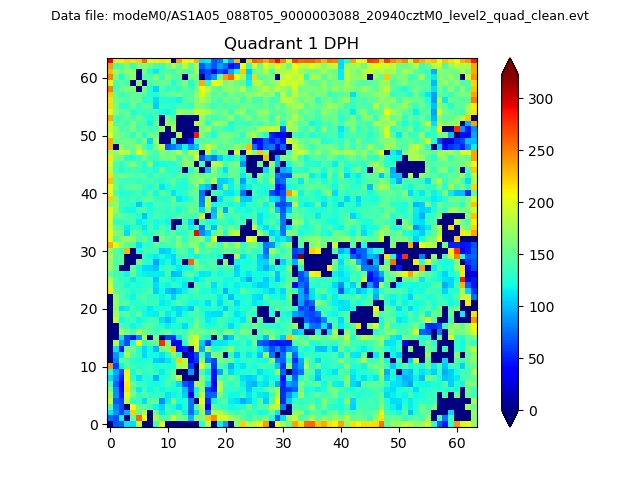 |
Quadrant B |
|---|---|---|---|
| Quadrant D | 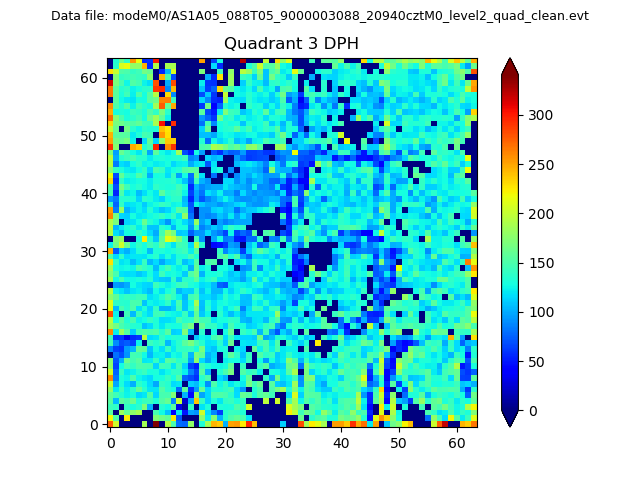 |
 |
Quadrant C |
| Plot type | Count rate plots | Images |
|---|---|---|
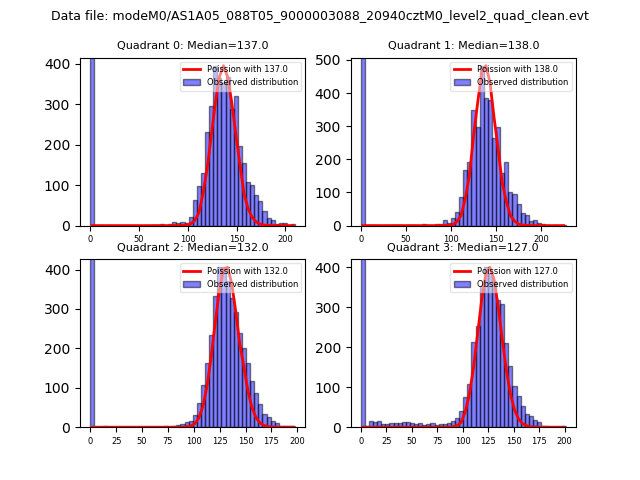
| Comparison with Poisson distribution Blue bars denote a histogram of data divided into 1 sec bins. Red curve is a Poisson curve with rate = median count rate of data. |
 |
 |
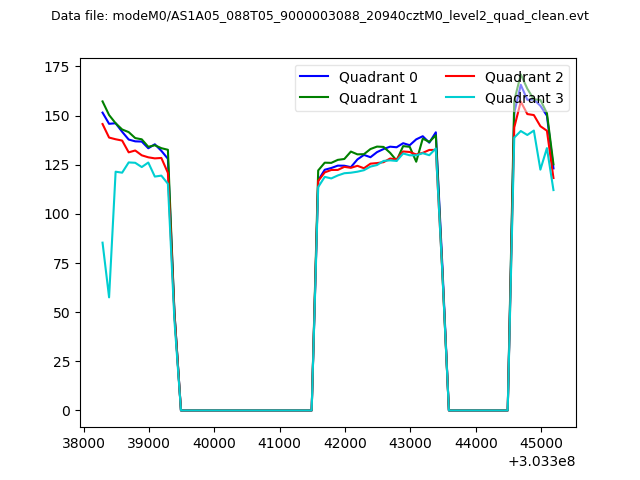
| Quadrant-wise count rates Data is divided into 100 sec bins |
 |
|
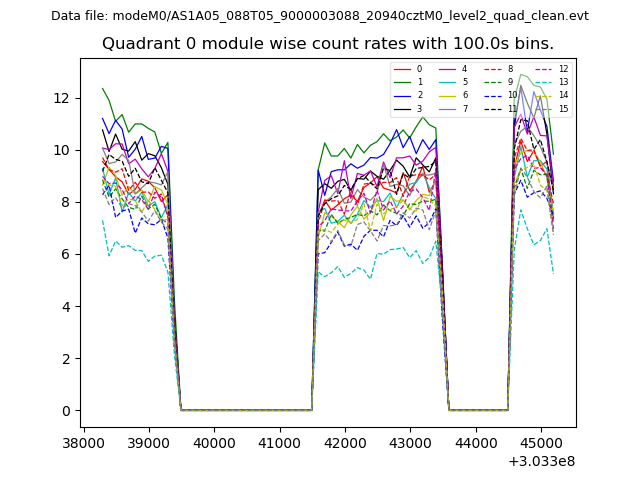
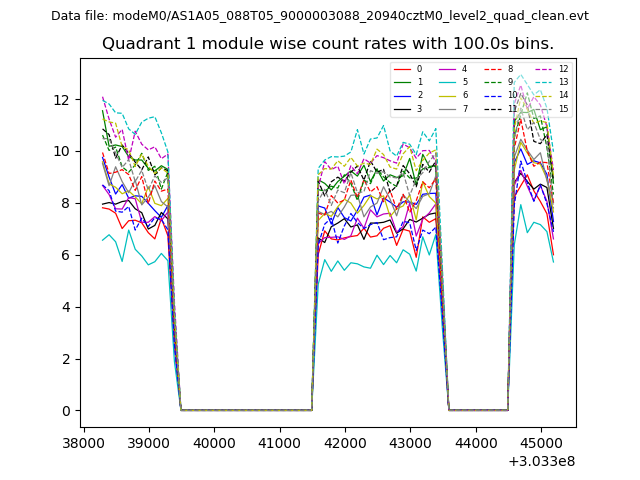
| Module-wise count rates for Quadrant A Data is divided into 100 sec bins |
 |
 |
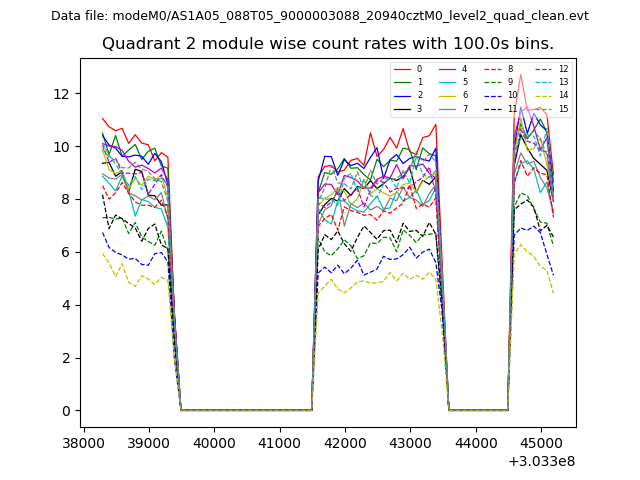
| Module-wise count rates for Quadrant B Data is divided into 100 sec bins |
 |
 |
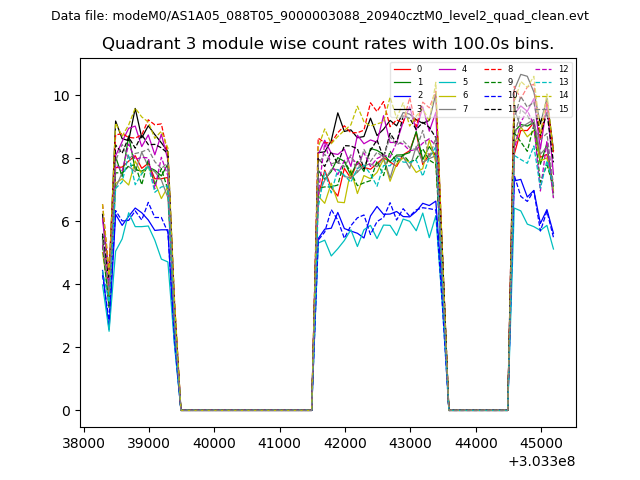
| Module-wise count rates for Quadrant C Data is divided into 100 sec bins |
 |
 |
| Module-wise count rates for Quadrant D Data is divided into 100 sec bins |
 |
 |
| Parameter | Plot |
|---|---|
| CZT HV Monitor | 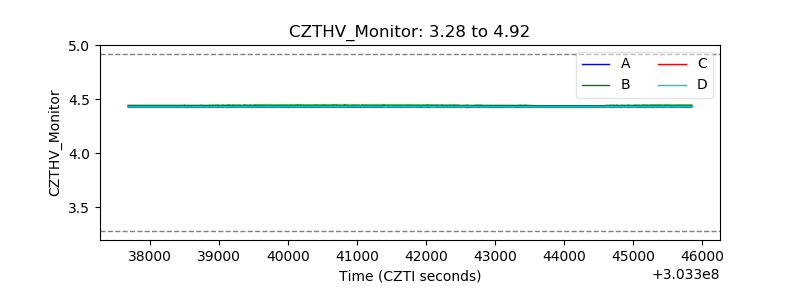 |
| D_VDD | 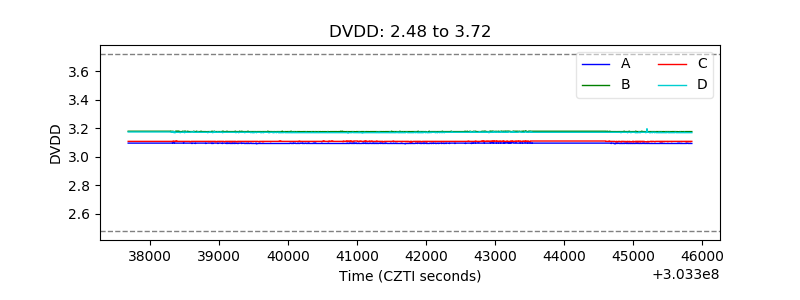 |
| Temperature 1 | 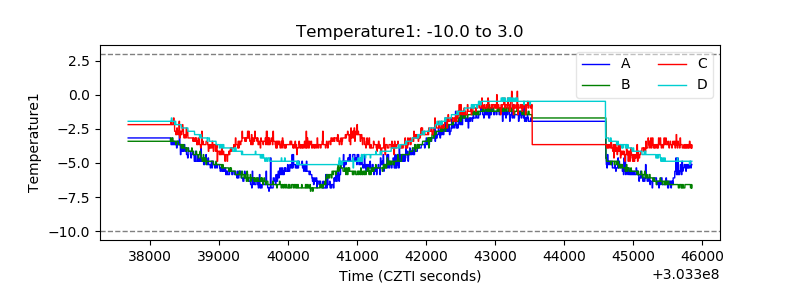 |
| Veto HV Monitor | 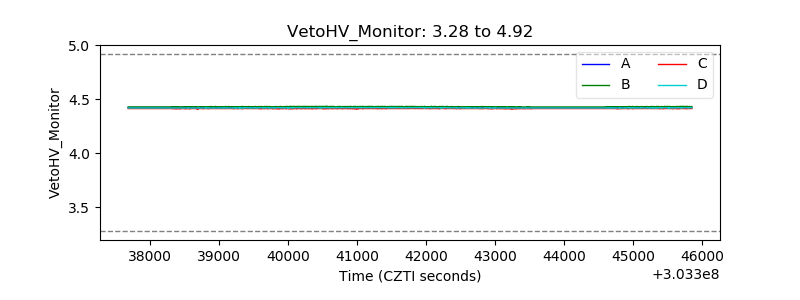 |
| Veto LLD | 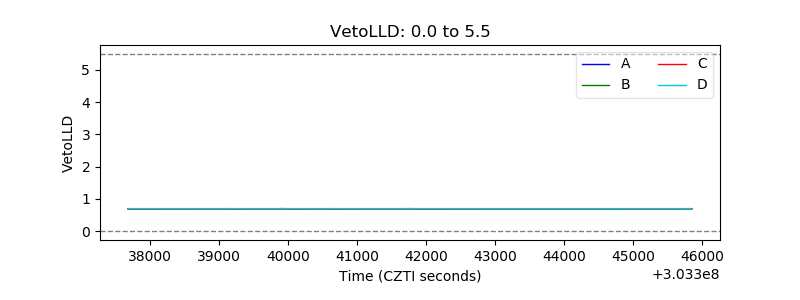 |
| Alpha Counter | 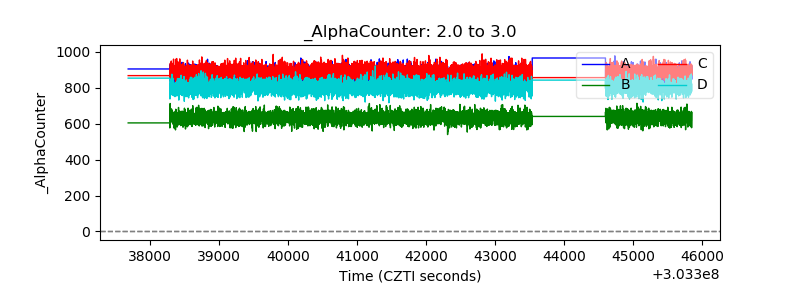 |
| _CPM_Rate | 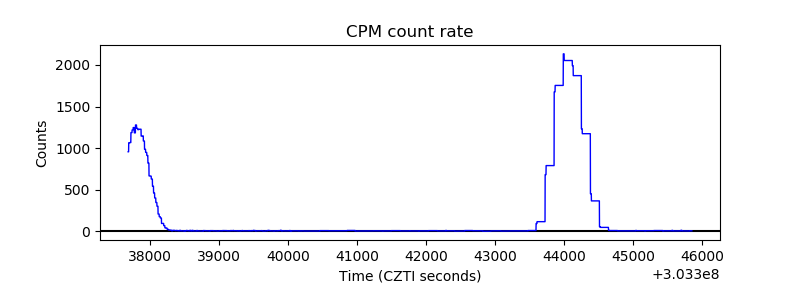 |
| CZT Counter | 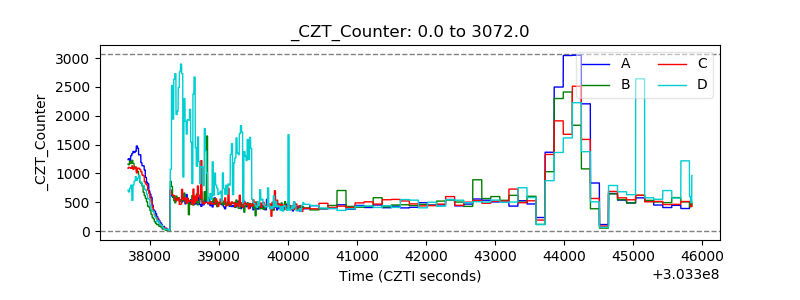 |
| +2.5 Volts monitor |  |
| +5 Volts monitor |  |
| _ROLL_ROT | 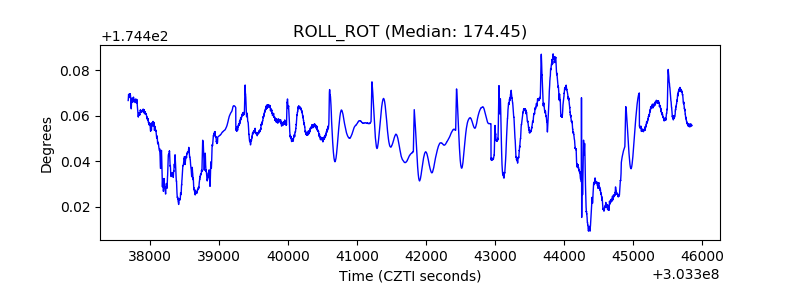 |
| _Roll_DEC | 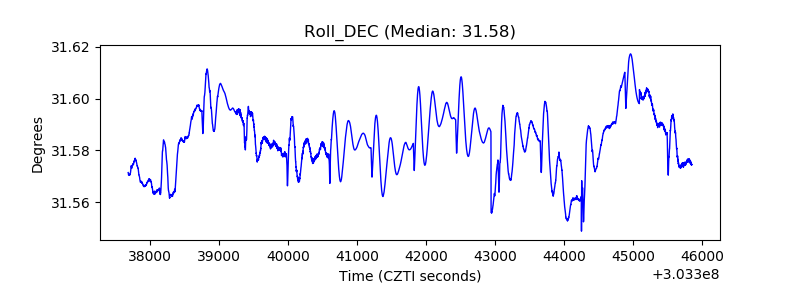 |
| _Roll_RA | 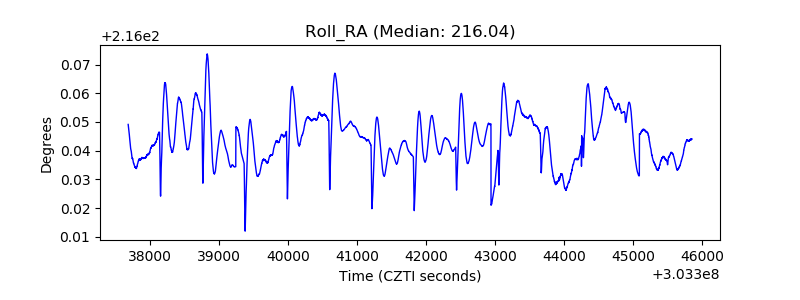 |
| Veto Counter | 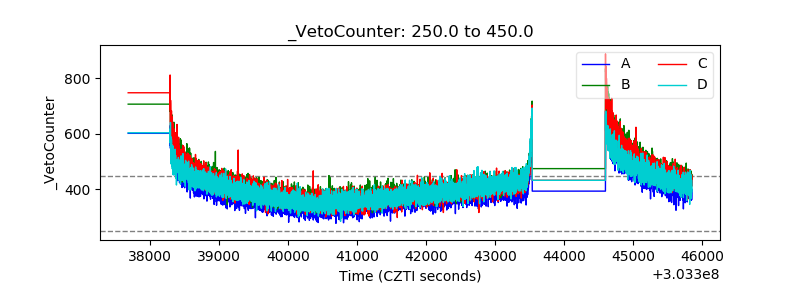 |