| Param | Original file | Final file |
|---|---|---|
| Filename | modeM0/AS1A05_088T05_9000003088_20943cztM0_level2.evt | modeM0/AS1A05_088T05_9000003088_20943cztM0_level2_quad_clean.evt |
| Size (bytes) | 454,394,880 | 58,043,520 |
| Size | 433.3 MB | 55.4 MB |
| Events in quadrant A | 2,957,102 | 350,998 |
| Events in quadrant B | 3,428,306 | 350,071 |
| Events in quadrant C | 2,964,685 | 336,234 |
| Events in quadrant D | 4,021,141 | 318,481 |
| Mode M9 | |||
|---|---|---|---|
| Quadrant | BADHDUFLAG | Total packets | Discarded packets |
| A | 0 | 13 | 0 |
| B | 0 | 13 | 0 |
| C | 0 | 13 | 0 |
| D | 0 | 13 | 0 |
| Mode M0 | |||
|---|---|---|---|
| Quadrant | BADHDUFLAG | Total packets | Discarded packets |
| A | 0 | 12773 | 576 |
| B | 0 | 14453 | 653 |
| C | 0 | 12789 | 561 |
| D | 0 | 16513 | 978 |
| Mode SS | |||
|---|---|---|---|
| Quadrant | BADHDUFLAG | Total packets | Discarded packets |
| A | 0 | 122 | 4 |
| B | 0 | 122 | 4 |
| C | 0 | 122 | 8 |
| D | 0 | 122 | 4 |
| Quadrant | Total seconds | Saturated seconds | Saturation percentage |
|---|---|---|---|
| A | 5744 | 50 | 0.870474% |
| B | 5741 | 146 | 2.543111% |
| C | 5761 | 64 | 1.110918% |
| D | 5713 | 258 | 4.516016% |
Noise dominated data is calculated using 1-second bins in cleaned event files. If a bin has >2000 counts, and if more than 50% of those come from <1% of pixels, then it is considered to be noise-dominated and hence unusable.
| Quadrant | # 1 sec bins | Bins with >0 counts | Bins with >2000 counts | High rate bins dominated by noise | Noise dominated (total time) | Noise dominated (detector-on time) | Marked lightcurve |
|---|---|---|---|---|---|---|---|
| A | 7284 | 5885 | 3 | 3 | 0.04% | 0.05% |  |
| B | 7283 | 5886 | 45 | 45 | 0.62% | 0.76% |  |
| C | 7284 | 5909 | 0 | 0 | 0.00% | 0.00% |  |
| D | 7286 | 5901 | 217 | 217 | 2.98% | 3.68% |  |
Top three noisy pixels from each quadrant. If the there are fewer than three noisy pixels in the level2.evt file, extra rows are filled as -1
| Pixel properties | Quadrant properties | ||||||
|---|---|---|---|---|---|---|---|
| Quadrant | DetID | PixID | Counts | Sigma | Mean | Median | Sigma |
| A | 15 | 174 | 9201 | 55.29 | 765 | 752 | 152.8 |
| A | 5 | 16 | 7839 | 46.37 | 765 | 752 | 152.8 |
| A | 0 | 226 | 6575 | 38.1 | 765 | 752 | 152.8 |
| B | 7 | 220 | 326190 | 2288.92 | 763 | 745 | 142.2 |
| B | 0 | 190 | 30493 | 209.22 | 763 | 745 | 142.2 |
| B | 0 | 229 | 27207 | 186.11 | 763 | 745 | 142.2 |
| C | 14 | 238 | 116147 | 689.83 | 726 | 733 | 167.3 |
| C | 3 | 233 | 14591 | 82.83 | 726 | 733 | 167.3 |
| C | 13 | 61 | 5168 | 26.51 | 726 | 733 | 167.3 |
| D | 9 | 1 | 666363 | 3832.58 | 718 | 698 | 173.7 |
| D | 5 | 222 | 289937 | 1665.3 | 718 | 698 | 173.7 |
| D | 1 | 52 | 249813 | 1434.28 | 718 | 698 | 173.7 |
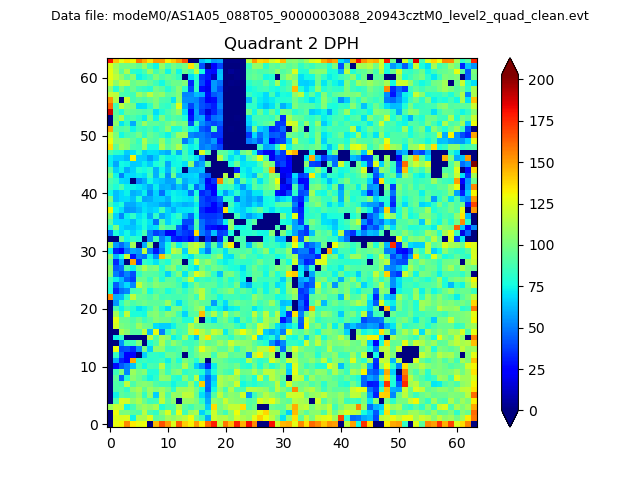
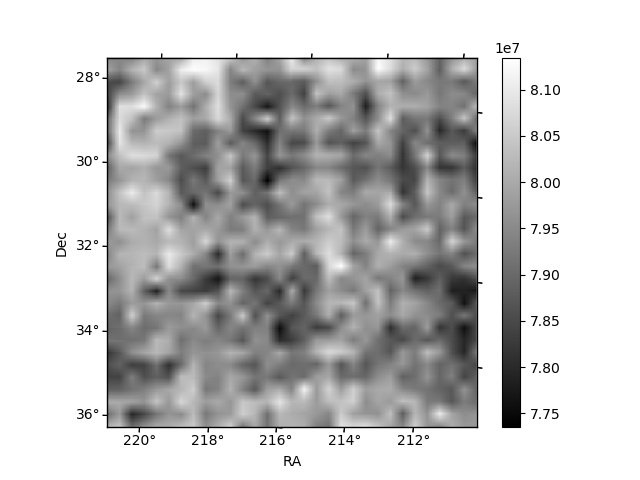
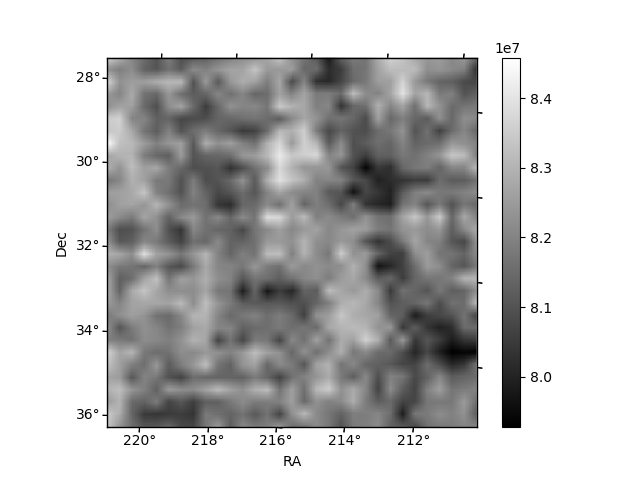
Histogram calculated using DETX and DETY for each event in the final _common_clean file
| Quadrant A | 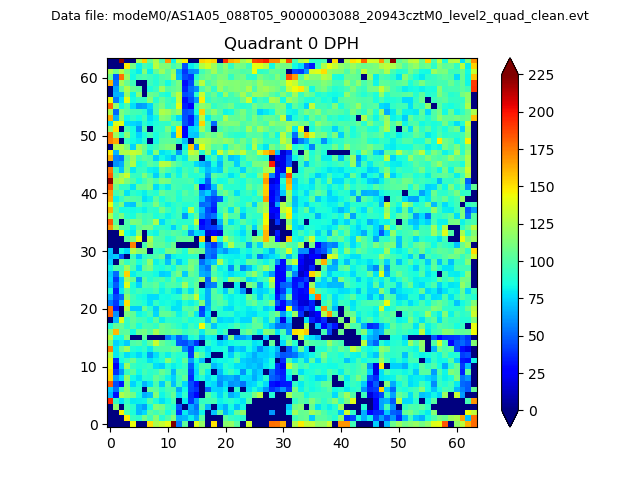 |
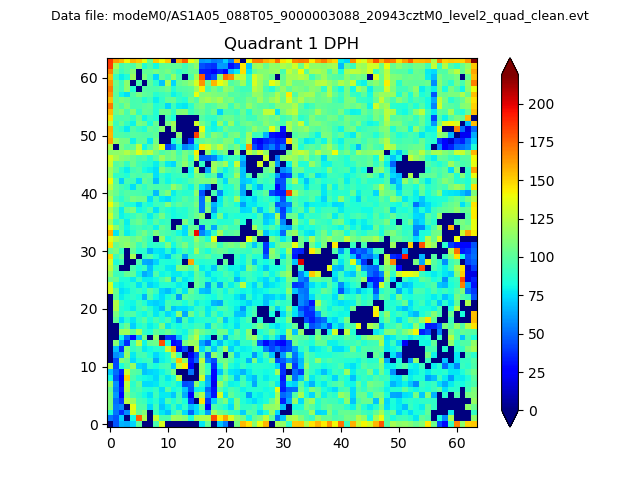 |
Quadrant B |
|---|---|---|---|
| Quadrant D | 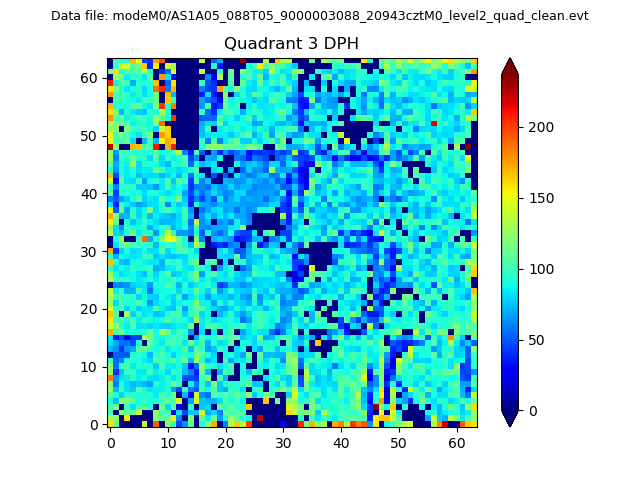 |
 |
Quadrant C |
| Plot type | Count rate plots | Images |
|---|---|---|
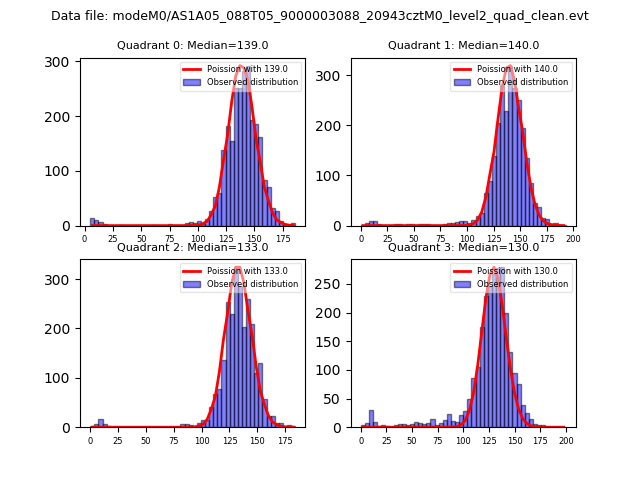
| Comparison with Poisson distribution Blue bars denote a histogram of data divided into 1 sec bins. Red curve is a Poisson curve with rate = median count rate of data. |
 |
 |
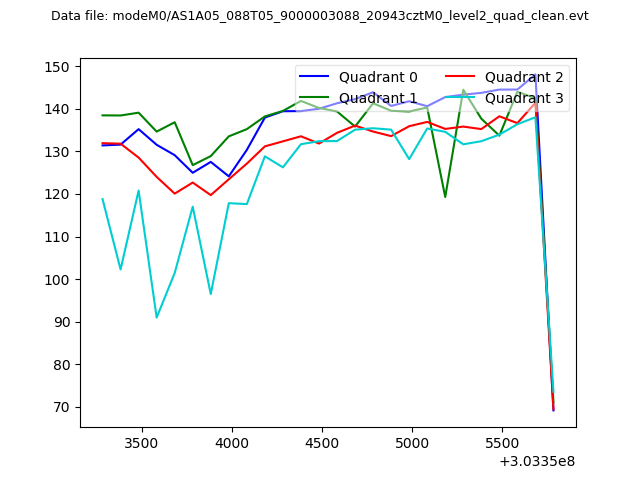
| Quadrant-wise count rates Data is divided into 100 sec bins |
 |
|
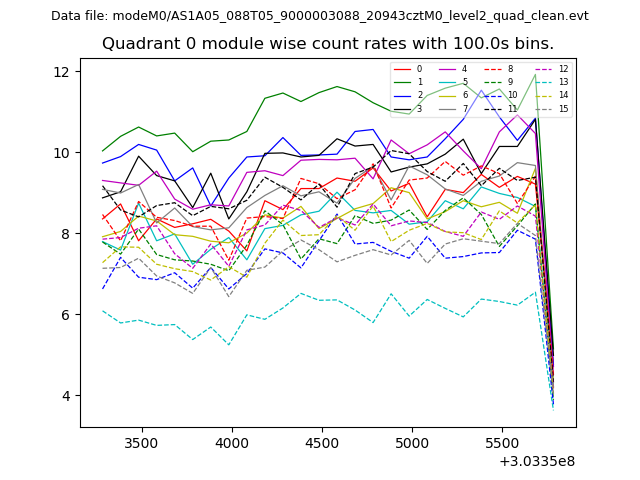
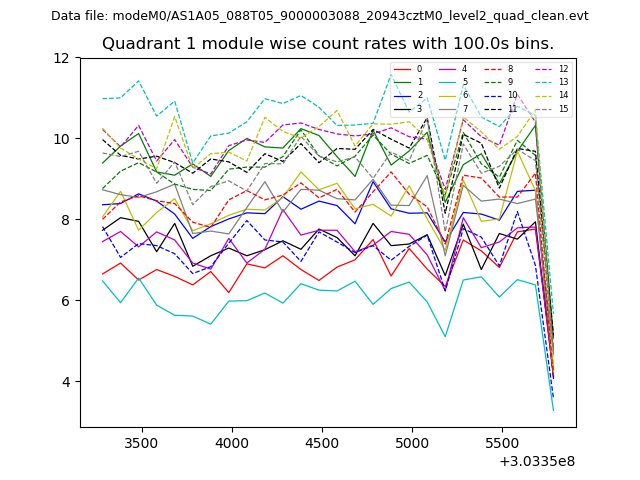
| Module-wise count rates for Quadrant A Data is divided into 100 sec bins |
 |
 |
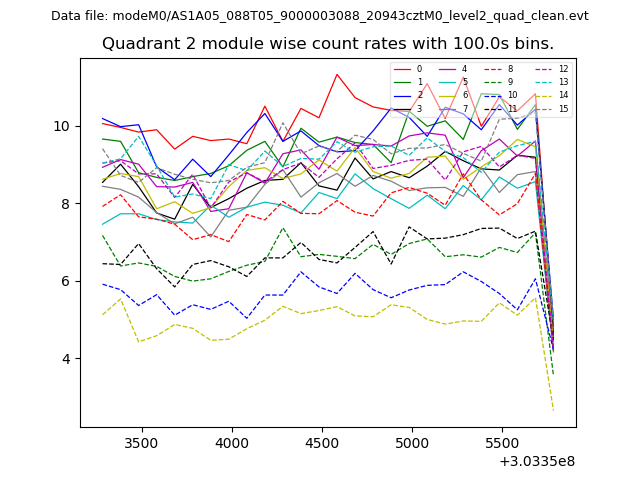
| Module-wise count rates for Quadrant B Data is divided into 100 sec bins |
 |
 |
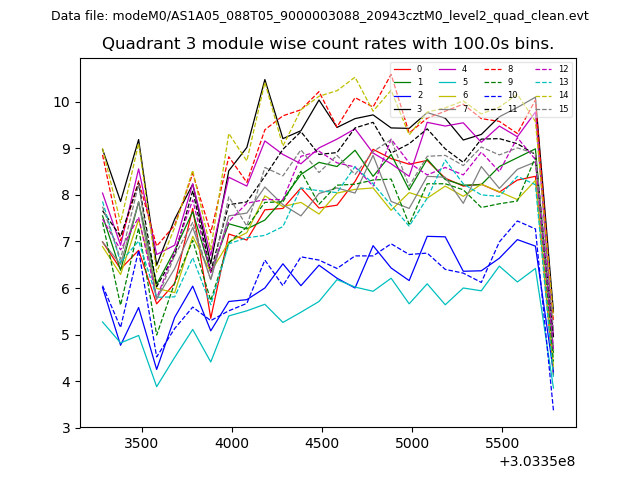
| Module-wise count rates for Quadrant C Data is divided into 100 sec bins |
 |
 |
| Module-wise count rates for Quadrant D Data is divided into 100 sec bins |
 |
 |
| Parameter | Plot |
|---|---|
| CZT HV Monitor | 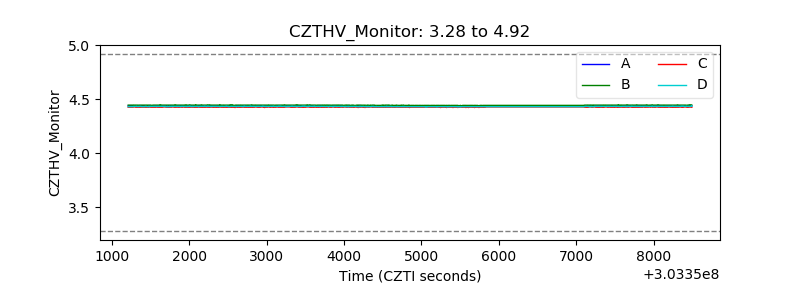 |
| D_VDD | 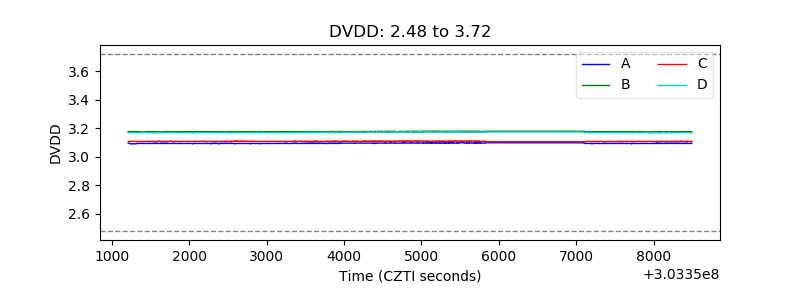 |
| Temperature 1 | 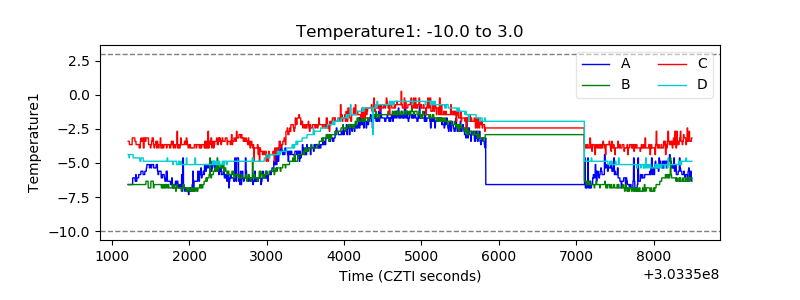 |
| Veto HV Monitor | 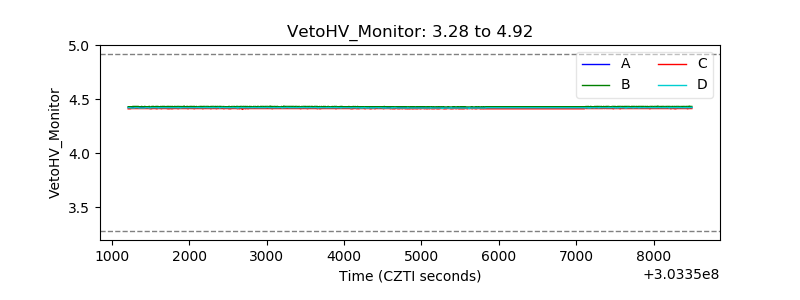 |
| Veto LLD |  |
| Alpha Counter | 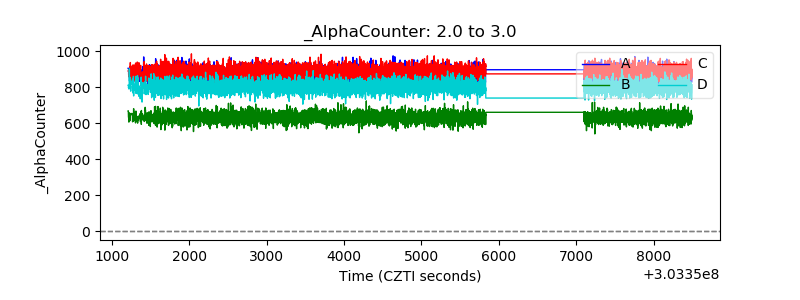 |
| _CPM_Rate | 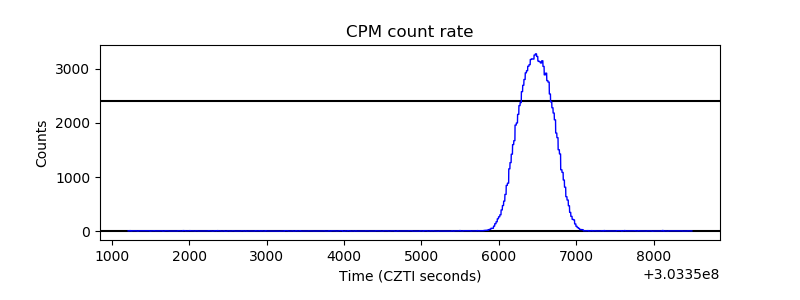 |
| CZT Counter | 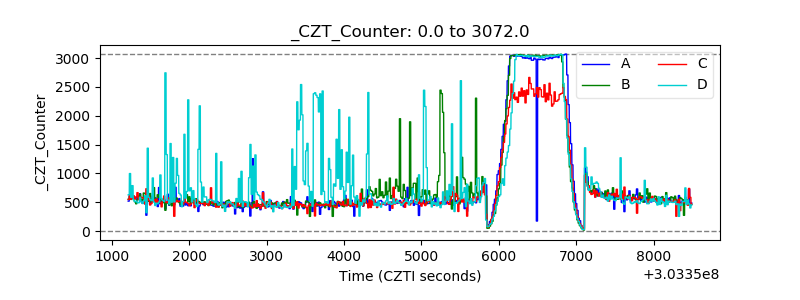 |
| +2.5 Volts monitor |  |
| +5 Volts monitor | 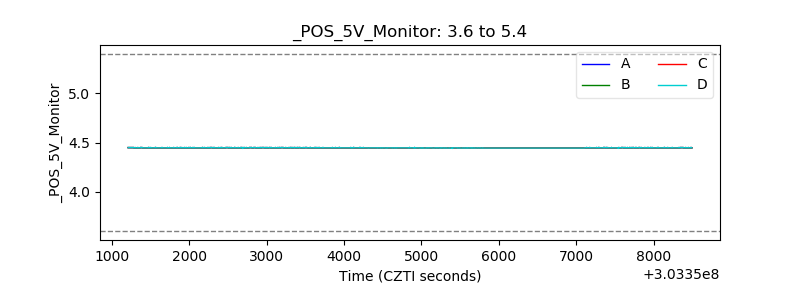 |
| _ROLL_ROT |  |
| _Roll_DEC | 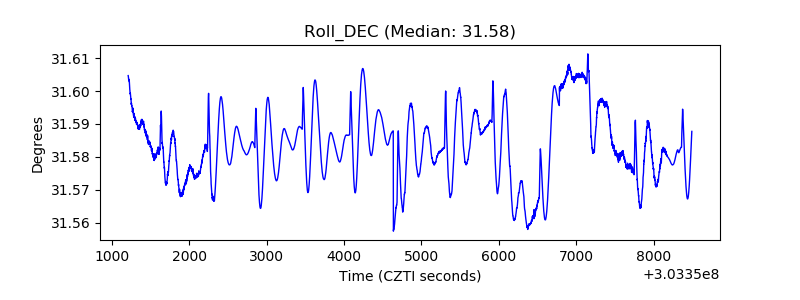 |
| _Roll_RA | 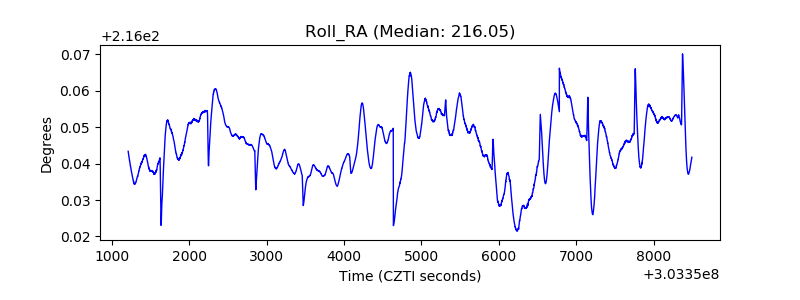 |
| Veto Counter |  |