| Param | Original file | Final file |
|---|---|---|
| Filename | modeM0/AS1A05_088T05_9000003088_20946cztM0_level2.evt | modeM0/AS1A05_088T05_9000003088_20946cztM0_level2_quad_clean.evt |
| Size (bytes) | 523,249,920 | 92,836,800 |
| Size | 499.0 MB | 88.5 MB |
| Events in quadrant A | 3,395,676 | 612,004 |
| Events in quadrant B | 3,767,462 | 615,950 |
| Events in quadrant C | 3,355,274 | 577,461 |
| Events in quadrant D | 4,897,770 | 563,299 |
| Mode M9 | |||
|---|---|---|---|
| Quadrant | BADHDUFLAG | Total packets | Discarded packets |
| A | 0 | 18 | 0 |
| B | 0 | 19 | 0 |
| C | 0 | 19 | 0 |
| D | 0 | 19 | 0 |
| Mode M0 | |||
|---|---|---|---|
| Quadrant | BADHDUFLAG | Total packets | Discarded packets |
| A | 0 | 13774 | 2 |
| B | 0 | 15059 | 2 |
| C | 0 | 13698 | 2 |
| D | 0 | 18520 | 2 |
| Mode SS | |||
|---|---|---|---|
| Quadrant | BADHDUFLAG | Total packets | Discarded packets |
| A | 0 | 128 | 0 |
| B | 0 | 128 | 0 |
| C | 0 | 128 | 0 |
| D | 0 | 128 | 0 |
| Quadrant | Total seconds | Saturated seconds | Saturation percentage |
|---|---|---|---|
| A | 6348 | 142 | 2.236925% |
| B | 6348 | 196 | 3.087587% |
| C | 6348 | 149 | 2.347196% |
| D | 6348 | 537 | 8.459357% |
Noise dominated data is calculated using 1-second bins in cleaned event files. If a bin has >2000 counts, and if more than 50% of those come from <1% of pixels, then it is considered to be noise-dominated and hence unusable.
| Quadrant | # 1 sec bins | Bins with >0 counts | Bins with >2000 counts | High rate bins dominated by noise | Noise dominated (total time) | Noise dominated (detector-on time) | Marked lightcurve |
|---|---|---|---|---|---|---|---|
| A | 7558 | 6349 | 1 | 1 | 0.01% | 0.02% | 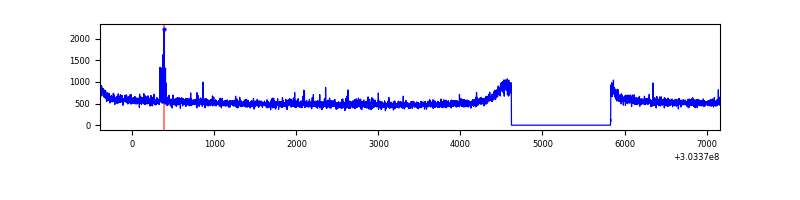 |
| B | 7558 | 6349 | 23 | 23 | 0.30% | 0.36% | 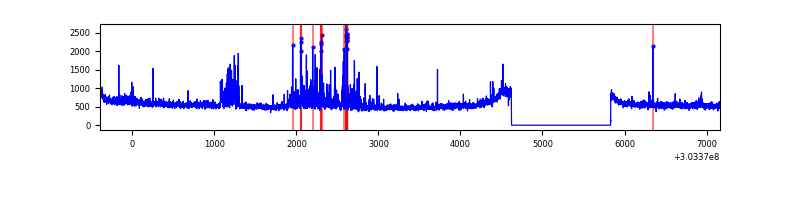 |
| C | 7558 | 6349 | 0 | 0 | 0.00% | 0.00% | 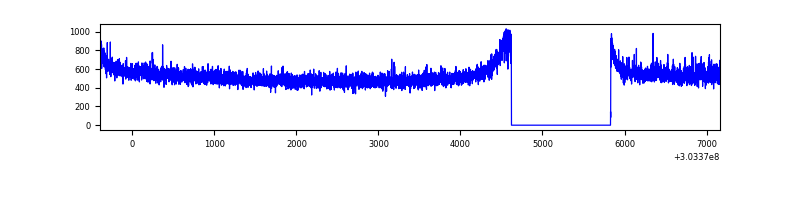 |
| D | 7558 | 6349 | 401 | 401 | 5.31% | 6.32% | 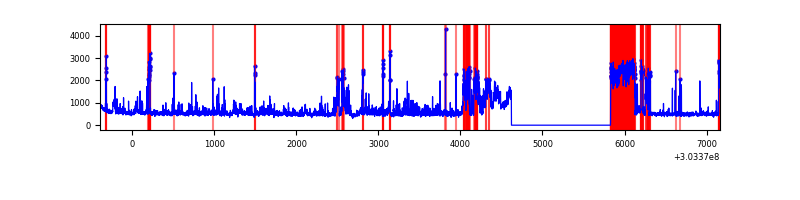 |
Top three noisy pixels from each quadrant. If the there are fewer than three noisy pixels in the level2.evt file, extra rows are filled as -1
| Pixel properties | Quadrant properties | ||||||
|---|---|---|---|---|---|---|---|
| Quadrant | DetID | PixID | Counts | Sigma | Mean | Median | Sigma |
| A | 5 | 16 | 35171 | 197.79 | 874 | 857 | 173.5 |
| A | 0 | 226 | 7570 | 38.69 | 874 | 857 | 173.5 |
| A | 3 | 137 | 6676 | 33.54 | 874 | 857 | 173.5 |
| B | 7 | 220 | 187990 | 1146.56 | 865 | 847 | 163.2 |
| B | 0 | 230 | 93035 | 564.81 | 865 | 847 | 163.2 |
| B | 0 | 229 | 37681 | 225.67 | 865 | 847 | 163.2 |
| C | 14 | 238 | 130524 | 687.93 | 816 | 824 | 188.5 |
| C | 7 | 247 | 36494 | 189.19 | 816 | 824 | 188.5 |
| C | 13 | 61 | 5717 | 25.95 | 816 | 824 | 188.5 |
| D | 1 | 52 | 1128664 | 5841.09 | 806 | 786 | 193.1 |
| D | 5 | 222 | 235360 | 1214.82 | 806 | 786 | 193.1 |
| D | 15 | 0 | 192695 | 993.86 | 806 | 786 | 193.1 |
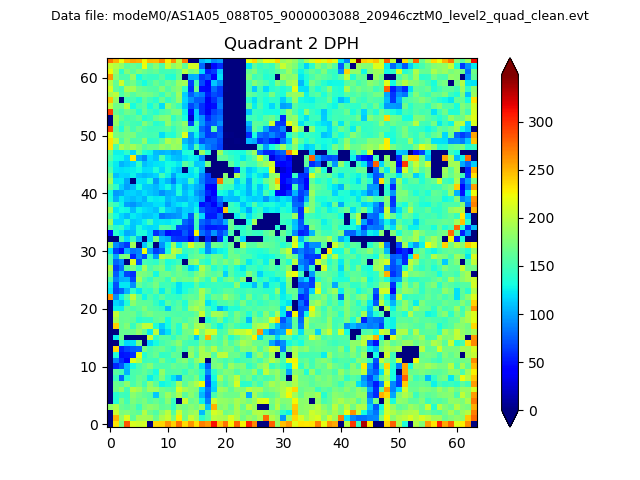
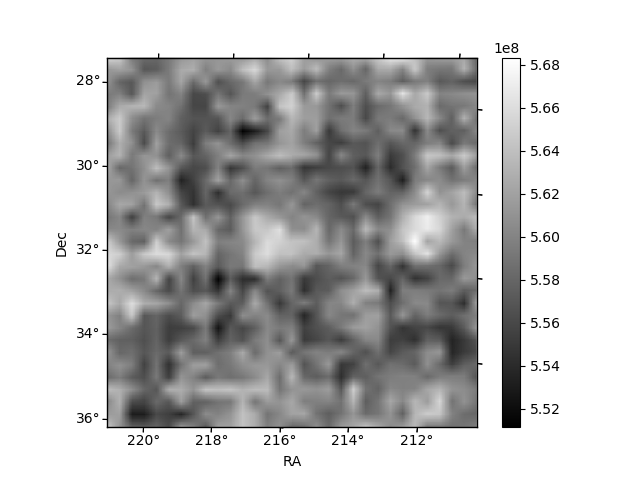
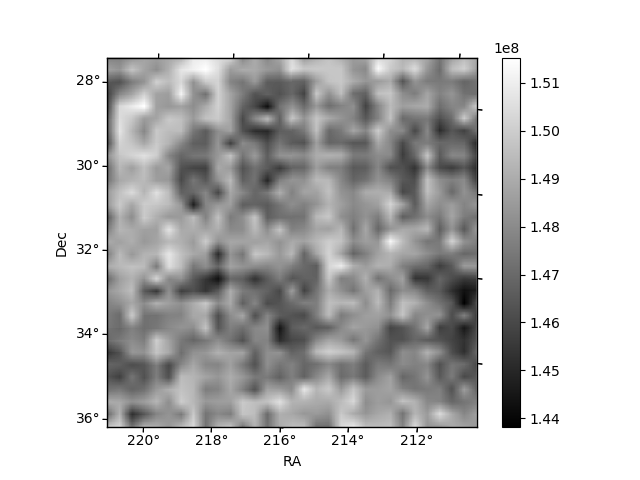
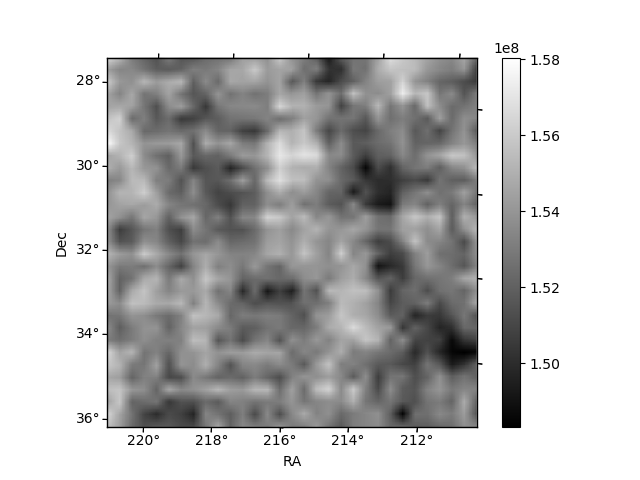
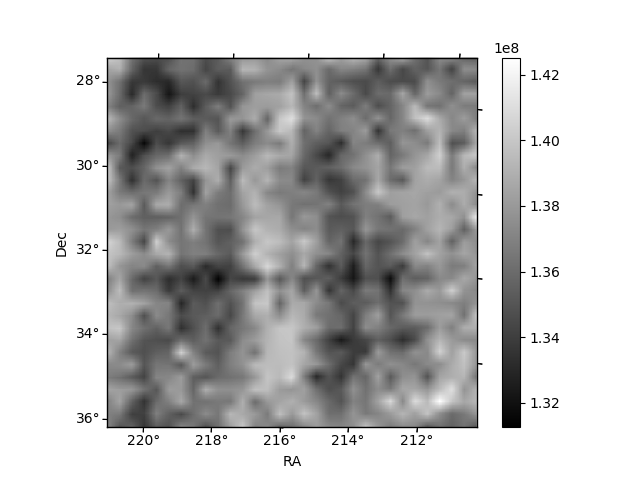
Histogram calculated using DETX and DETY for each event in the final _common_clean file
| Quadrant A | 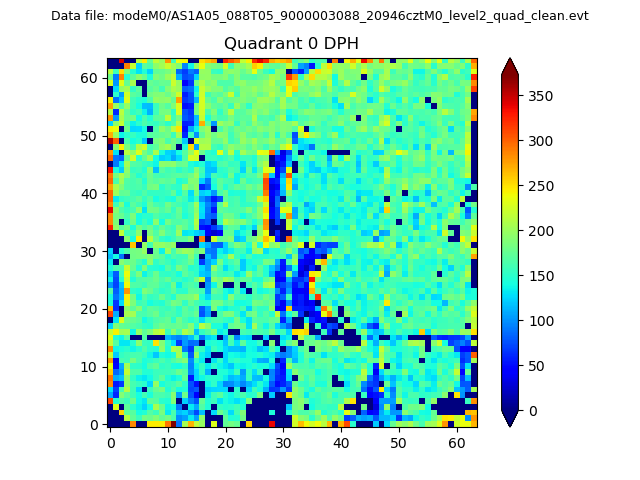 |
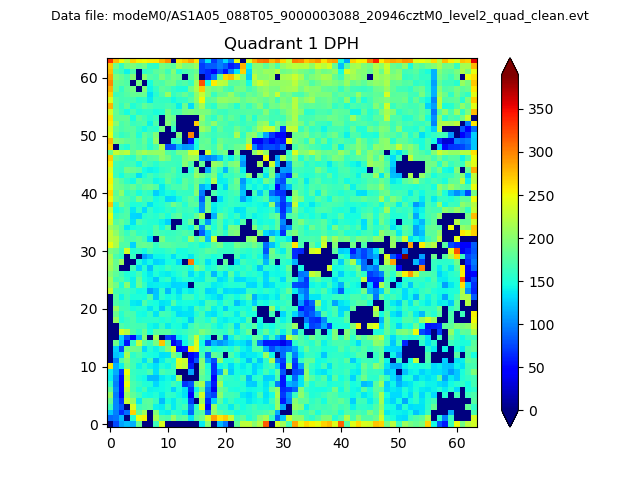 |
Quadrant B |
|---|---|---|---|
| Quadrant D | 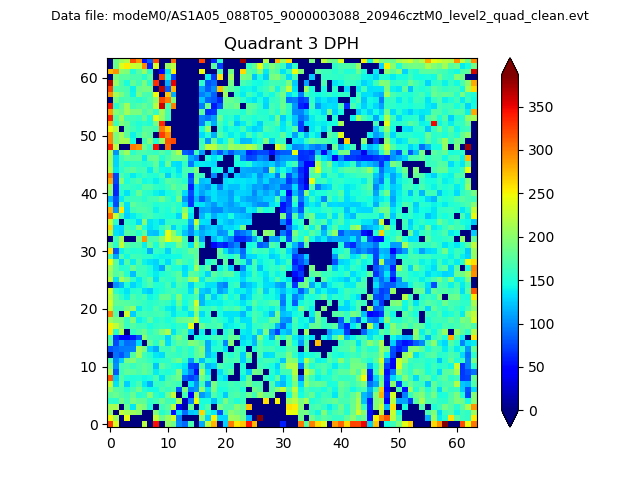 |
 |
Quadrant C |
| Plot type | Count rate plots | Images |
|---|---|---|
| Comparison with Poisson distribution Blue bars denote a histogram of data divided into 1 sec bins. Red curve is a Poisson curve with rate = median count rate of data. |
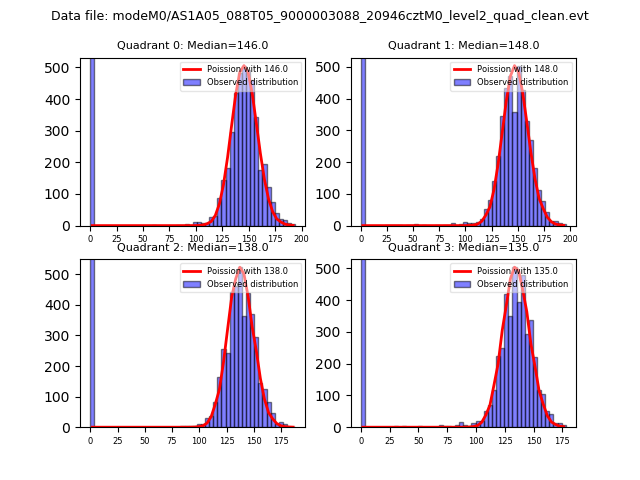 |
 |
| Quadrant-wise count rates Data is divided into 100 sec bins |
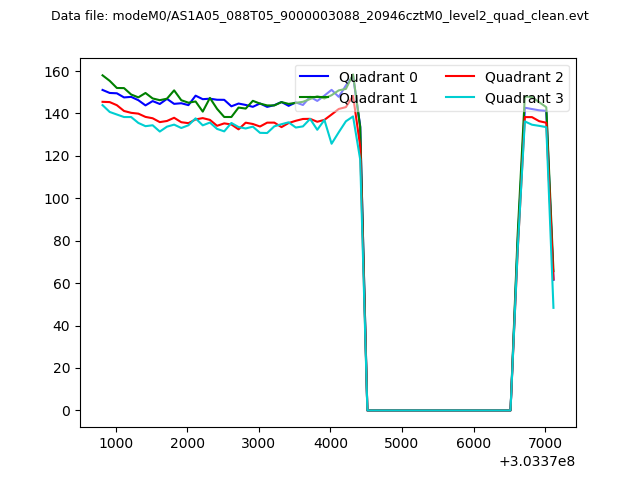 |
|
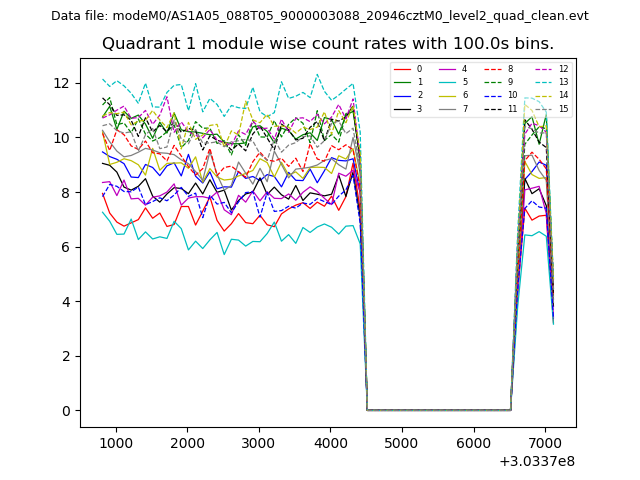
| Module-wise count rates for Quadrant A Data is divided into 100 sec bins |
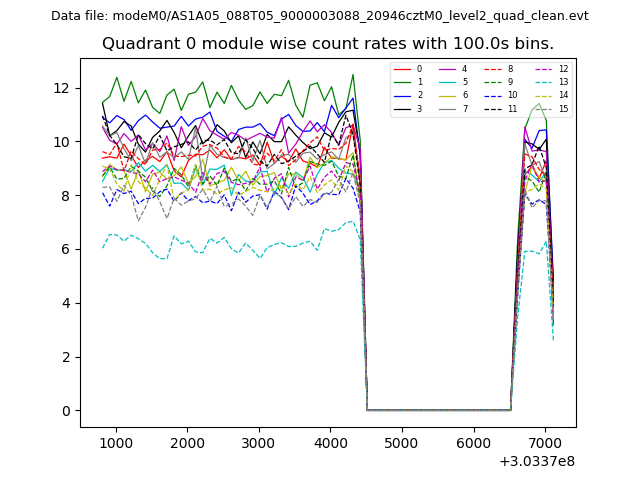 |
 |
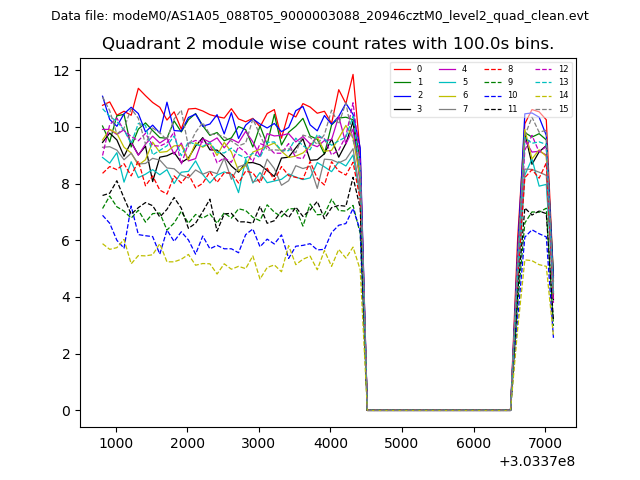
| Module-wise count rates for Quadrant B Data is divided into 100 sec bins |
 |
 |
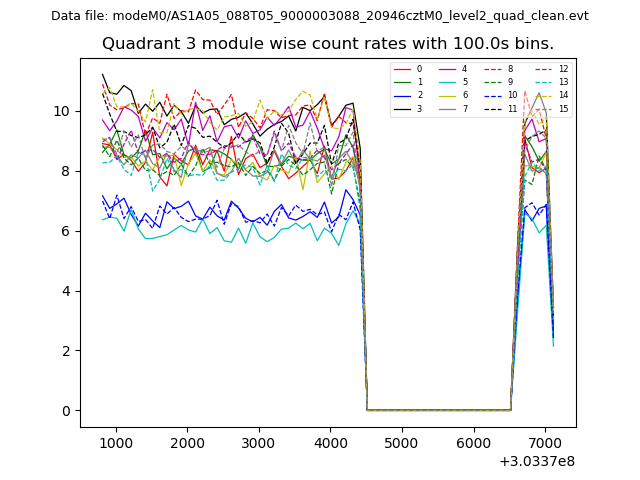
| Module-wise count rates for Quadrant C Data is divided into 100 sec bins |
 |
 |
| Module-wise count rates for Quadrant D Data is divided into 100 sec bins |
 |
 |
| Parameter | Plot |
|---|---|
| CZT HV Monitor | 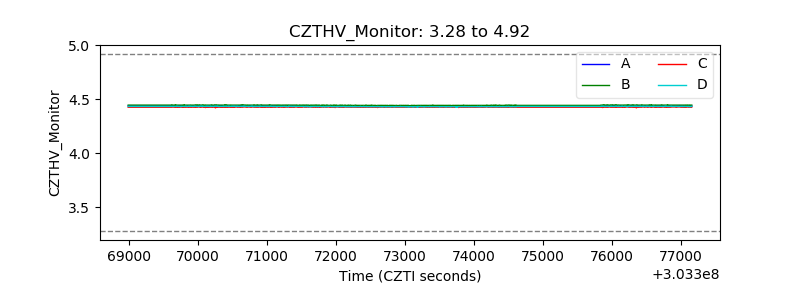 |
| D_VDD | 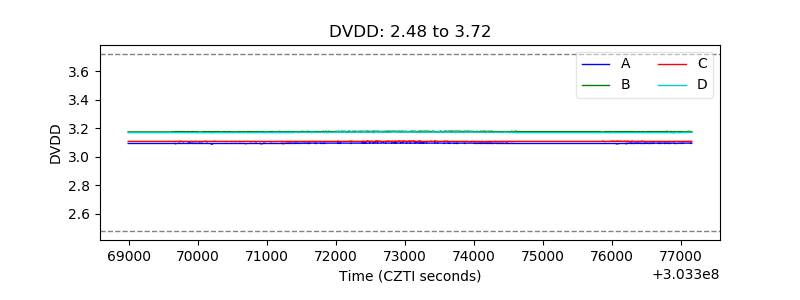 |
| Temperature 1 | 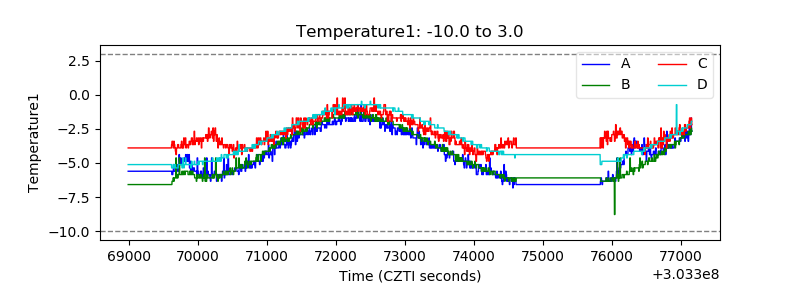 |
| Veto HV Monitor | 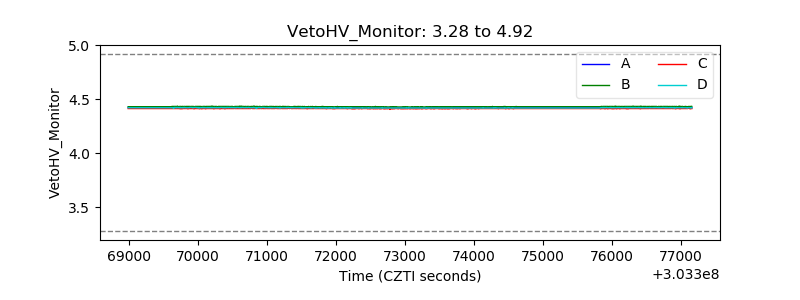 |
| Veto LLD | 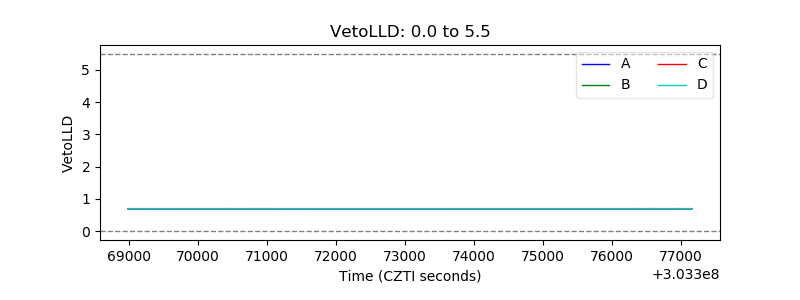 |
| Alpha Counter | 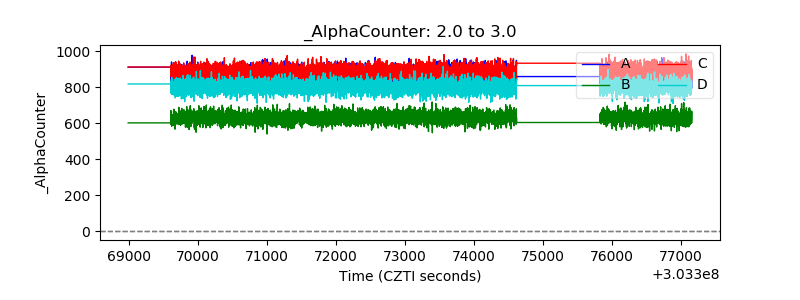 |
| _CPM_Rate | 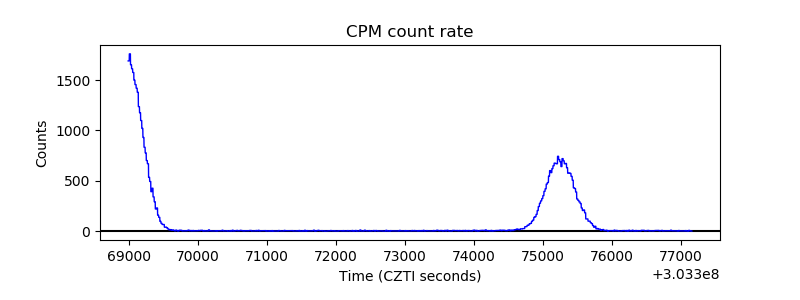 |
| CZT Counter | 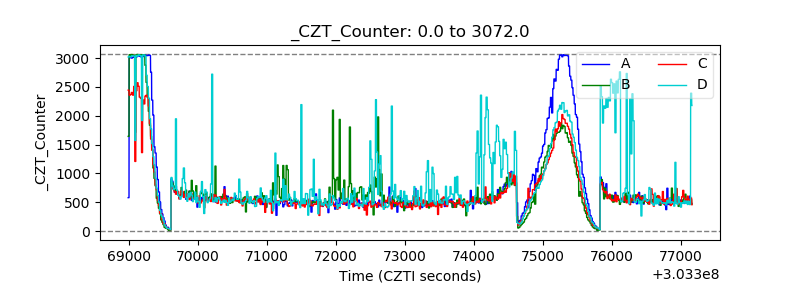 |
| +2.5 Volts monitor |  |
| +5 Volts monitor |  |
| _ROLL_ROT | 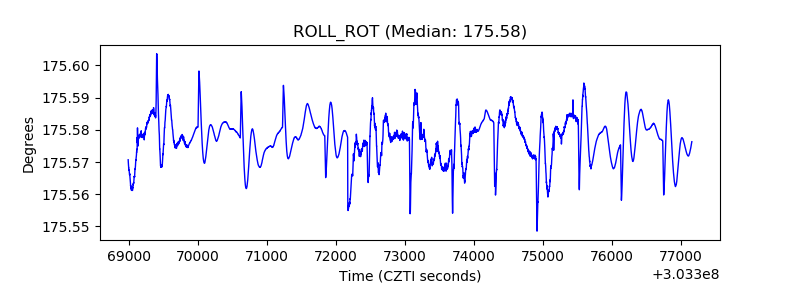 |
| _Roll_DEC | 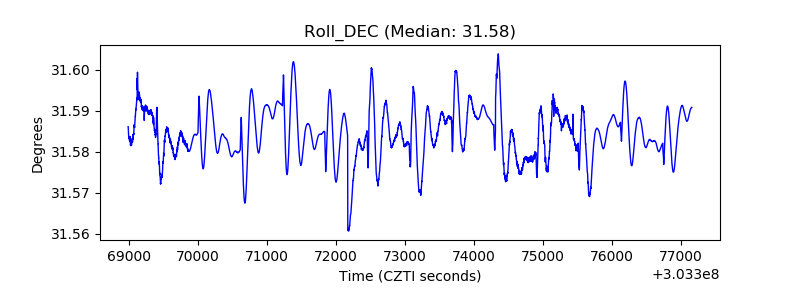 |
| _Roll_RA | 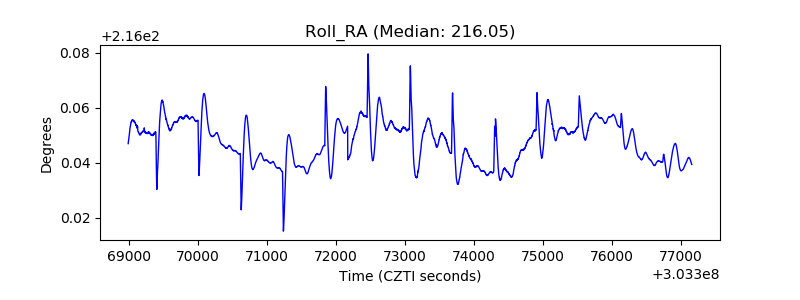 |
| Veto Counter | 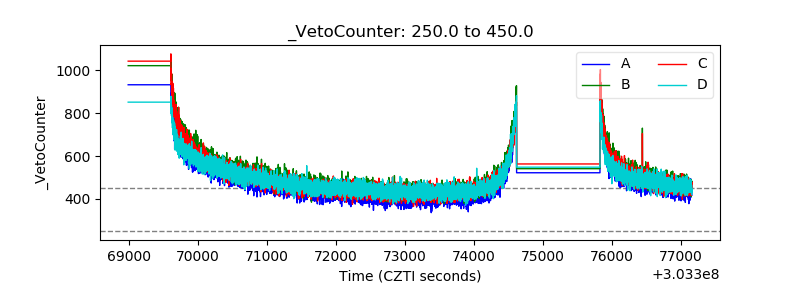 |