| Param | Original file | Final file |
|---|---|---|
| Filename | modeM0/AS1A05_088T05_9000003088_20948cztM0_level2.evt | modeM0/AS1A05_088T05_9000003088_20948cztM0_level2_quad_clean.evt |
| Size (bytes) | 555,307,200 | 103,694,400 |
| Size | 529.6 MB | 98.9 MB |
| Events in quadrant A | 3,530,054 | 678,942 |
| Events in quadrant B | 3,891,103 | 680,849 |
| Events in quadrant C | 3,510,304 | 648,215 |
| Events in quadrant D | 5,396,049 | 629,442 |
| Mode M9 | |||
|---|---|---|---|
| Quadrant | BADHDUFLAG | Total packets | Discarded packets |
| A | 0 | 5 | 0 |
| B | 0 | 5 | 0 |
| C | 0 | 5 | 0 |
| D | 0 | 5 | 0 |
| Mode M0 | |||
|---|---|---|---|
| Quadrant | BADHDUFLAG | Total packets | Discarded packets |
| A | 0 | 15017 | 2 |
| B | 0 | 15930 | 2 |
| C | 0 | 14997 | 2 |
| D | 0 | 21121 | 2 |
| Mode SS | |||
|---|---|---|---|
| Quadrant | BADHDUFLAG | Total packets | Discarded packets |
| A | 0 | 146 | 0 |
| B | 0 | 146 | 0 |
| C | 0 | 146 | 0 |
| D | 0 | 146 | 0 |
| Quadrant | Total seconds | Saturated seconds | Saturation percentage |
|---|---|---|---|
| A | 7224 | 140 | 1.937984% |
| B | 7225 | 206 | 2.851211% |
| C | 7225 | 165 | 2.283737% |
| D | 7225 | 299 | 4.138408% |
Noise dominated data is calculated using 1-second bins in cleaned event files. If a bin has >2000 counts, and if more than 50% of those come from <1% of pixels, then it is considered to be noise-dominated and hence unusable.
| Quadrant | # 1 sec bins | Bins with >0 counts | Bins with >2000 counts | High rate bins dominated by noise | Noise dominated (total time) | Noise dominated (detector-on time) | Marked lightcurve |
|---|---|---|---|---|---|---|---|
| A | 7729 | 7225 | 0 | 0 | 0.00% | 0.00% |  |
| B | 7730 | 7226 | 14 | 14 | 0.18% | 0.19% |  |
| C | 7730 | 7226 | 0 | 0 | 0.00% | 0.00% |  |
| D | 7730 | 7226 | 127 | 127 | 1.64% | 1.76% |  |
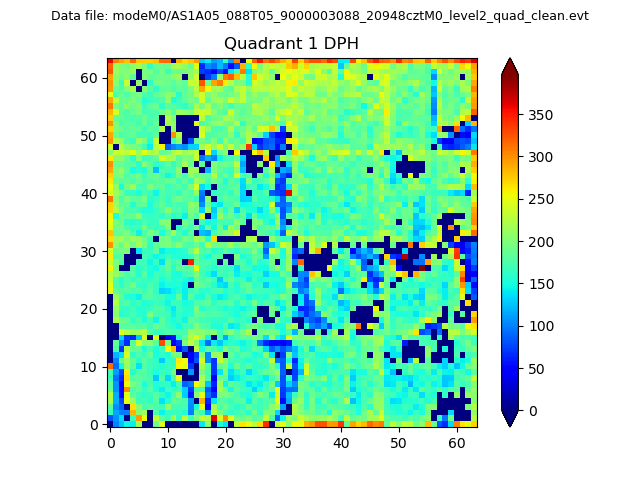
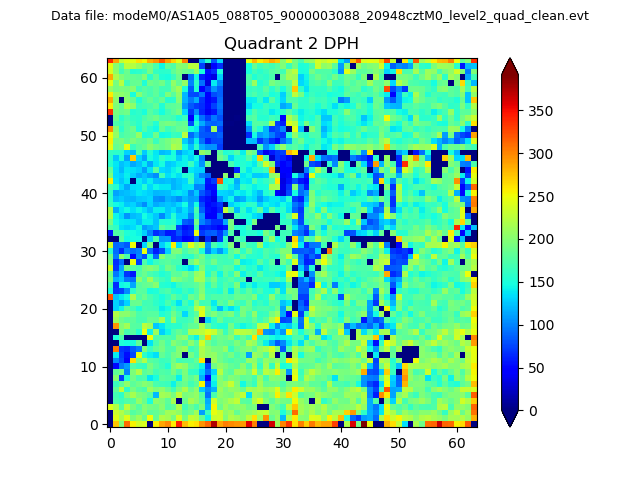
Top three noisy pixels from each quadrant. If the there are fewer than three noisy pixels in the level2.evt file, extra rows are filled as -1
| Pixel properties | Quadrant properties | ||||||
|---|---|---|---|---|---|---|---|
| Quadrant | DetID | PixID | Counts | Sigma | Mean | Median | Sigma |
| A | 5 | 16 | 28068 | 146.81 | 911 | 892 | 185.1 |
| A | 0 | 226 | 7853 | 37.61 | 911 | 892 | 185.1 |
| A | 3 | 137 | 7181 | 33.98 | 911 | 892 | 185.1 |
| B | 7 | 220 | 108460 | 621.13 | 902 | 878 | 173.2 |
| B | 3 | 64 | 65317 | 372.04 | 902 | 878 | 173.2 |
| B | 4 | 97 | 63014 | 358.74 | 902 | 878 | 173.2 |
| C | 14 | 238 | 136498 | 670.36 | 862 | 867 | 202.3 |
| C | 13 | 61 | 6081 | 25.77 | 862 | 867 | 202.3 |
| C | 10 | 91 | 5737 | 24.07 | 862 | 867 | 202.3 |
| D | 1 | 52 | 909609 | 4264.34 | 877 | 852 | 213.1 |
| D | 5 | 222 | 474754 | 2223.79 | 877 | 852 | 213.1 |
| D | 15 | 0 | 389016 | 1821.46 | 877 | 852 | 213.1 |
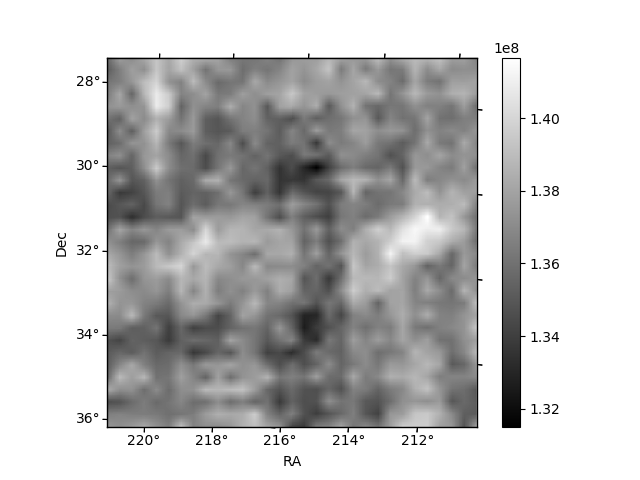
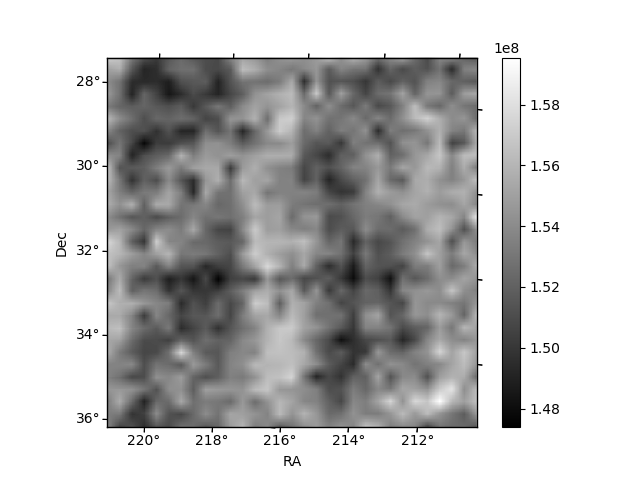
Histogram calculated using DETX and DETY for each event in the final _common_clean file
| Quadrant A | 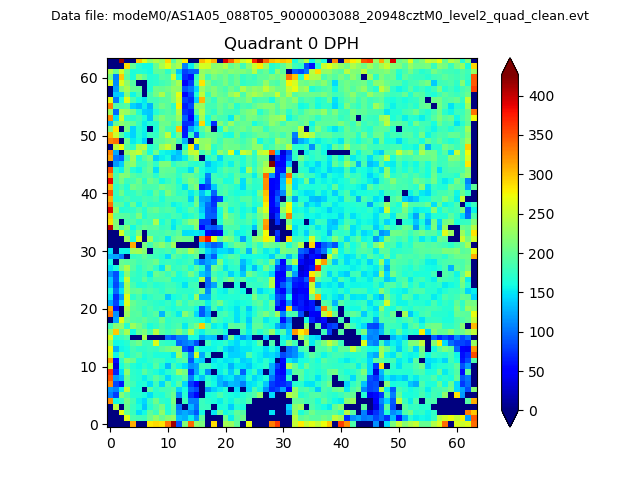 |
 |
Quadrant B |
|---|---|---|---|
| Quadrant D | 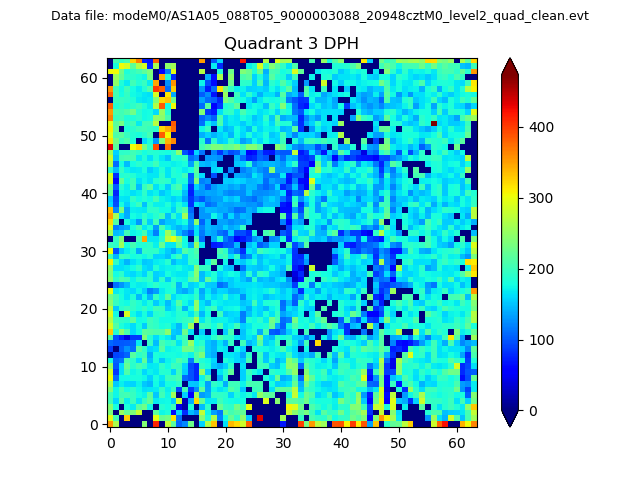 |
 |
Quadrant C |
| Plot type | Count rate plots | Images |
|---|---|---|
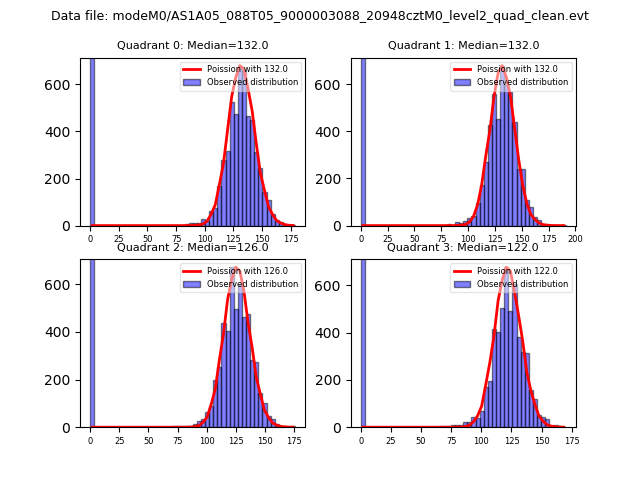
| Comparison with Poisson distribution Blue bars denote a histogram of data divided into 1 sec bins. Red curve is a Poisson curve with rate = median count rate of data. |
 |
 |
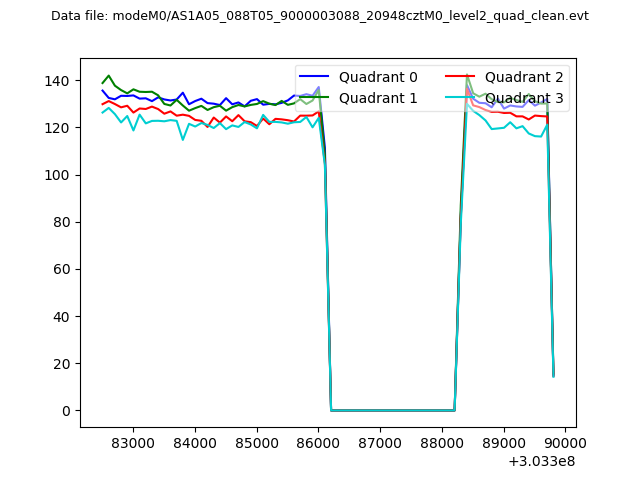
| Quadrant-wise count rates Data is divided into 100 sec bins |
 |
|
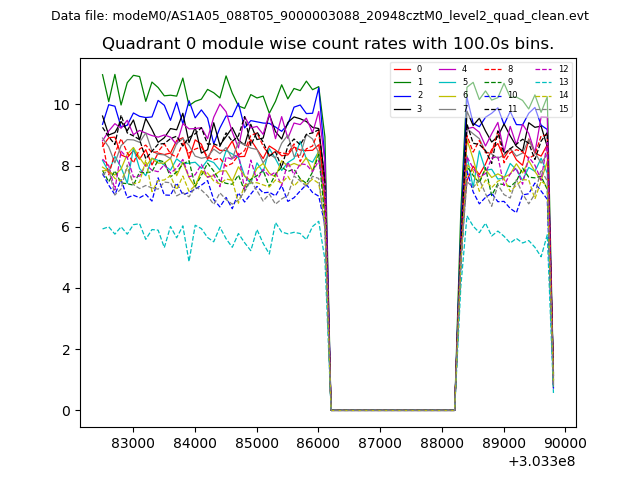
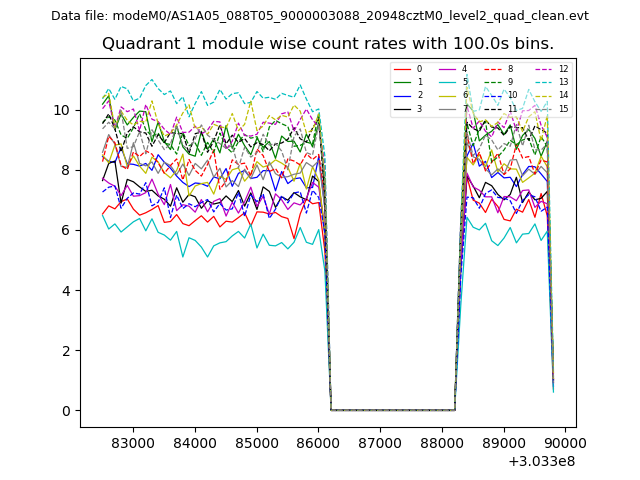
| Module-wise count rates for Quadrant A Data is divided into 100 sec bins |
 |
 |
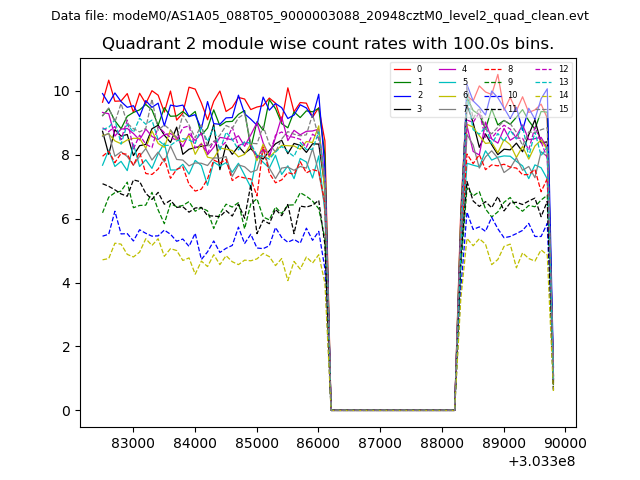
| Module-wise count rates for Quadrant B Data is divided into 100 sec bins |
 |
 |
| Module-wise count rates for Quadrant C Data is divided into 100 sec bins |
 |
 |
| Module-wise count rates for Quadrant D Data is divided into 100 sec bins |
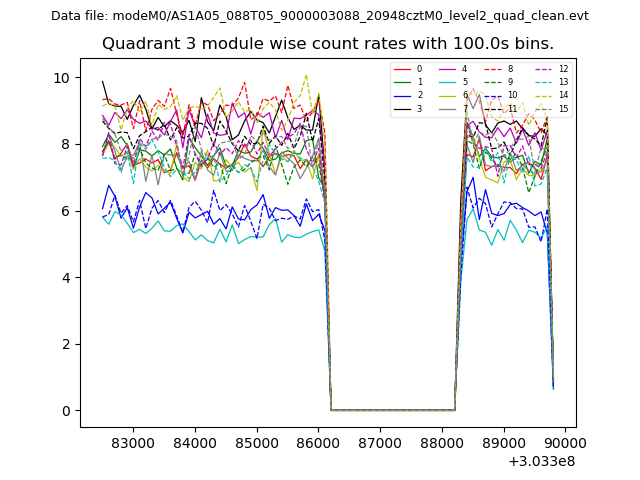 |
 |
| Parameter | Plot |
|---|---|
| CZT HV Monitor |  |
| D_VDD | 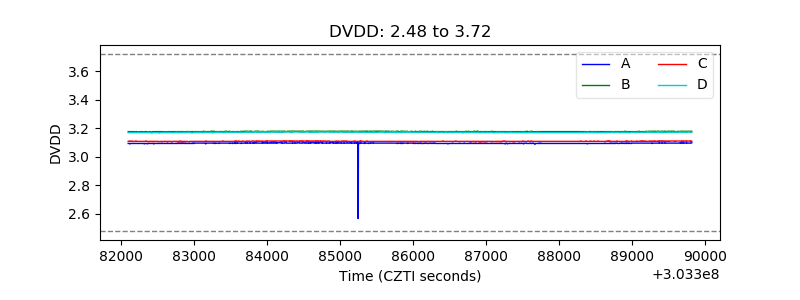 |
| Temperature 1 | 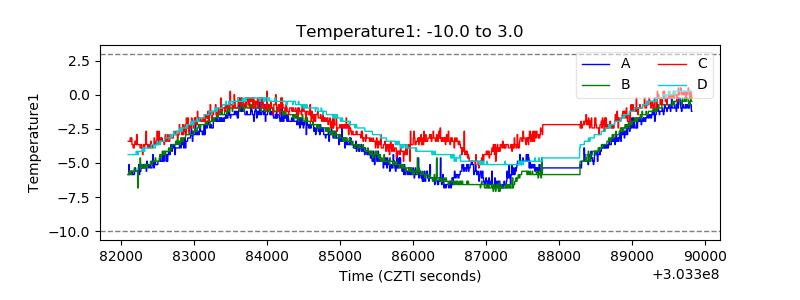 |
| Veto HV Monitor | 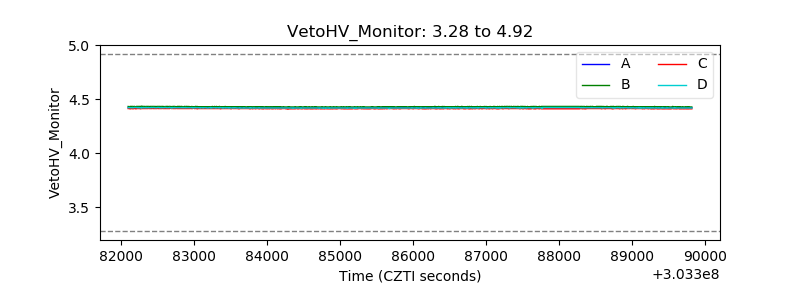 |
| Veto LLD |  |
| Alpha Counter | 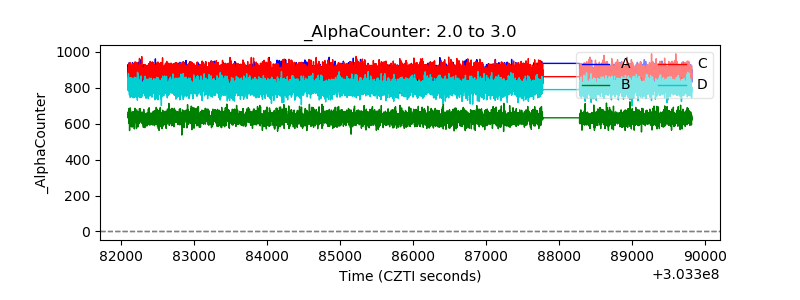 |
| _CPM_Rate | 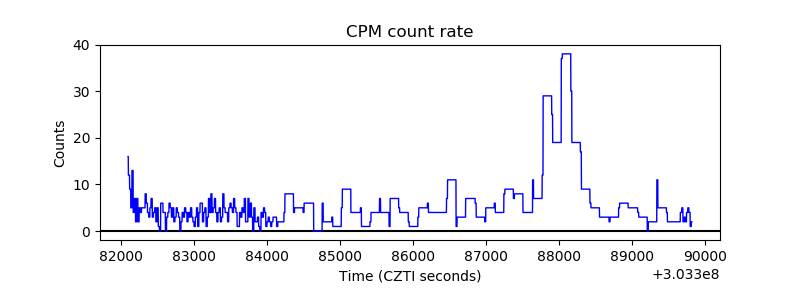 |
| CZT Counter | 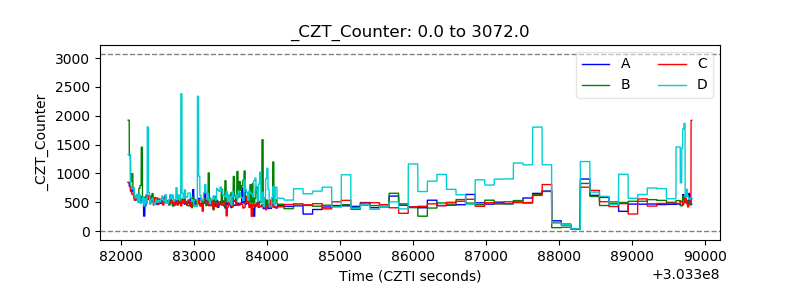 |
| +2.5 Volts monitor |  |
| +5 Volts monitor |  |
| _ROLL_ROT |  |
| _Roll_DEC | 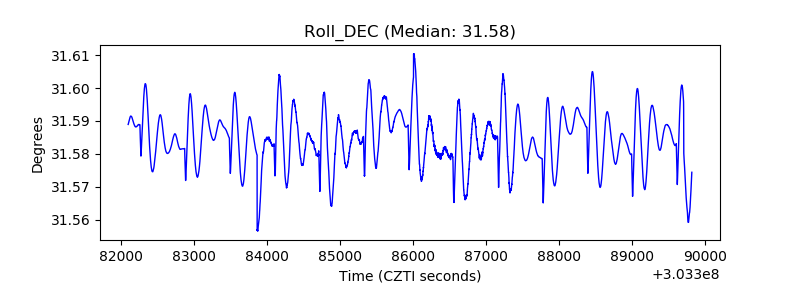 |
| _Roll_RA | 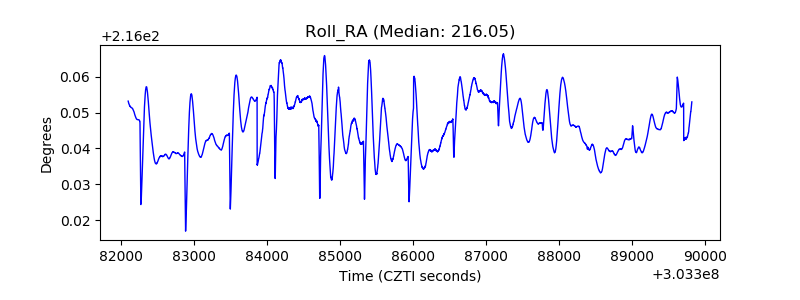 |
| Veto Counter | 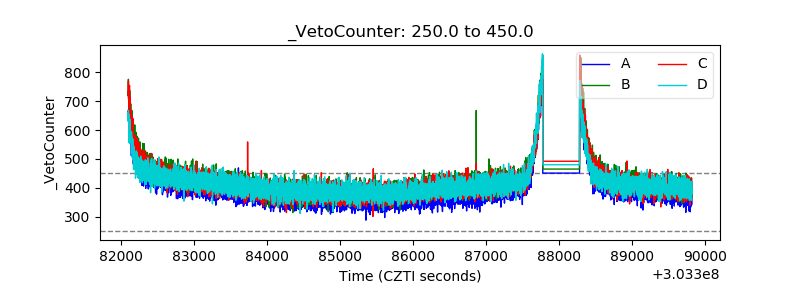 |